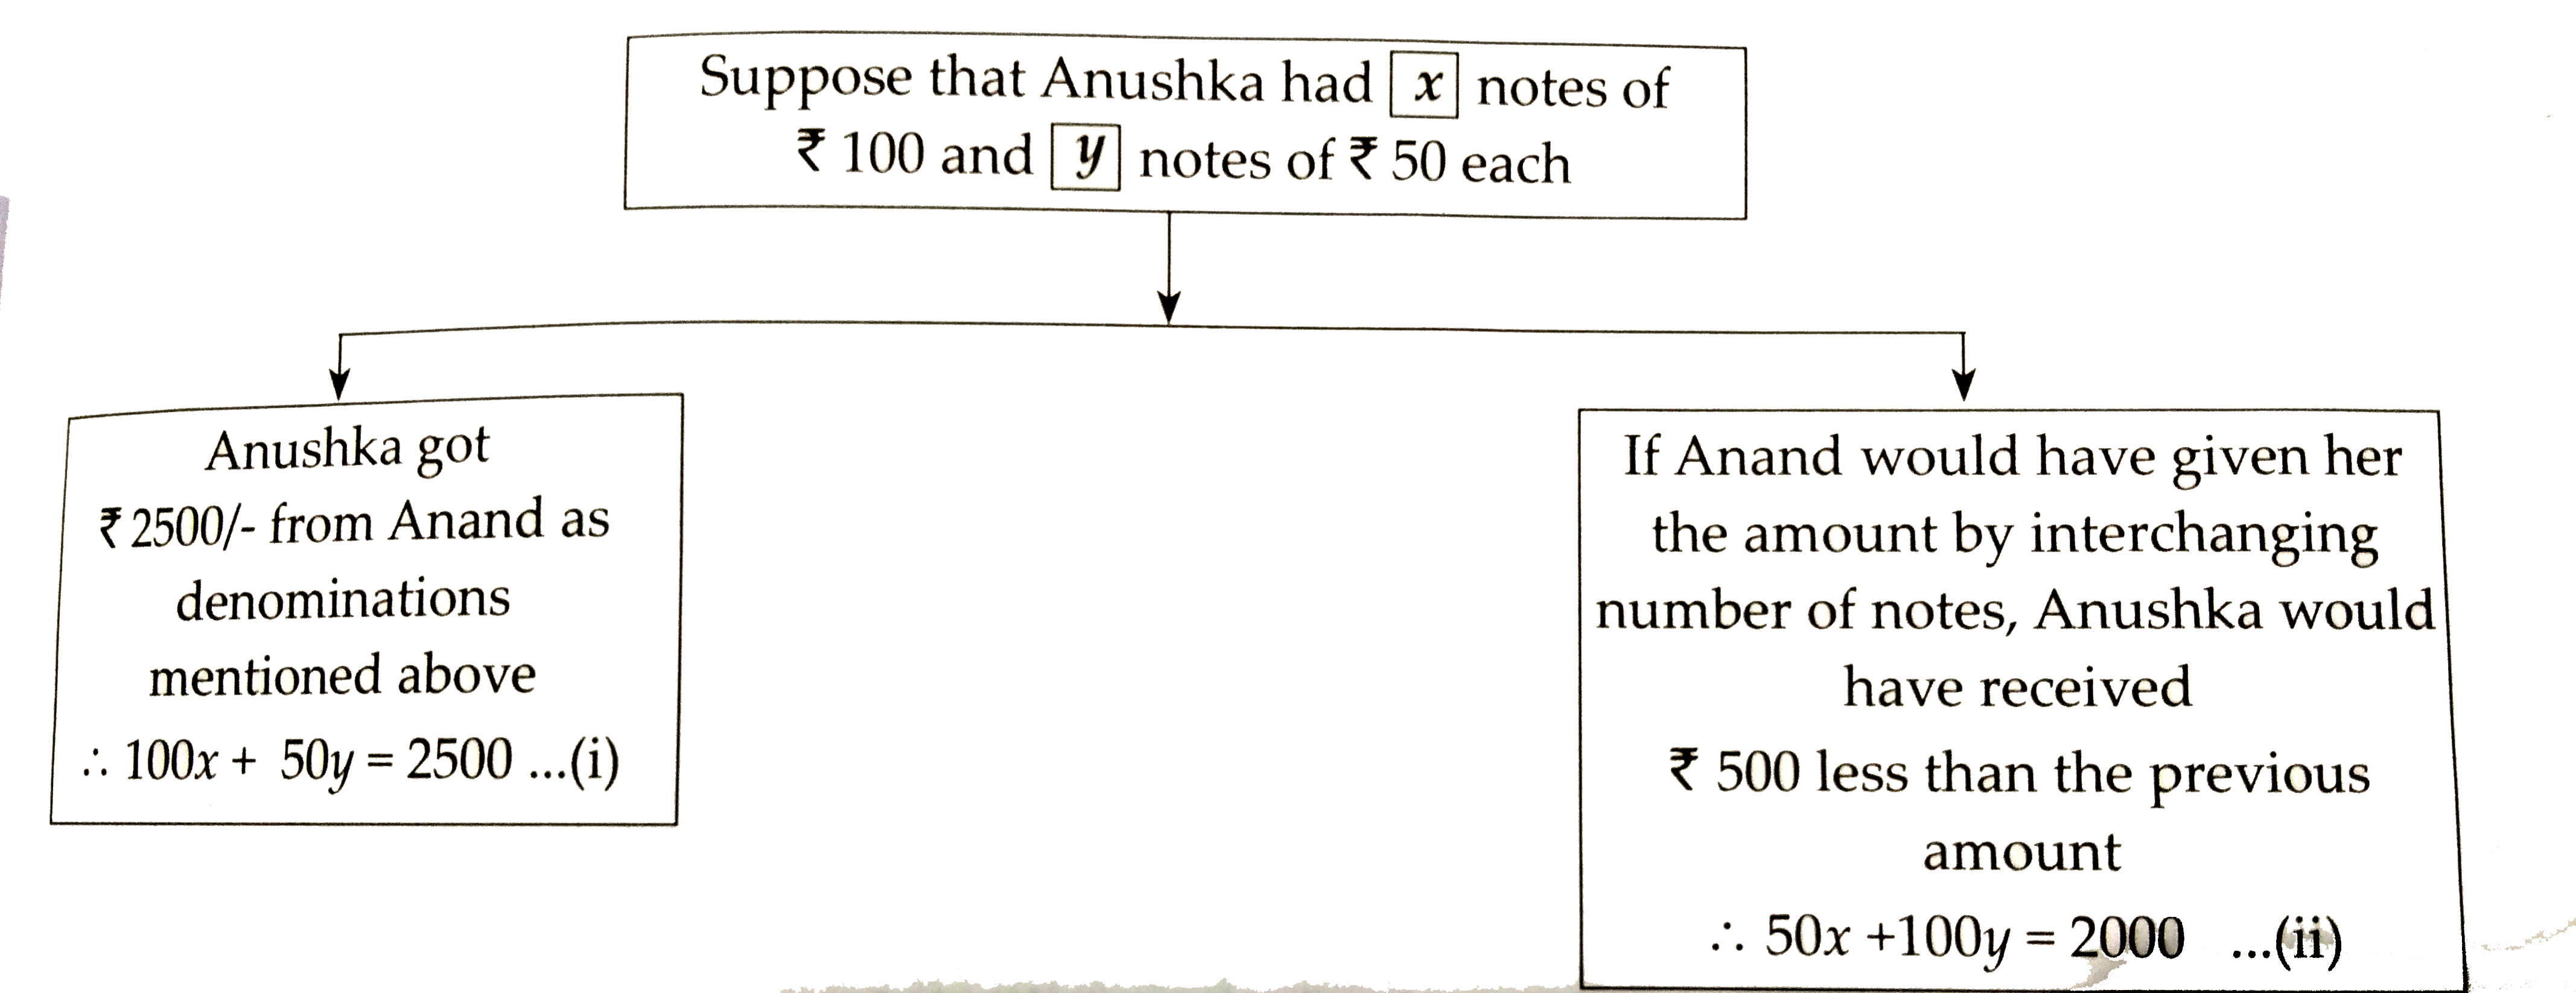
To find number of notes that Anushka had complete the following activity .
 Solution in Tamil
Step by step video & image solution for To find number of notes that Anushka had complete the following activity . by Maths experts to help you in doubts & scoring excellent marks in Class 10 exams.
Updated on:21/07/2023Topper's Solved these Questions
- LINEAR EQUATIONS IN TWO VARIABLES Book:CHETAN PUBLICATIONChapter:LINEAR EQUATIONS IN TWO VARIABLES Exercise:Problems for practice (Based on practice Set 1 . 1) Solve the following simultaneous equations :
Explore 7 Videos
- LINEAR EQUATIONS IN TWO VARIABLES Book:CHETAN PUBLICATIONChapter:LINEAR EQUATIONS IN TWO VARIABLES Exercise:Problems for practice (Based on practice Set 1 . 2) Solve the following simultaneous equations using Graphical method:
Explore 5 Videos
- LINEAR EQUATIONS IN TWO VARIABLES Book:CHETAN PUBLICATIONChapter:LINEAR EQUATIONS IN TWO VARIABLES Exercise:Practic set -1.5
Explore 6 Videos
- GEOMETRIC CONSTRUCTIONBook:CHETAN PUBLICATIONChapter:GEOMETRIC CONSTRUCTIONExercise:ASSIGNMENT
Explore 13 Videos
- MODEL ACTIVITY SHEET Book:CHETAN PUBLICATIONChapter:MODEL ACTIVITY SHEET Exercise:QUESTION
Explore 29 Videos
Similar Questions
x+y=10 ; 5x-3y=-6
View Solution13x+14y=4,56x−18y=4
View SolutionTwo numbers differ by 3 . The sum of twice te smaller number and thrice the greater number is 19 . Find the numbers .
View SolutionThe number of tangents that can be drawn to a circle at a point on the circle is………..
View SolutionWhat is the ratio of 1mm 1cm ?
View SolutionWhich of the following are correct chain isomers of butane ? (i)
View SolutionDetermine the point of symmetry of a regular hexagon.
View SolutionDtermine the images of the following figure about the given line :
View SolutionMatch the following Column A to Column B

View SolutionMatch the following Column A to Column B

View SolutionMatch the following Column A to Column B

View SolutionFind the area of figure given below.

View SolutionFind the perimeter of the figure given below.

View SolutionFind the area of the figure given below.

View SolutionThe inequation represented by the graph given below is :
View SolutionThe inequation that best describes the graph given below is _________
View Solution