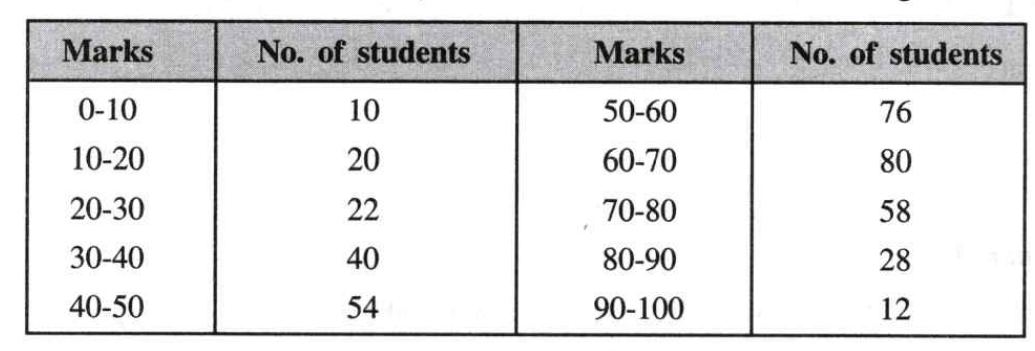
Use Graph paper for this question.
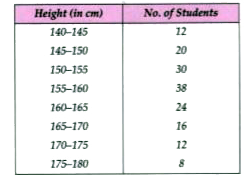
A survey regarding height ( in cm) of 60 boys belonging to Class 10 of a school was conducted. The following data was recorded.
Taking 2 cm = height of 10 cm along one axis and 2 cm = 10 boys along the other axis draw an ogive of the above distribution. Use the graph to estimate the following :
(iii) if above 158 cm is considered as the tall boys of the class. Find the number of boys in the class who are tall.
The correct Answer is:9
To solve the problem, we will follow these steps:
Step 1: Organize the Data
First, we need to organize the given data into a frequency distribution table. The heights and the corresponding number of boys should be recorded.
Step 2: Calculate Cumulative Frequency
Next, we will calculate the cumulative frequency for the data. This is done by adding the frequency of each class interval to the cumulative frequency of the previous interval.
Step 3: Draw the Ogive
Using graph paper, we will plot the cumulative frequency against the upper class boundaries. We will use the scale provided: 2 cm = 10 boys on the y-axis and 2 cm = 10 cm on the x-axis.
Step 4: Mark the Point for 158 cm
On the x-axis, we will mark the height of 158 cm and draw a vertical line up to the ogive curve.
Step 5: Estimate the Number of Tall Boys
From the point where the vertical line meets the ogive, we will draw a horizontal line to the y-axis to find the corresponding cumulative frequency. This value will represent the number of boys with heights less than or equal to 158 cm. We will subtract this value from the total number of boys (60) to find the number of boys taller than 158 cm.
Step 6: Conclusion
Finally, we will conclude by stating the number of boys considered tall based on the height criteria provided.
---
Detailed Solution:
1. Organize the Data:
Let's assume the following frequency distribution based on the survey (the actual data should be provided in the question):
Height(cm)|Frequency−−−−−−−−−−−−−−−−⊢−−−−−−−−140−145|4145−150|8150−155|12155−160|16160−165|10165−170∣10
2. Calculate Cumulative Frequency:
Height(cm)|Frequency|CuμlativeFrequency−−−−−−−−−−−−−−−−⊢−−−−−−−−−⊢−−−−−−−−−−−−−−−−−−−−140−145|4|4145−150|8|12150−155|12|24155−160|16|40160−165|10|50165−170|10|60
3. Draw the Ogive:
- Plot the cumulative frequency against the upper class boundaries (145, 150, 155, 160, 165, 170).
- Use the scale: 2 cm = 10 boys on the y-axis and 2 cm = 10 cm on the x-axis.
- Connect the points to form the ogive.
4. Mark the Point for 158 cm:
- On the x-axis, locate 158 cm.
- Draw a vertical line up to the ogive curve.
5. Estimate the Number of Tall Boys:
- From the intersection point on the ogive, draw a horizontal line to the y-axis.
- Suppose this line intersects the y-axis at approximately 48 boys.
- Therefore, the number of boys taller than 158 cm is:
\(
\text{Tall Boys} = 60 - 48 = 12
\)
6. Conclusion:
- The number of boys in the class who are considered tall (above 158 cm) is 12.
---
First, we need to organize the given data into a frequency distribution table. The heights and the corresponding number of boys should be recorded.
Next, we will calculate the cumulative frequency for the data. This is done by adding the frequency of each class interval to the cumulative frequency of the previous interval.
Using graph paper, we will plot the cumulative frequency against the upper class boundaries. We will use the scale provided: 2 cm = 10 boys on the y-axis and 2 cm = 10 cm on the x-axis.
On the x-axis, we will mark the height of 158 cm and draw a vertical line up to the ogive curve.
From the point where the vertical line meets the ogive, we will draw a horizontal line to the y-axis to find the corresponding cumulative frequency. This value will represent the number of boys with heights less than or equal to 158 cm. We will subtract this value from the total number of boys (60) to find the number of boys taller than 158 cm.
Finally, we will conclude by stating the number of boys considered tall based on the height criteria provided.
Let's assume the following frequency distribution based on the survey (the actual data should be provided in the question):
Height(cm)|Frequency−−−−−−−−−−−−−−−−⊢−−−−−−−−140−145|4145−150|8150−155|12155−160|16160−165|10165−170∣10
Height(cm)|Frequency|CuμlativeFrequency−−−−−−−−−−−−−−−−⊢−−−−−−−−−⊢−−−−−−−−−−−−−−−−−−−−140−145|4|4145−150|8|12150−155|12|24155−160|16|40160−165|10|50165−170|10|60
- Plot the cumulative frequency against the upper class boundaries (145, 150, 155, 160, 165, 170).
- Use the scale: 2 cm = 10 boys on the y-axis and 2 cm = 10 cm on the x-axis.
- Connect the points to form the ogive.
- On the x-axis, locate 158 cm.
- Draw a vertical line up to the ogive curve.
- From the intersection point on the ogive, draw a horizontal line to the y-axis.
- Suppose this line intersects the y-axis at approximately 48 boys.
- Therefore, the number of boys taller than 158 cm is:
\(
\text{Tall Boys} = 60 - 48 = 12
\)
- The number of boys in the class who are considered tall (above 158 cm) is 12.
Topper's Solved these Questions
Similar Questions
Use Graph paper for this question.
A survey regarding height ( in cm) of 60 boys belonging to Class 10 of a school was conducted. The following data was recorded.

Taking 2 cm = height of 10 cm along one axis and 2 cm = 10 boys along the other axis draw an ogive of the above distribution. Use the graph to estimate the following :
(i) the median
View SolutionA survey reagarding the heights ( in cm) of 50 girls of class X of a school was conducted and the following data was obtained. Find the mean

View SolutionA survery regrding the heights (in cm ) of 50 girls of a class conducted and the following data was obatained.

Find the mean of above data.
View SolutionThe marks obtained (out of 100) by 400 students in an examination are given below:

Using a graph paper, draw an ogive for the above distribution. Use ogive to estimate the following: estimate the median.
View SolutionThe weight of 50 workers is given below :

Draw an ogive of the given distribution using a graph sheet. Take 2 cm = 10 kg on one axis and 2 cm = 5 workers along the other axis. Use a graph to estimate the following: if weight 95 kg and above is considered overweight find the number of workers who are overweight.
View SolutionThe following table shows the distribution of the heights of a group of students:

Use a graph sheet to draw an Ogive for the distribution. Use the Ogive to find:
the inter quartile range
View SolutionThe following distribution represents the height of 160 students of a school.

Draw an ogive for the given distribution taking 2 cm = 5 cm of height on one axis and 2 cm = 20 cm students on the other axis. Using the graph, determine.
(i) The median height.
View SolutionThe weight of 50 workers is given below :

Draw an ogive of the given distribution using a graph sheet. Take 2 cm = 10 kg on one axis and 2 cm = 5 workers along the other axis. Use a graph to estimate the following the upper and lower quartiles.
View SolutionThe marks obtained (out of 100) by 400 students in an examination are given below:

Using a graph paper, draw an ogive for the above distribution. Use ogive to estimate the following: estimate the number of students who obtained more than 80% marks in the examination.
View SolutionThe following table shows the distribution of the heights of a group of students:

Use a graph sheet to draw an Ogive for the distribution. Use the Ogive to find:
the number of students whose height is more than 168 cm
View Solution
