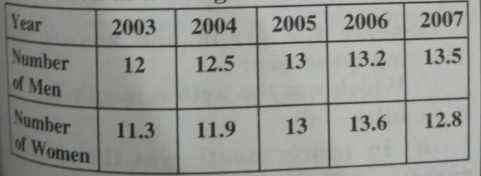
Use the tables below to draw linear graphs.
Population (in thousads ) of men and women in a village in different years:
 Solution in Punjabi
Step by step video & image solution for Use the tables below to draw linear graphs.Population (in thousads ) of men and women in a village in different years: by Maths experts to help you in doubts & scoring excellent marks in Class 8 exams.
Updated on:21/07/2023Topper's Solved these Questions
Similar Questions
Plot the points(5,0),(0.5),(2,5),(5,2)and (6,3) in the cartesian plane by using a graph paper.
View SolutionFind the H.C.F. of the following :
2xy,6x2y3,8x3y2.
View SolutionWhen water freezes its volume increases by 4%.What volumeof water is required to make 221cm3 of ice?
View SolutionHow many lines of symmetry does the above figure have ?
View SolutionWhich of the following are correct chain isomers of butane ? (i)
View SolutionDetermine the point of symmetry of a regular hexagon.
View SolutionDtermine the images of the following figure about the given line :
View SolutionDraw the bisector of ∠AOB=58∘
ltimg src="https://d10lpgp6xz60nq.cloudfront.net/physics_images/PS_MATH_VII_C05_S01_009_Q01.png" width="80%"gt
View SolutionMatch the following Column A to Column B

View SolutionMatch the following Column A to Column B

View SolutionMatch the following Column A to Column B

View SolutionFind the area of figure given below.

View SolutionFind the perimeter of the figure given below.

View SolutionFind the area of the figure given below.

View SolutionThe area of the shaded part in the figure given below is ______.

View SolutionThe inequation represented by the graph given below is :
View Solution
