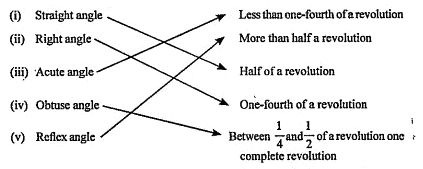
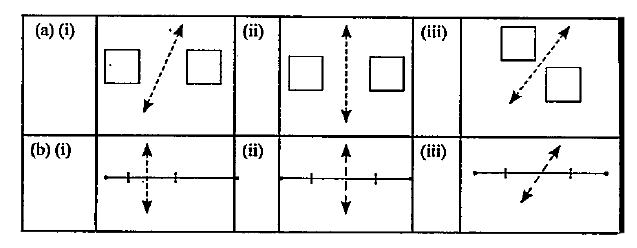
Verify whether D is the mid point of ¯¯¯¯¯¯AG.
 Solution in Punjabi
The correct Answer is:D is the midpoint AG
Step by step video, text & image solution for Verify whether D is the mid point of bar (AG). by Maths experts to help you in doubts & scoring excellent marks in Class 6 exams.
Updated on:21/07/2023Topper's Solved these Questions
- UNDERSTANDING ELEMENTARY SHAPES BOOK - NAND LAL PUBLICATIONCHAPTER - UNDERSTANDING ELEMENTARY SHAPES EXERCISE - EXERCISE - 5.2
10 Videos
- UNDERSTANDING ELEMENTARY SHAPES BOOK - NAND LAL PUBLICATIONCHAPTER - UNDERSTANDING ELEMENTARY SHAPES EXERCISE - EXERCISE - 5.3
2 Videos
- UNDERSTANDING ELEMENTARY SHAPES BOOK - NAND LAL PUBLICATIONCHAPTER - UNDERSTANDING ELEMENTARY SHAPES EXERCISE - Do this
12 Videos
- SYMMETRYBOOK - NAND LAL PUBLICATIONCHAPTER - SYMMETRYEXERCISE - SAMPLE PAPER FOR PRACTICE
8 Videos
- WHOLE NUMBERS BOOK - NAND LAL PUBLICATIONCHAPTER - WHOLE NUMBERS EXERCISE - SAMPLE PAPER FOR PRACTICE
16 Videos
Similar Questions
What fraction of a clockwise revolution does the hour hand of a clock turn through when it goes from
12 to 6
View SolutionMatch the following.

View SolutionYou think it is possible to sketch an obtuse angled equilateral triangle ?
View SolutionWhich of the two figures are the images of each other ( mirror line is the dotted line )

View SolutionThe difference between the successor and predecessor of a number is
View SolutionHow many lines of symmetry does the above figure have ?
View SolutionWhich of the following are correct chain isomers of butane ? (i)
View SolutionDetermine the point of symmetry of a regular hexagon.
View SolutionDtermine the images of the following figure about the given line :
View SolutionMatch the following Column A to Column B

View SolutionMatch the following Column A to Column B

View SolutionMatch the following Column A to Column B

View SolutionFind the area of the figure given below.

View SolutionThe area of the shaded part in the figure given below is ______.

View SolutionThe inequation represented by the graph given below is :
View SolutionThe inequation that best describes the graph given below is _________
View Solution
