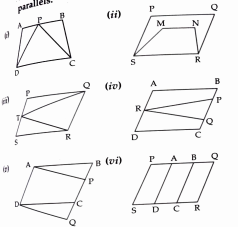
Which of the following figures lie on the same base and between the same parallels. Insuch a case, write the common base and the two parallels.
 Solution in Punjabi
The correct Answer is:I,III,IV
Step by step video, text & image solution for Which of the following figures lie on the same base and between the same parallels. Insuch a case, write the common base and the two parallels. by Maths experts to help you in doubts & scoring excellent marks in Class 9 exams.
Topper's Solved these Questions
- BOOK - SWAN PUBLICATIONCHAPTER - AREAS OF PARALLELOGRAMS AND TRIANGLES EXERCISE - EXERCISE 9.28videos
AREAS OF PARALLELOGRAMS AND TRIANGLES
- BOOK - SWAN PUBLICATIONCHAPTER - AREAS OF PARALLELOGRAMS AND TRIANGLES EXERCISE - EXERCISE 9.321videos
AREAS OF PARALLELOGRAMS AND TRIANGLES
- BOOK - SWAN PUBLICATIONCHAPTER - CIRCLESEXERCISE - Objective Type Questions (Fill in the Blanks :)10videos
CIRCLES
Similar Questions
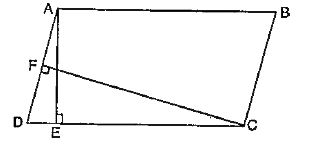
In Fig ., ABCD is parallologram , AE⊥DCandCF⊥AD . If AB= = 16 cm , AE = 8 cm and CF = 10 cm , find AD .
 01:37View Solution
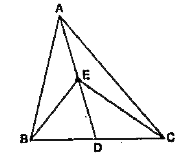
In Fig ., E is any point on median AD of a ΔABC . Show that ar (ABE = ar (ACE) .
 06:07View Solution
............... is the longest chord of the circle.
02:11View SolutionHow many lines of symmetry does the above figure have ?
01:31View SolutionWhich of the following are correct chain isomers of butane ? (i)
02:45View SolutionDetermine the point of symmetry of a regular hexagon.
02:17View SolutionDtermine the images of the following figure about the given line :
05:41View SolutionMatch the following Column A to Column B
 02:21View Solution
Match the following Column A to Column B
 02:03View Solution
Match the following Column A to Column B
 02:10View Solution
Find the area of the figure given below.
 02:17View Solution
The area of the shaded part in the figure given below is ______.
 02:10View Solution
The inequation represented by the graph given below is :
04:23View SolutionThe inequation that best describes the graph given below is _________
01:19View SolutionThe inequation that best describes the following graph is _________
02:41View SolutionWhich inequations represent the shaded region in the given figure
01:52View Solution

