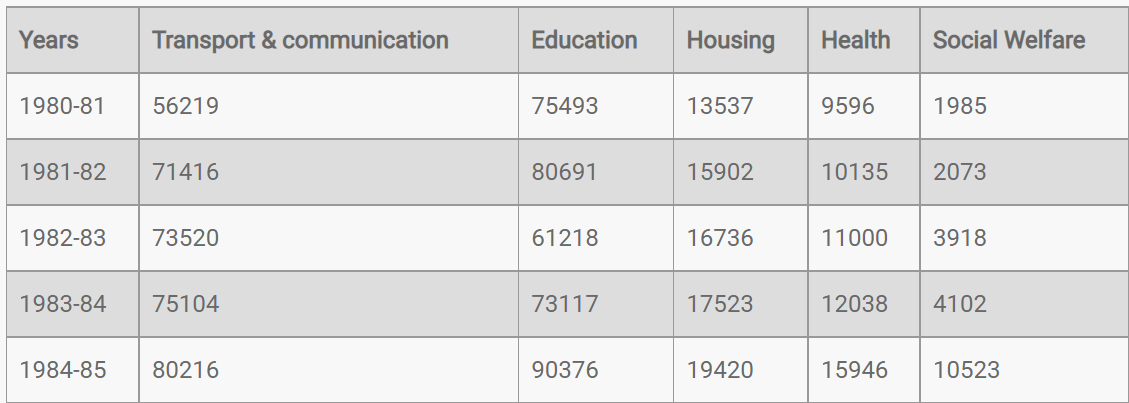
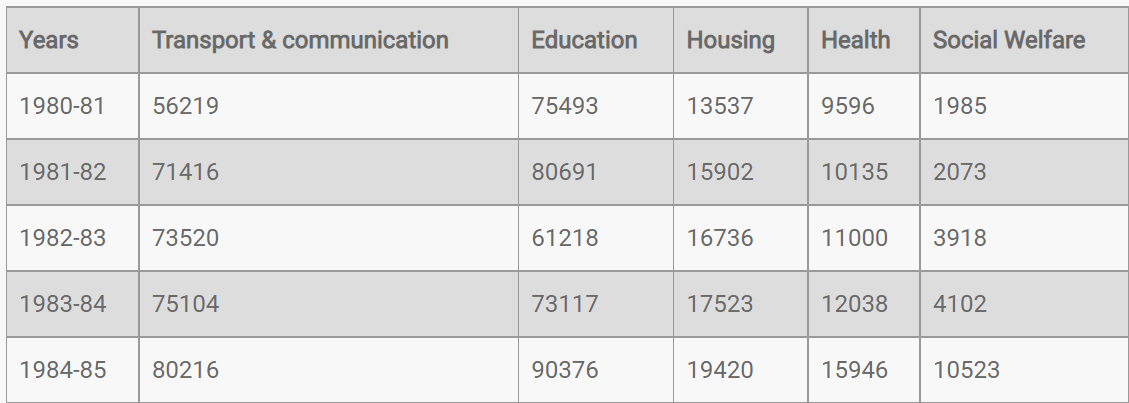
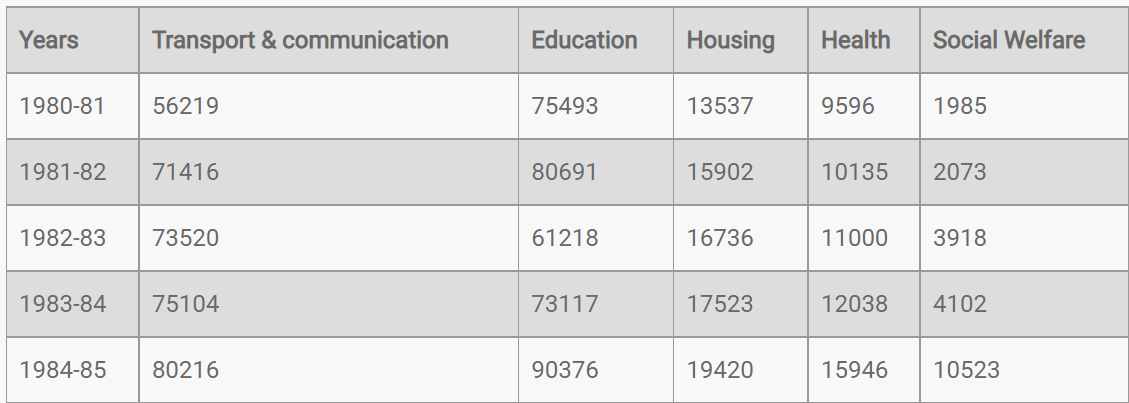
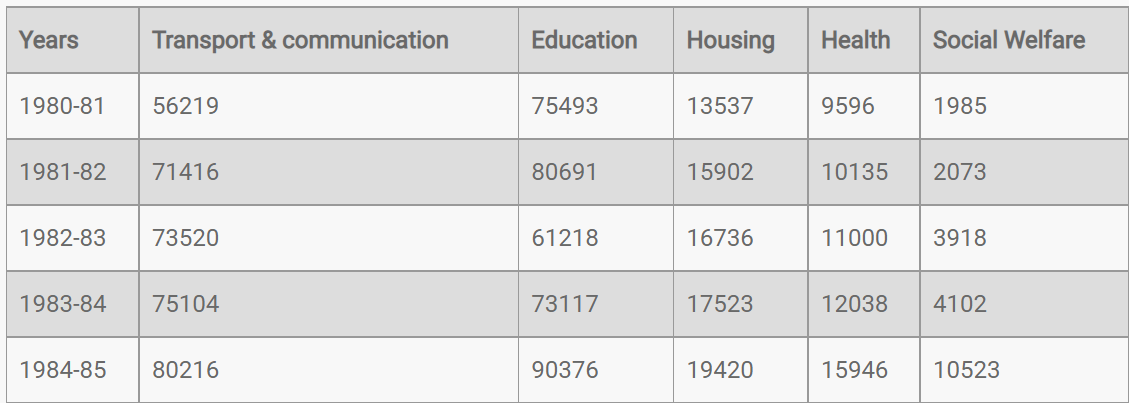
The following data give year wise outlay in lakhs of rupees in a certain 5 year plan (1980-1985) of a state ,under the heads :
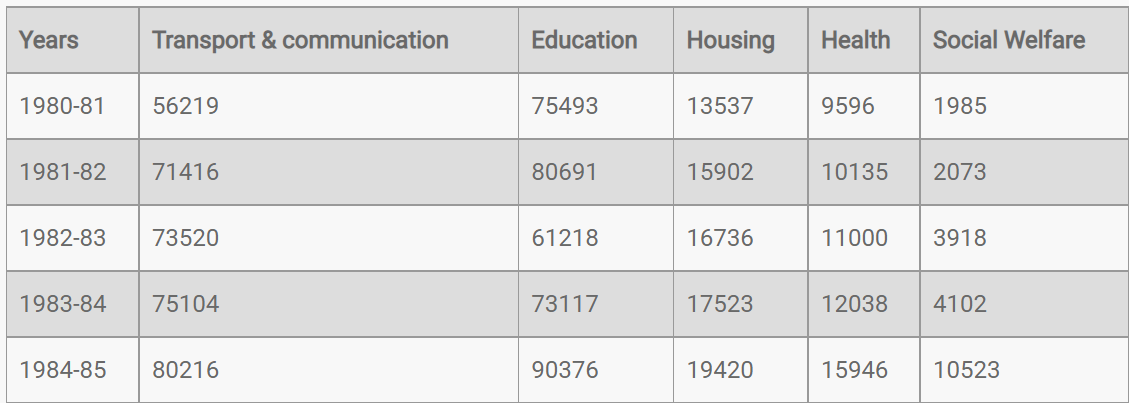
Putting the data in the form of a table ,write the total under each head and answer the following question -----
What is the ratio between outlay on Transport & communication and Housing during 1984-85?
Ratio between outlay on (transport and communication) and housing during 1984-85 is = 80216 : 19420 = 4.13 : 1 = ( 413 : 100)
Related Playlists
Knowledge Check
- Question 1 - Select One
Refer the following data table and answer the question.
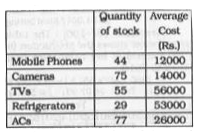
What is the value of the total stock (in lakh rupees) ?A81.97B819.7C161D280 - Question 1 - Select One
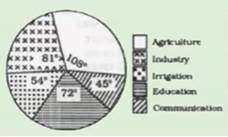
The pie-chart shows the proposed outlay fdor different sectors during a Five-Year plan of Government of India. Total outlay is Rs. 40,000 crores. By reading the pie-chart answer the following three questions.
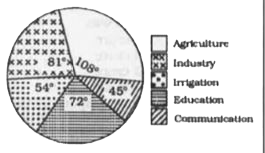
What is the ratio between the proposed outlay of Irrigation and Communication?A9:8B3:2C9:5D6:5 - Question 1 - Select One
The pie-chart shows the proposed outlay fdor different sectors during a Five-Year plan of Government of India. Total outlay is Rs. 40,000 crores. By reading the pie-chart answer the following three questions.
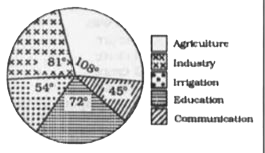
What is the proposed outlay for Education?ARs. 6000 croresBRs. 8000 croresCRs. 9000 croresDRs. 7000 crores - Question 1 - Select One
Directions for questions : These questions are based on the following data. Read the following bar graph and answer the following.
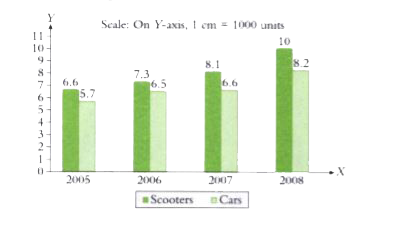
Find the ratio between the total number of vehicles sold (scooters and cars) in the year 2006 and that in the year 2008.A41:46B69:91C147:182D46:49
Similar Questions
The following data give year wise outlay in lakhs of rupees in a certain 5 year plan (1980-1985) of a state ,under the heads :

Putting the data in the form of a table ,write the total under each head and answer the following question -----
What is the ratio between outlay on Transport & communication and Housing during 1984-85?View SolutionThe following data give year wise outlay in lakhs of rupees in a certain 5 year plan (1980-1985) of a state ,under the heads :
Putting the data in the form of a table ,write the total under each head and answer the following question -----
What is total outlay on Social Welfare during the plan period __ (lakhs )?View SolutionThe following data give year wise outlay in lakhs of rupees in a certain 5 year plan (1980-1985) of a state ,under the heads :
Putting the data in the form of a table ,write the total under each head and answer the following question -----
During which year the outlay on education was maximum ?View SolutionThe following data give year wise outlay in lakhs of rupees in a certain 5 year plan (1980-1985) of a state ,under the heads :
How many times ,the outlay on Education was increased over preceding year ?View SolutionThe following data give year wise outlay in lakhs of rupees in a certain 5 year plan (1980-1985) of a state ,under the heads :
Putting the data in the form of a table ,write the total under each head and answer the following question -----
What is the percentage increase during 1983-84 over 1982-83 in health outly ?View SolutionDirections : The pie chart shows the proposed outlay for different sectors during a Five-Year plan of Government of India. Total outlay is Rs. 40,000 crores. By reading the pie-chart answer the following three questions.
find the proposed outlay of outlay of Irrigation and Communication ?View Solution

