Complete Solutions to PROBLEM FOR PRACTICE (Based on practice set ) of chapter STATISTICS of Class 10 book with complete answers and questions
| Class 10 | MATHS |
| Chapter | STATISTICS |
| CHETAN PUBLICATION | PROBLEM FOR PRACTICE (Based on practice set ) |
| Number Of Questions | 26 |
| Academic Year | 2023-24 |
Find the mean marks of the student from the following cumulative frequency distribution .
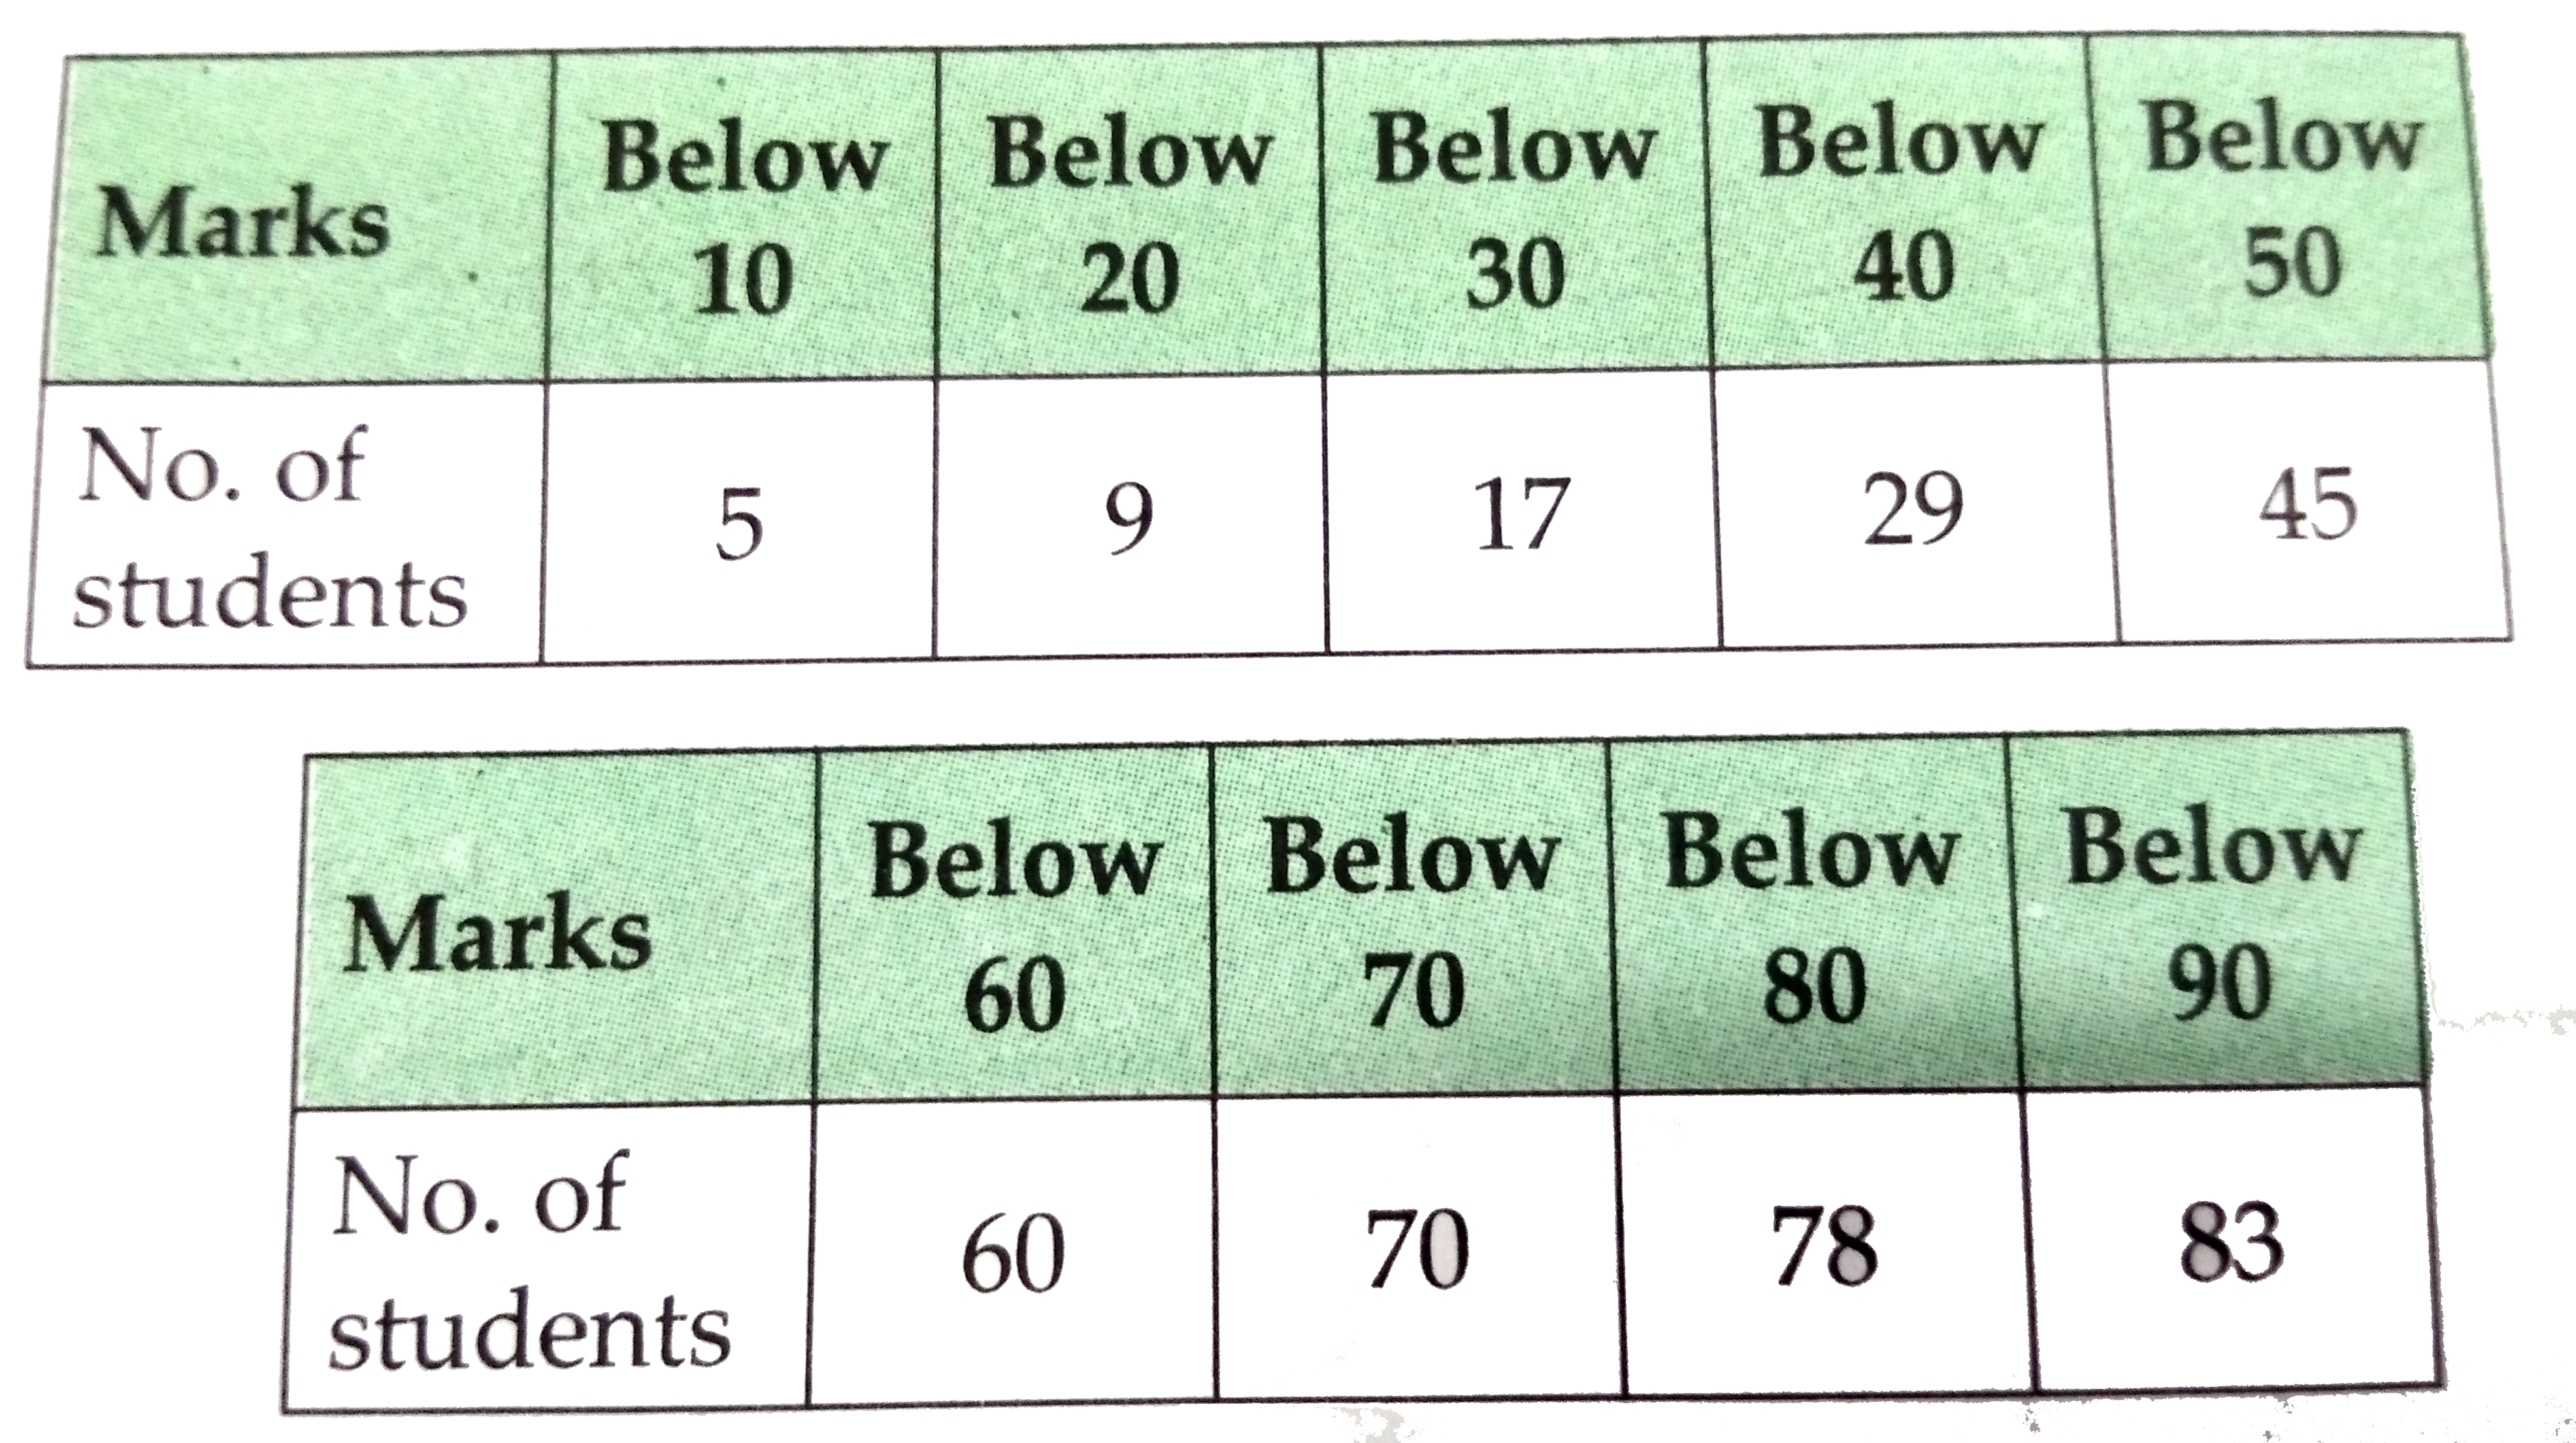
View SolutionThe following table gives the distribution of total household expenditure (in rupee) of workers in a city.
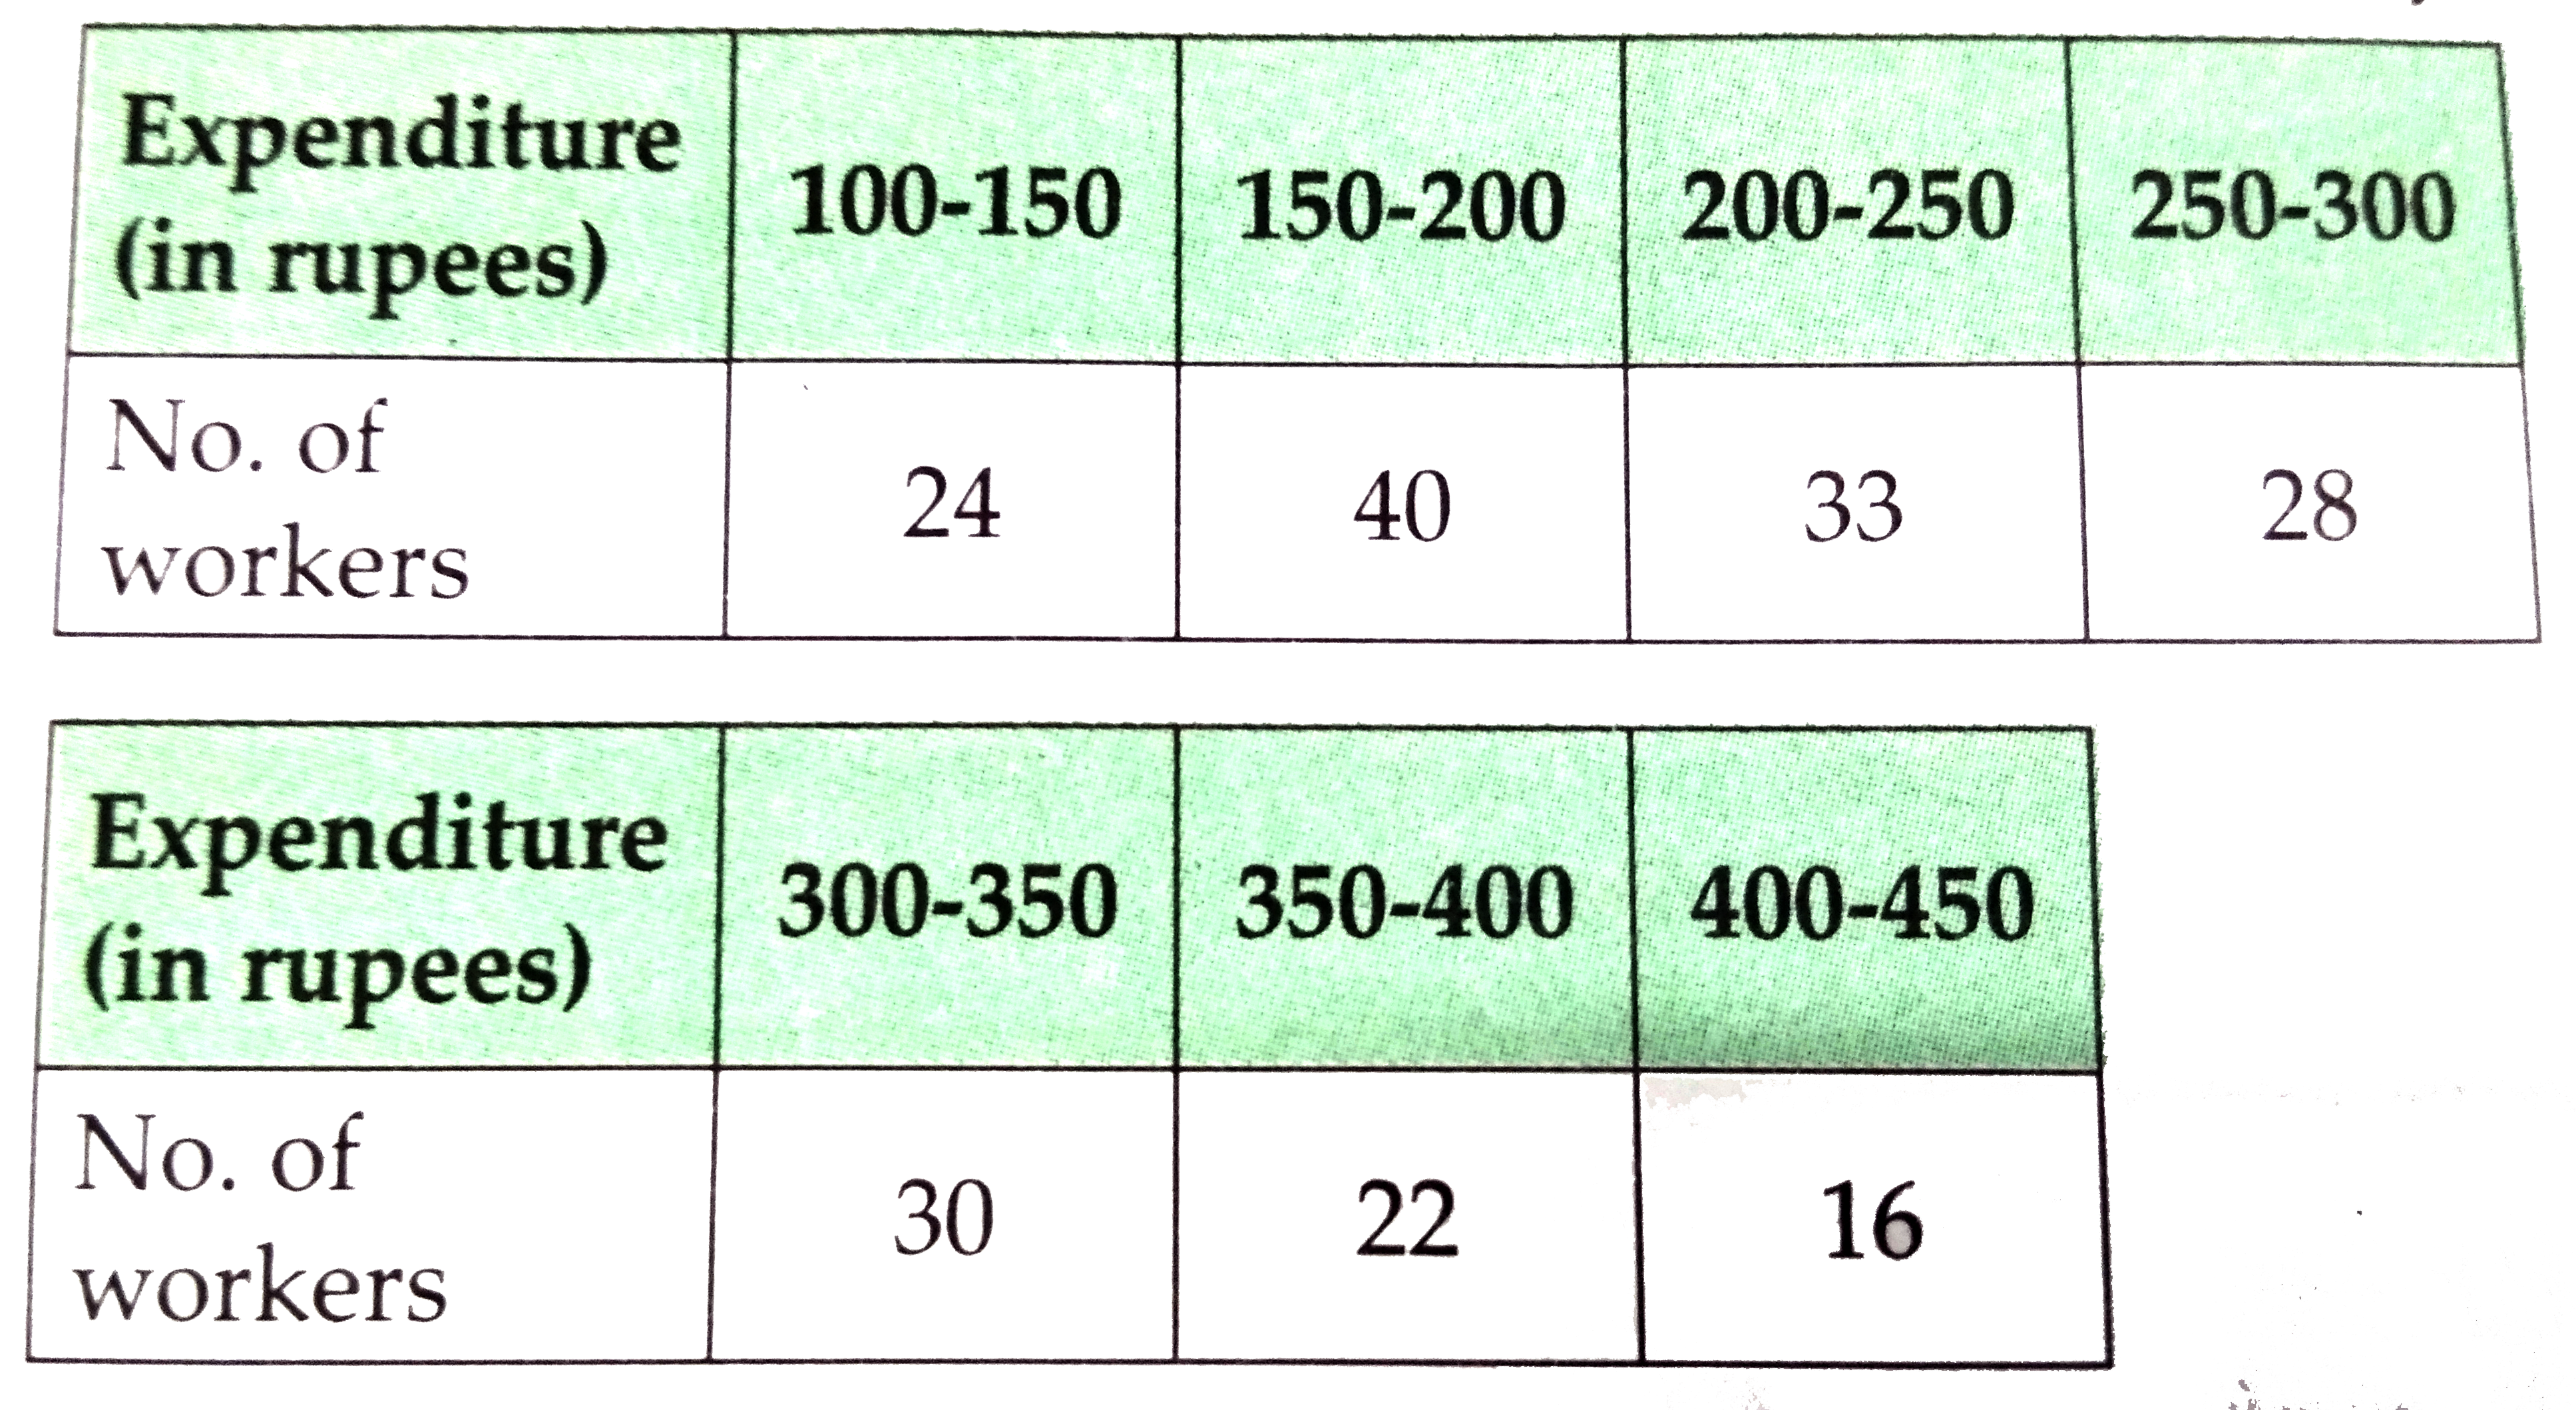
Find the mean expenses per household by step deviation method .
View SolutionRainfall (in mm) recorded in 50 cities in a partial region on a particular day is given below .

Find the mean rainfall on that day in a city by Assumed Mean method .
View SolutionThe mean of the following frequency distribution is 62.8 and the sum of all frequency is 50 . Complete the missing frequency `f_1 and f_2` .

View SolutionThe following table shows the ages of 300 patients getting medical treatment in a hospital on a particular day.

Find the medina age of patients .
View SolutionBelow is given the frequency distribution of no. of packages received at a post office per day.

Find the median no. of packages received by the post -office per day.
View SolutionFollowing table shows frequency distribution of no. of rooms occupied in a hotal per day .

Find the median no. of rooms occupied in a hotal per day .
View SolutionTime spent in queue by 100 passenger is classified and given below .

Find the median no. of passengers .
View SolutionFollowing is the cumulative frequency distribution of empolyees in a certain office according to age.
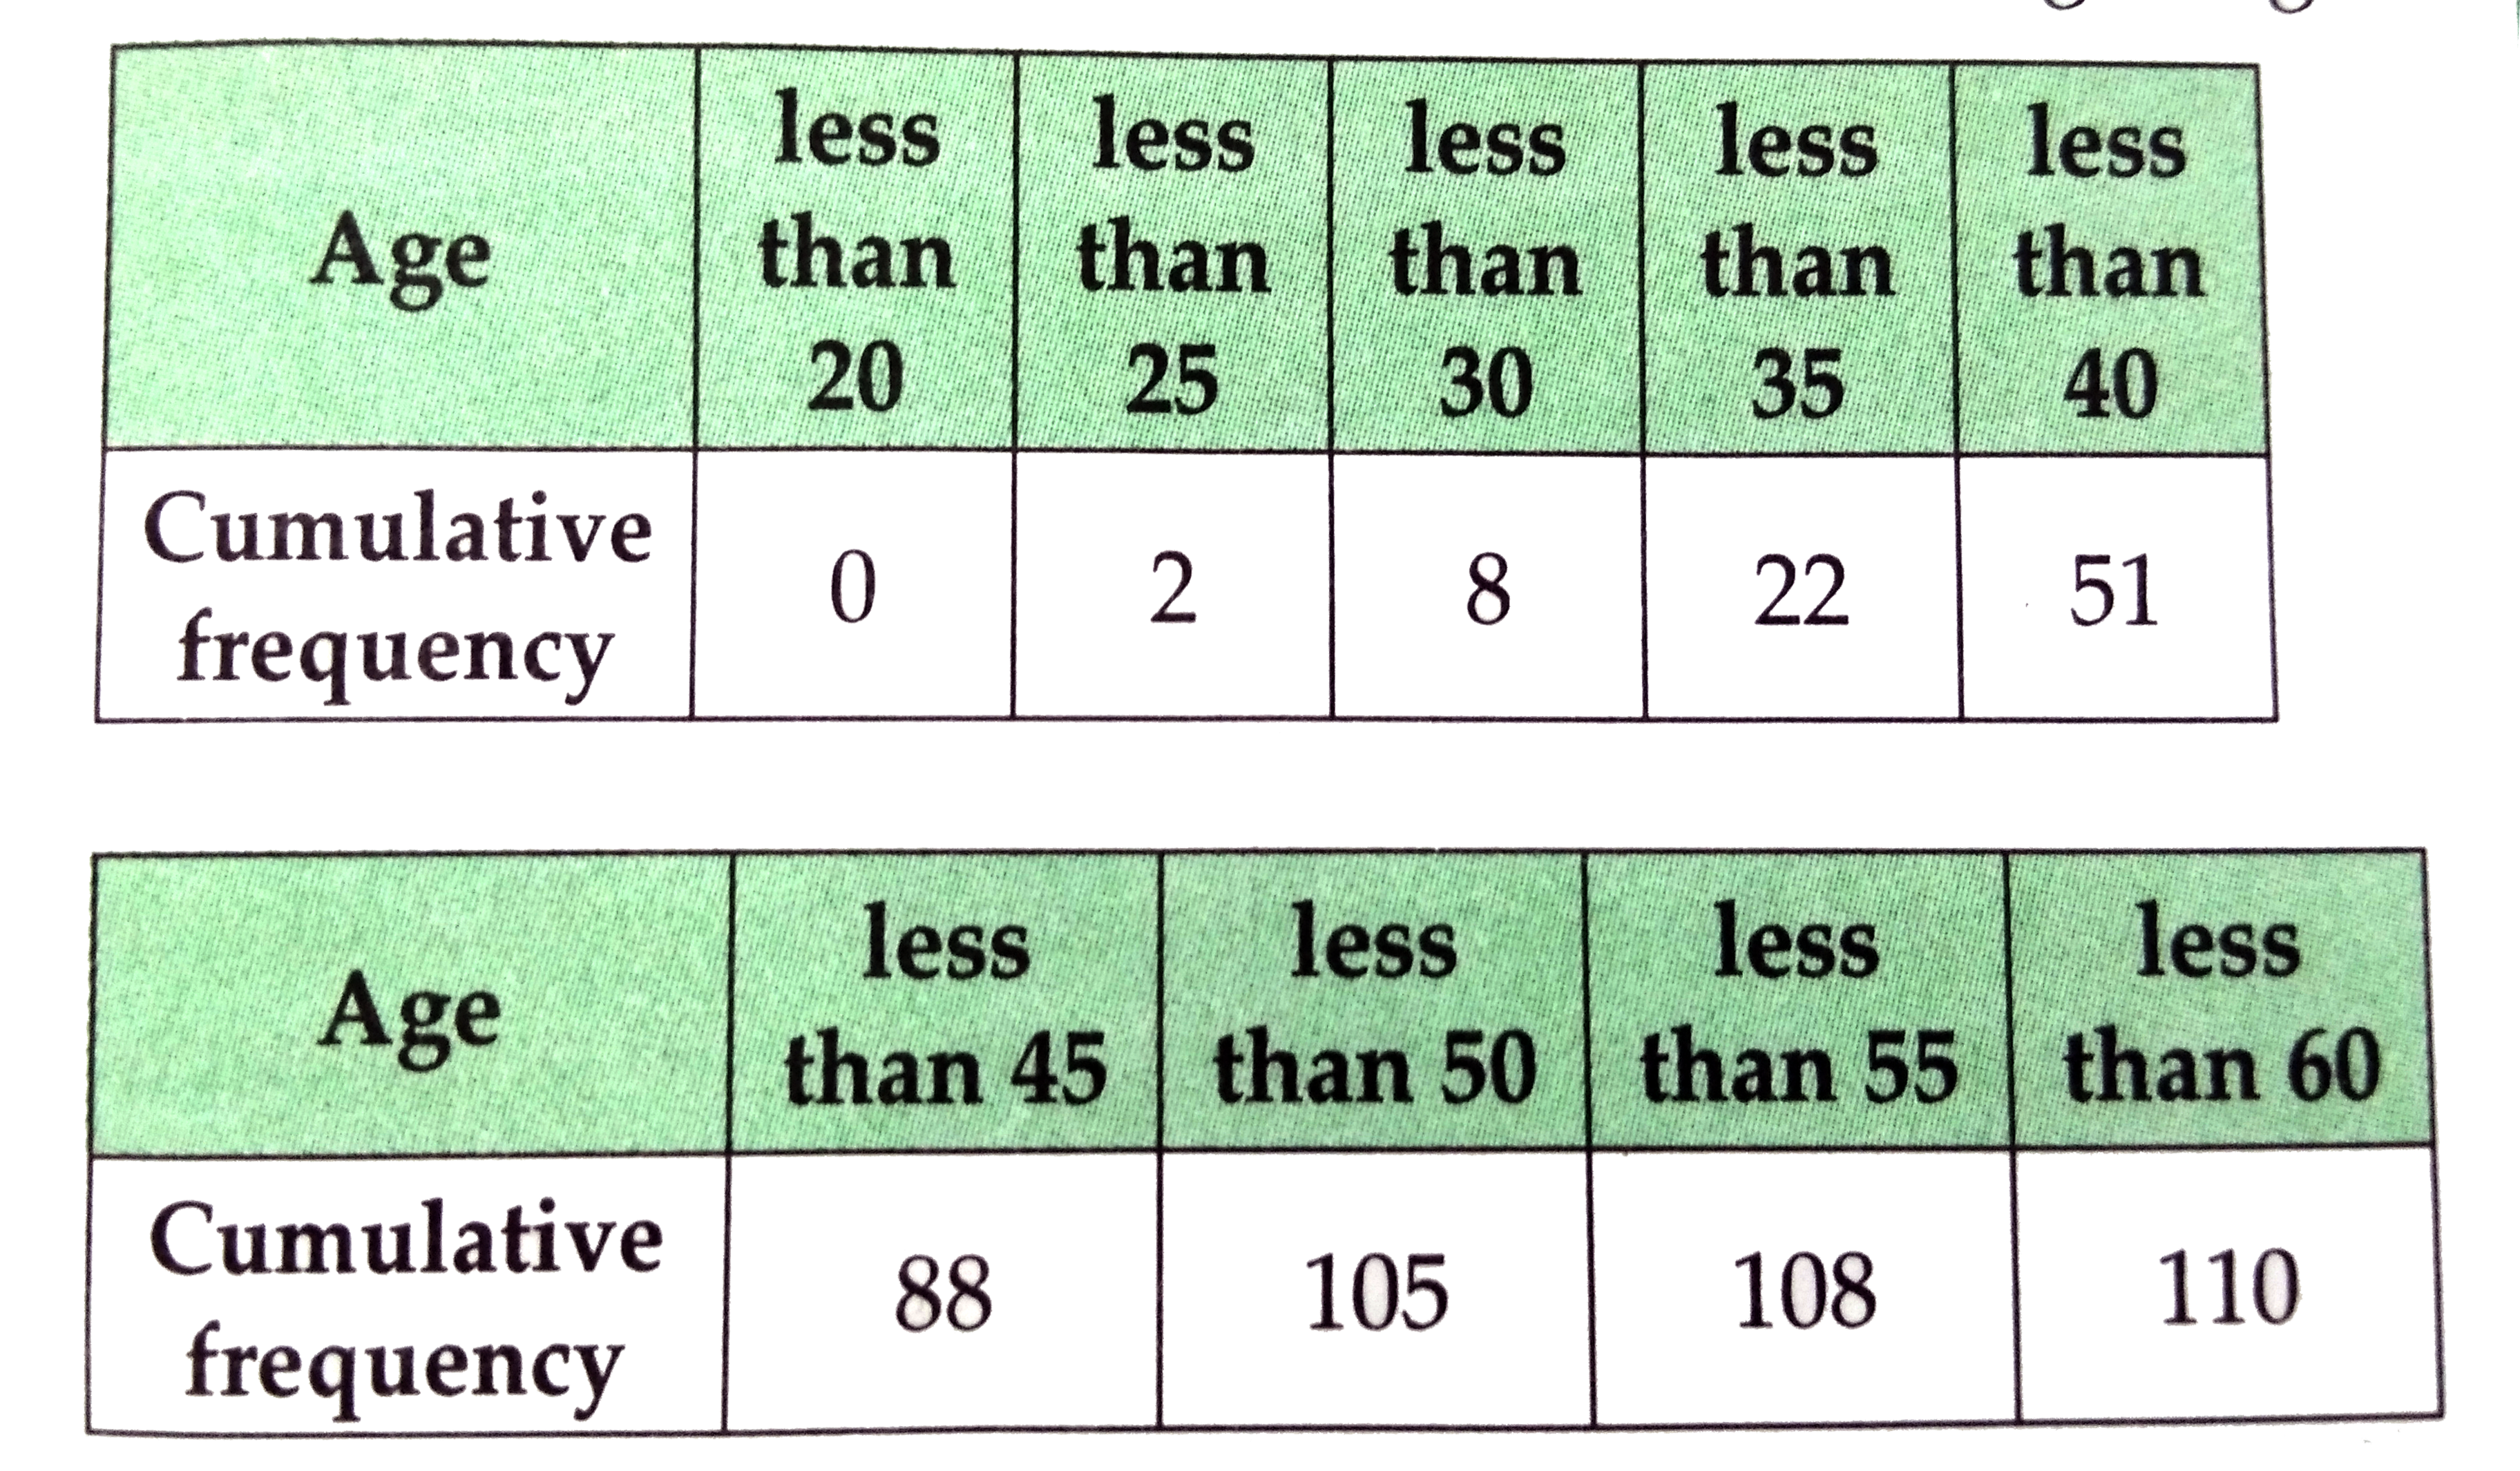
Find the median age of empolyee.
View SolutionAutomatic filling machine was liseted for its performance. A sample 100 filled packets generalised the data, which is classified as follows.

Find the modal weight of the packets .
View SolutionThe following table gives profit earned by companeies in lacs .

Find the modal profit earned by the companies .
View SolutionThe following table shows the heights of students .

Find the modal height of the students .
View SolutionBelow is given the frequency distribution of Daily wages (in rs ) of 130 workers .

Find the modal wages of a worker .
View SolutionThe following is the frequency distribution of blood pressure measured for 100 patients .

Find the modal blood pressure of the patient .
View SolutionDraw the frequency polygon for the following data.

View SolutionBelow is given frequency distribution of marks (out of 100 ) obtained by students .


Draw the histogram and frequency polygon on the same graph papers.
View SolutionDraw the frequency polygond using mid-ponts for the following data on time required to do a certain job .
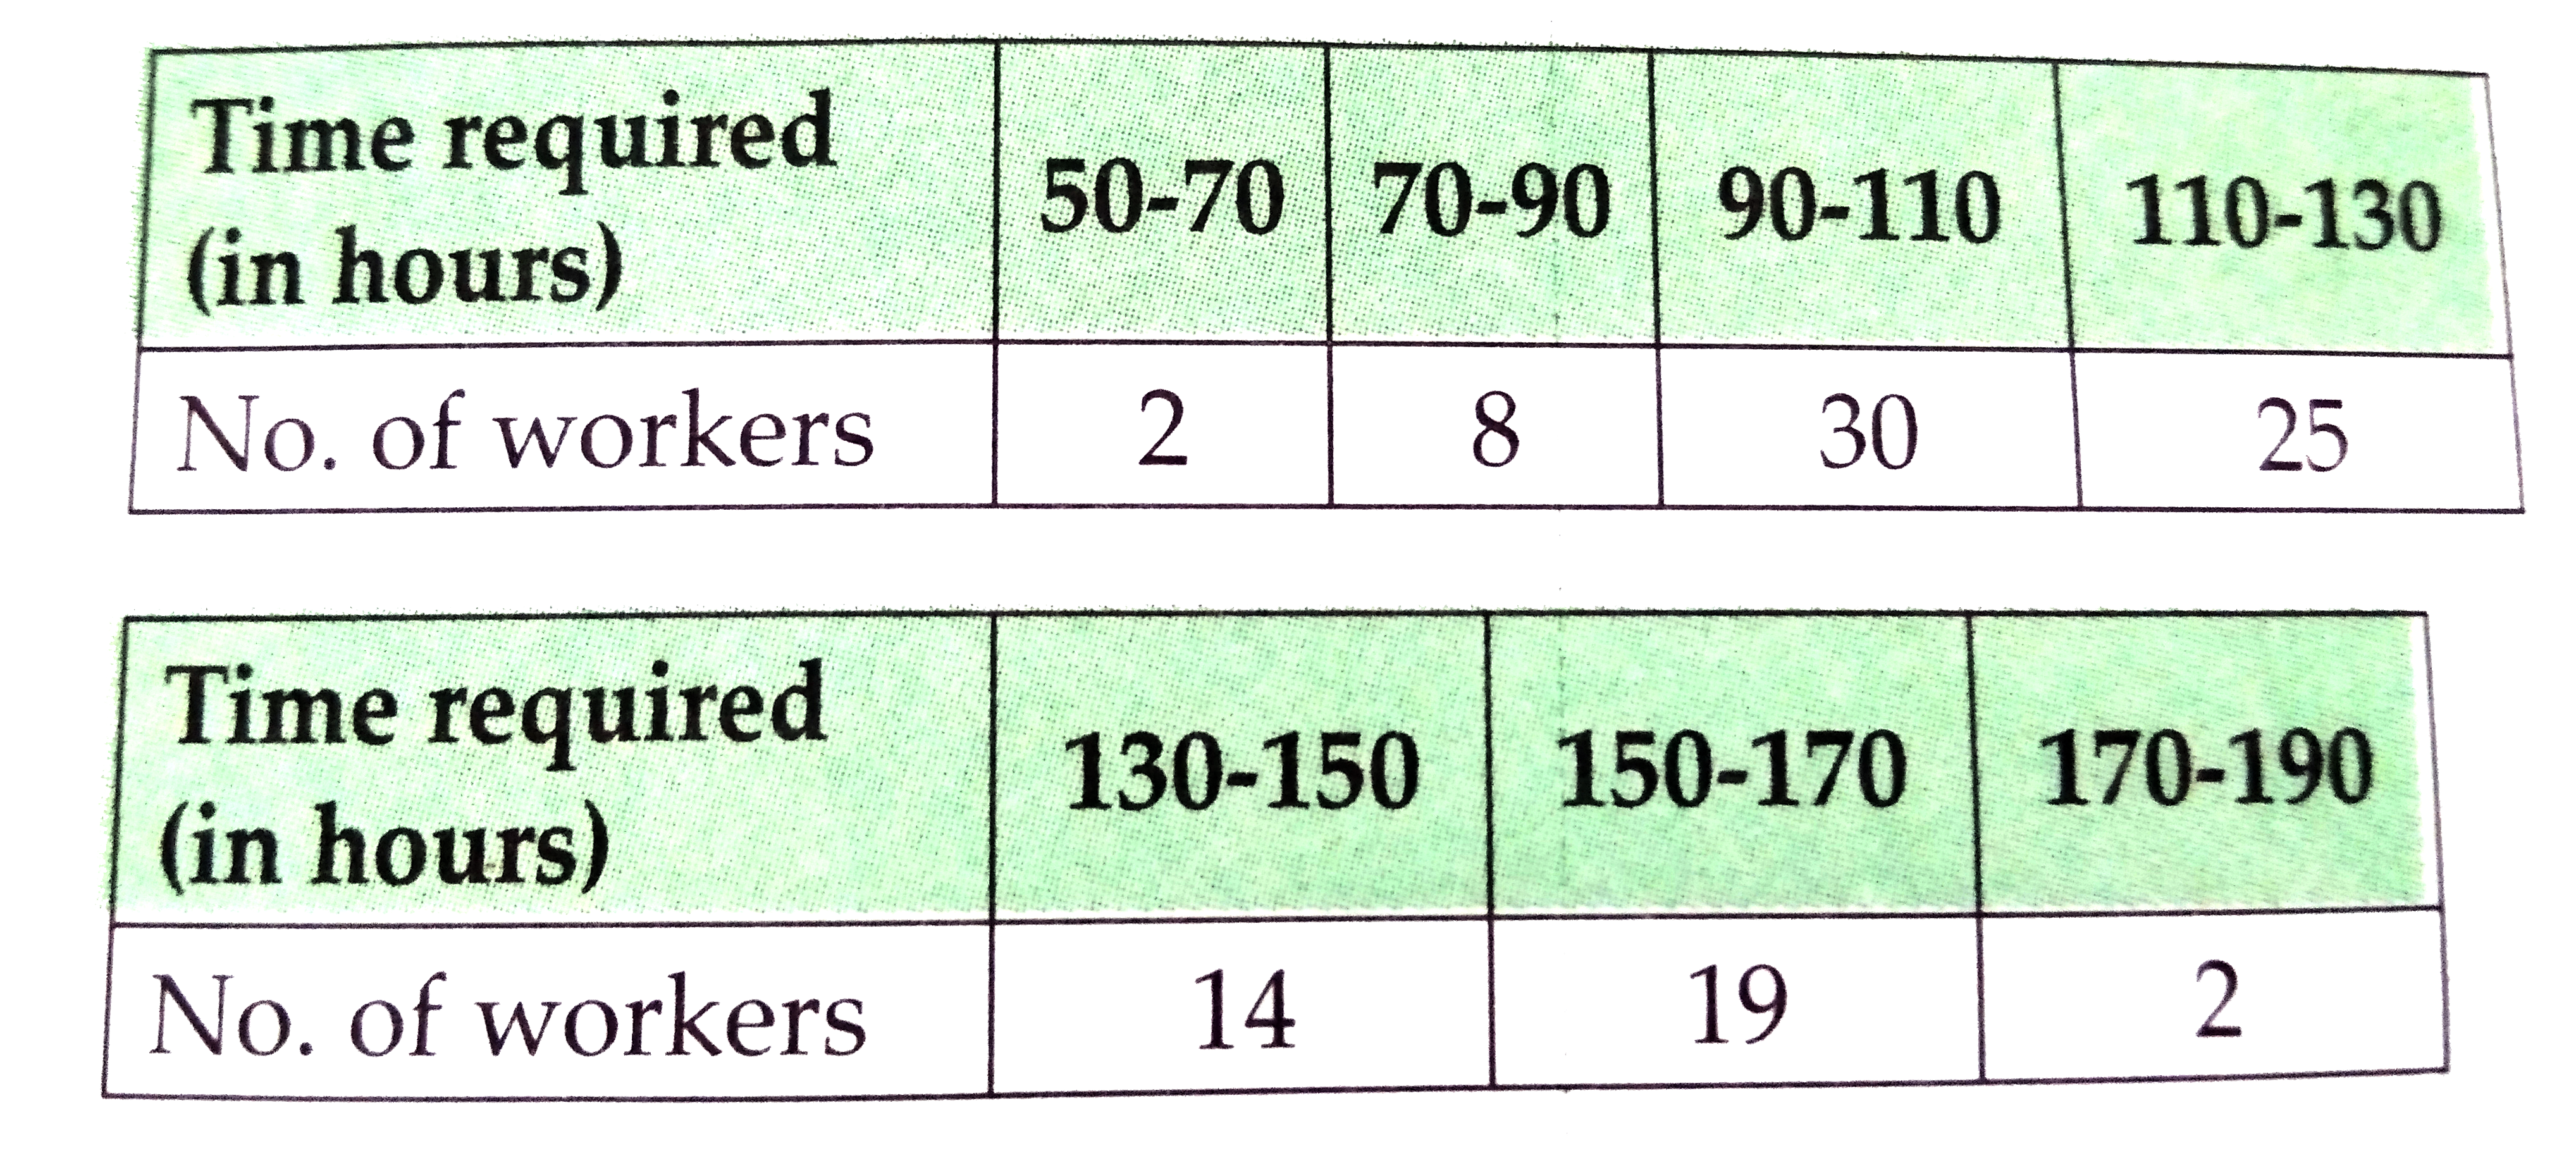
View SolutionDraw a pie diagram to represent the world population given in the following table after determining the value of a .

View SolutionThe following table shows the expenditure incurrd by a publisher in publishing a book.

Draw a pie chart representing the above data.
View SolutionFollowing is the breakup of expenditure of a family on different times of consumption.
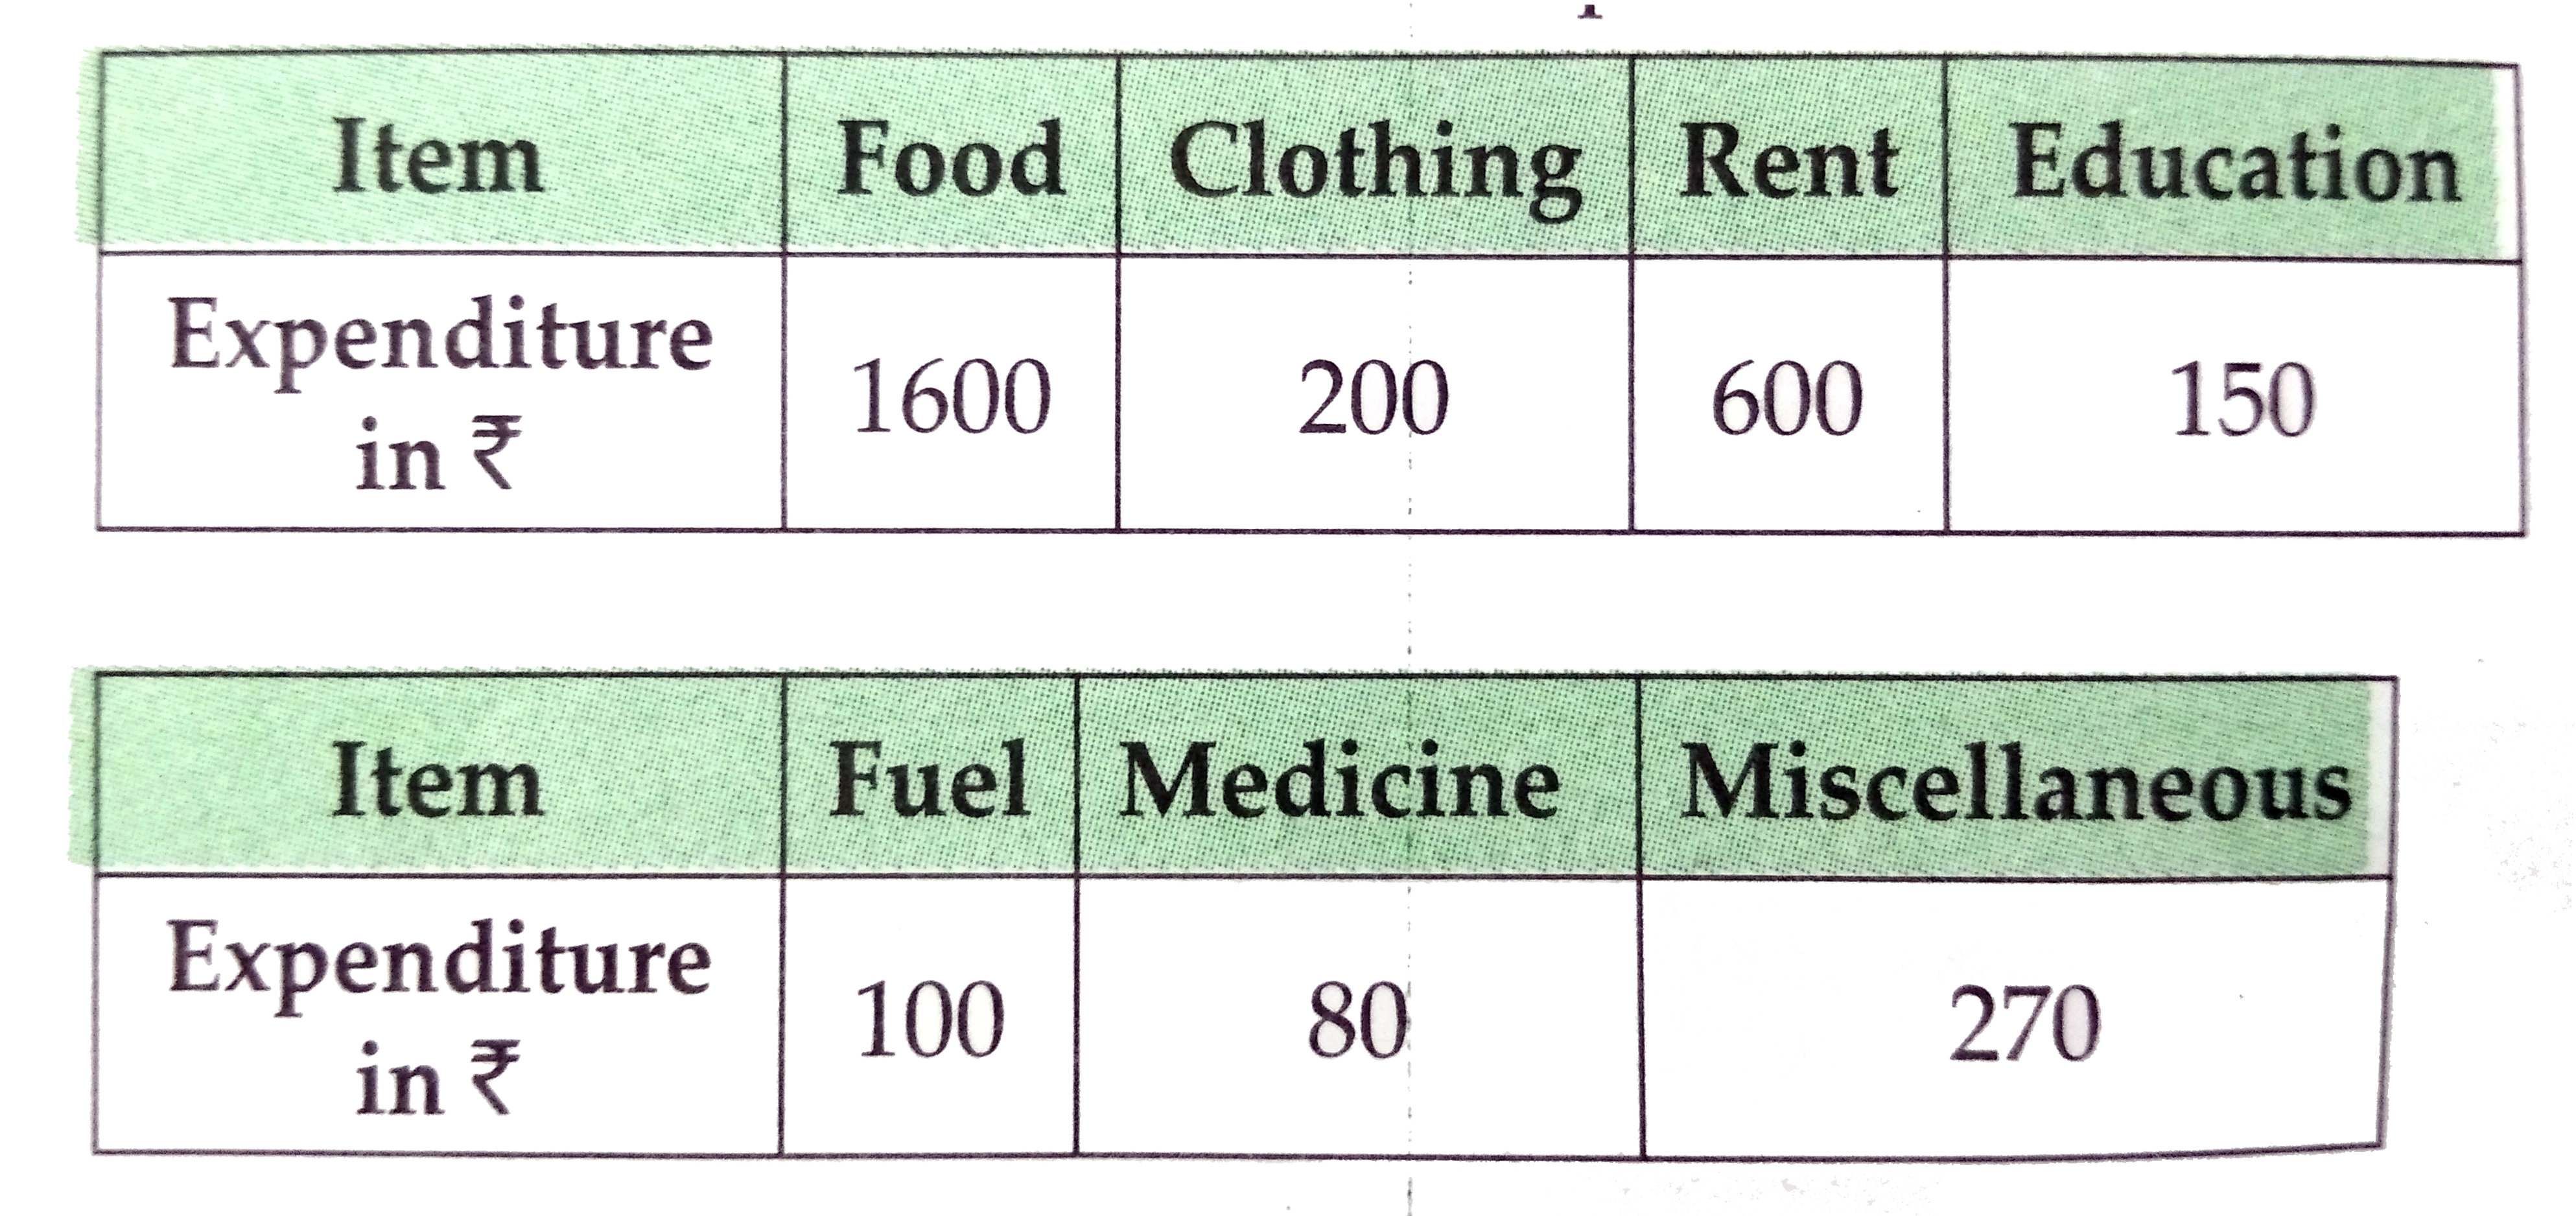
Draw a pie diagram of the above data.
View SolutionThe following pie diagram represents the number of valid votes obtained by four students who contested for school captain . The total of valid votes polled was 720 . Answer the following questions.
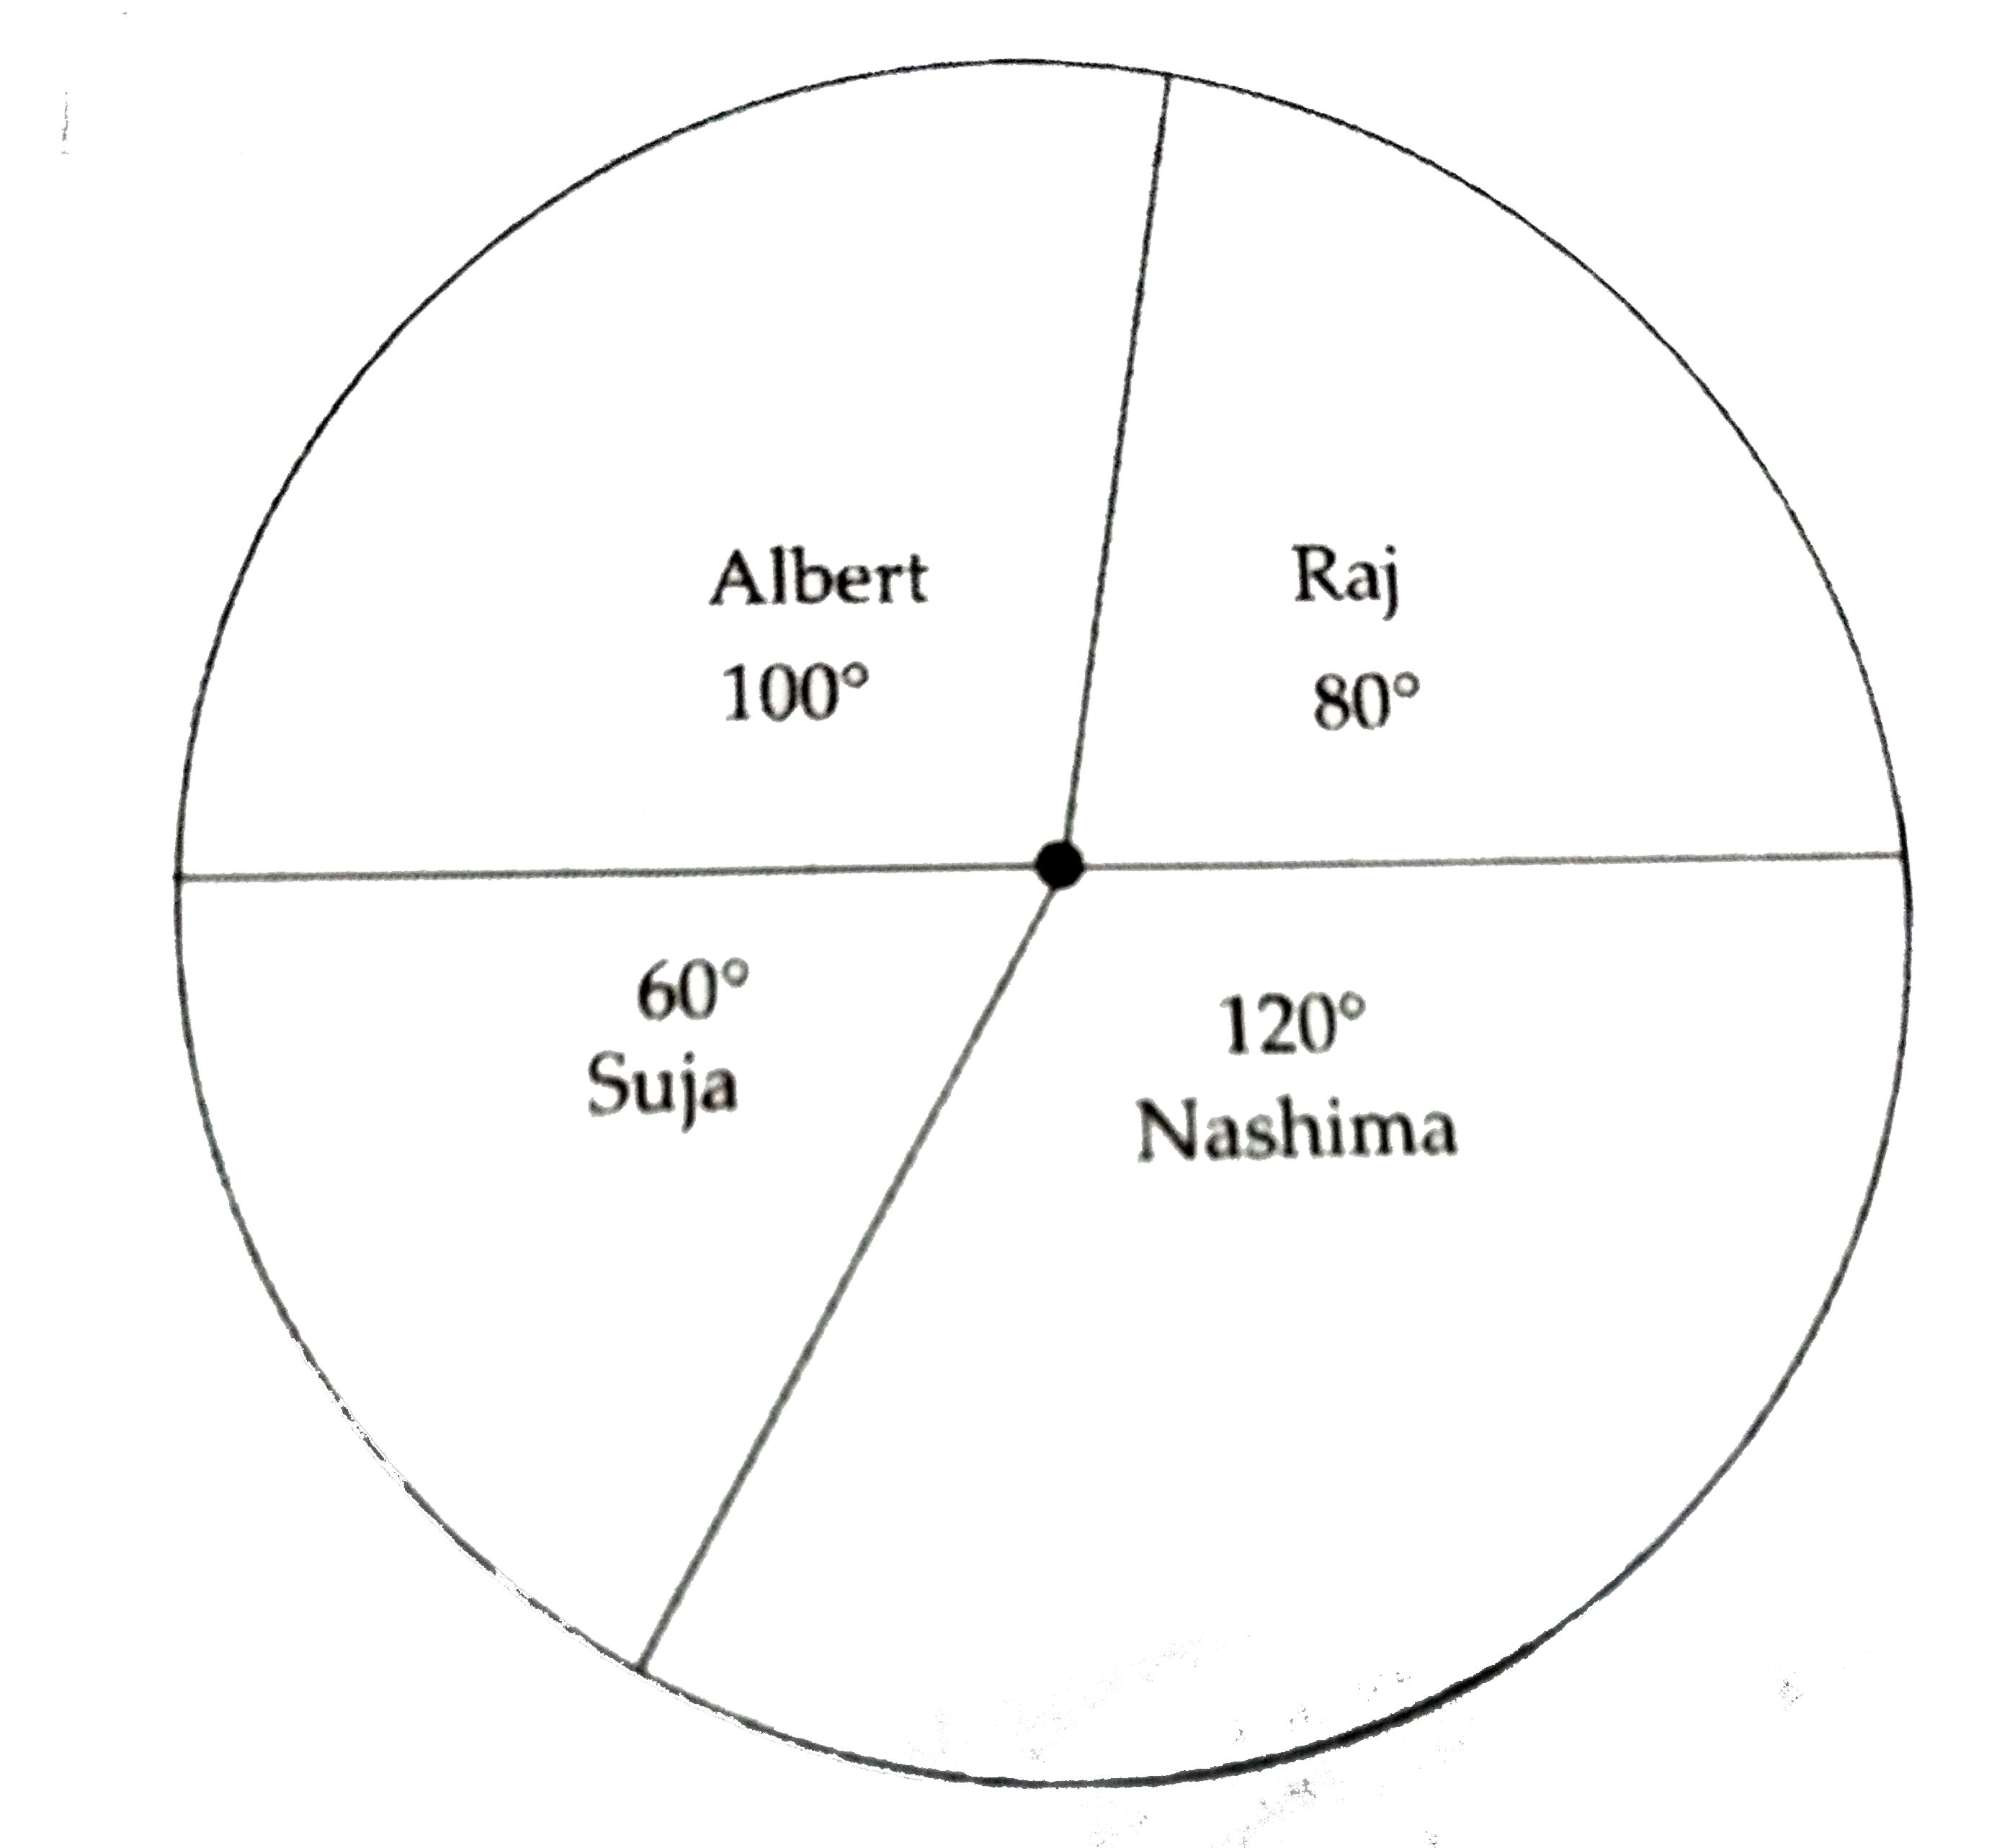
Who has won the election ?
View SolutionThe following pie diagram represents the number of valid votes obtained by four students who contested for school captain . The total of valid votes polled was 720 . Answer the following questions.
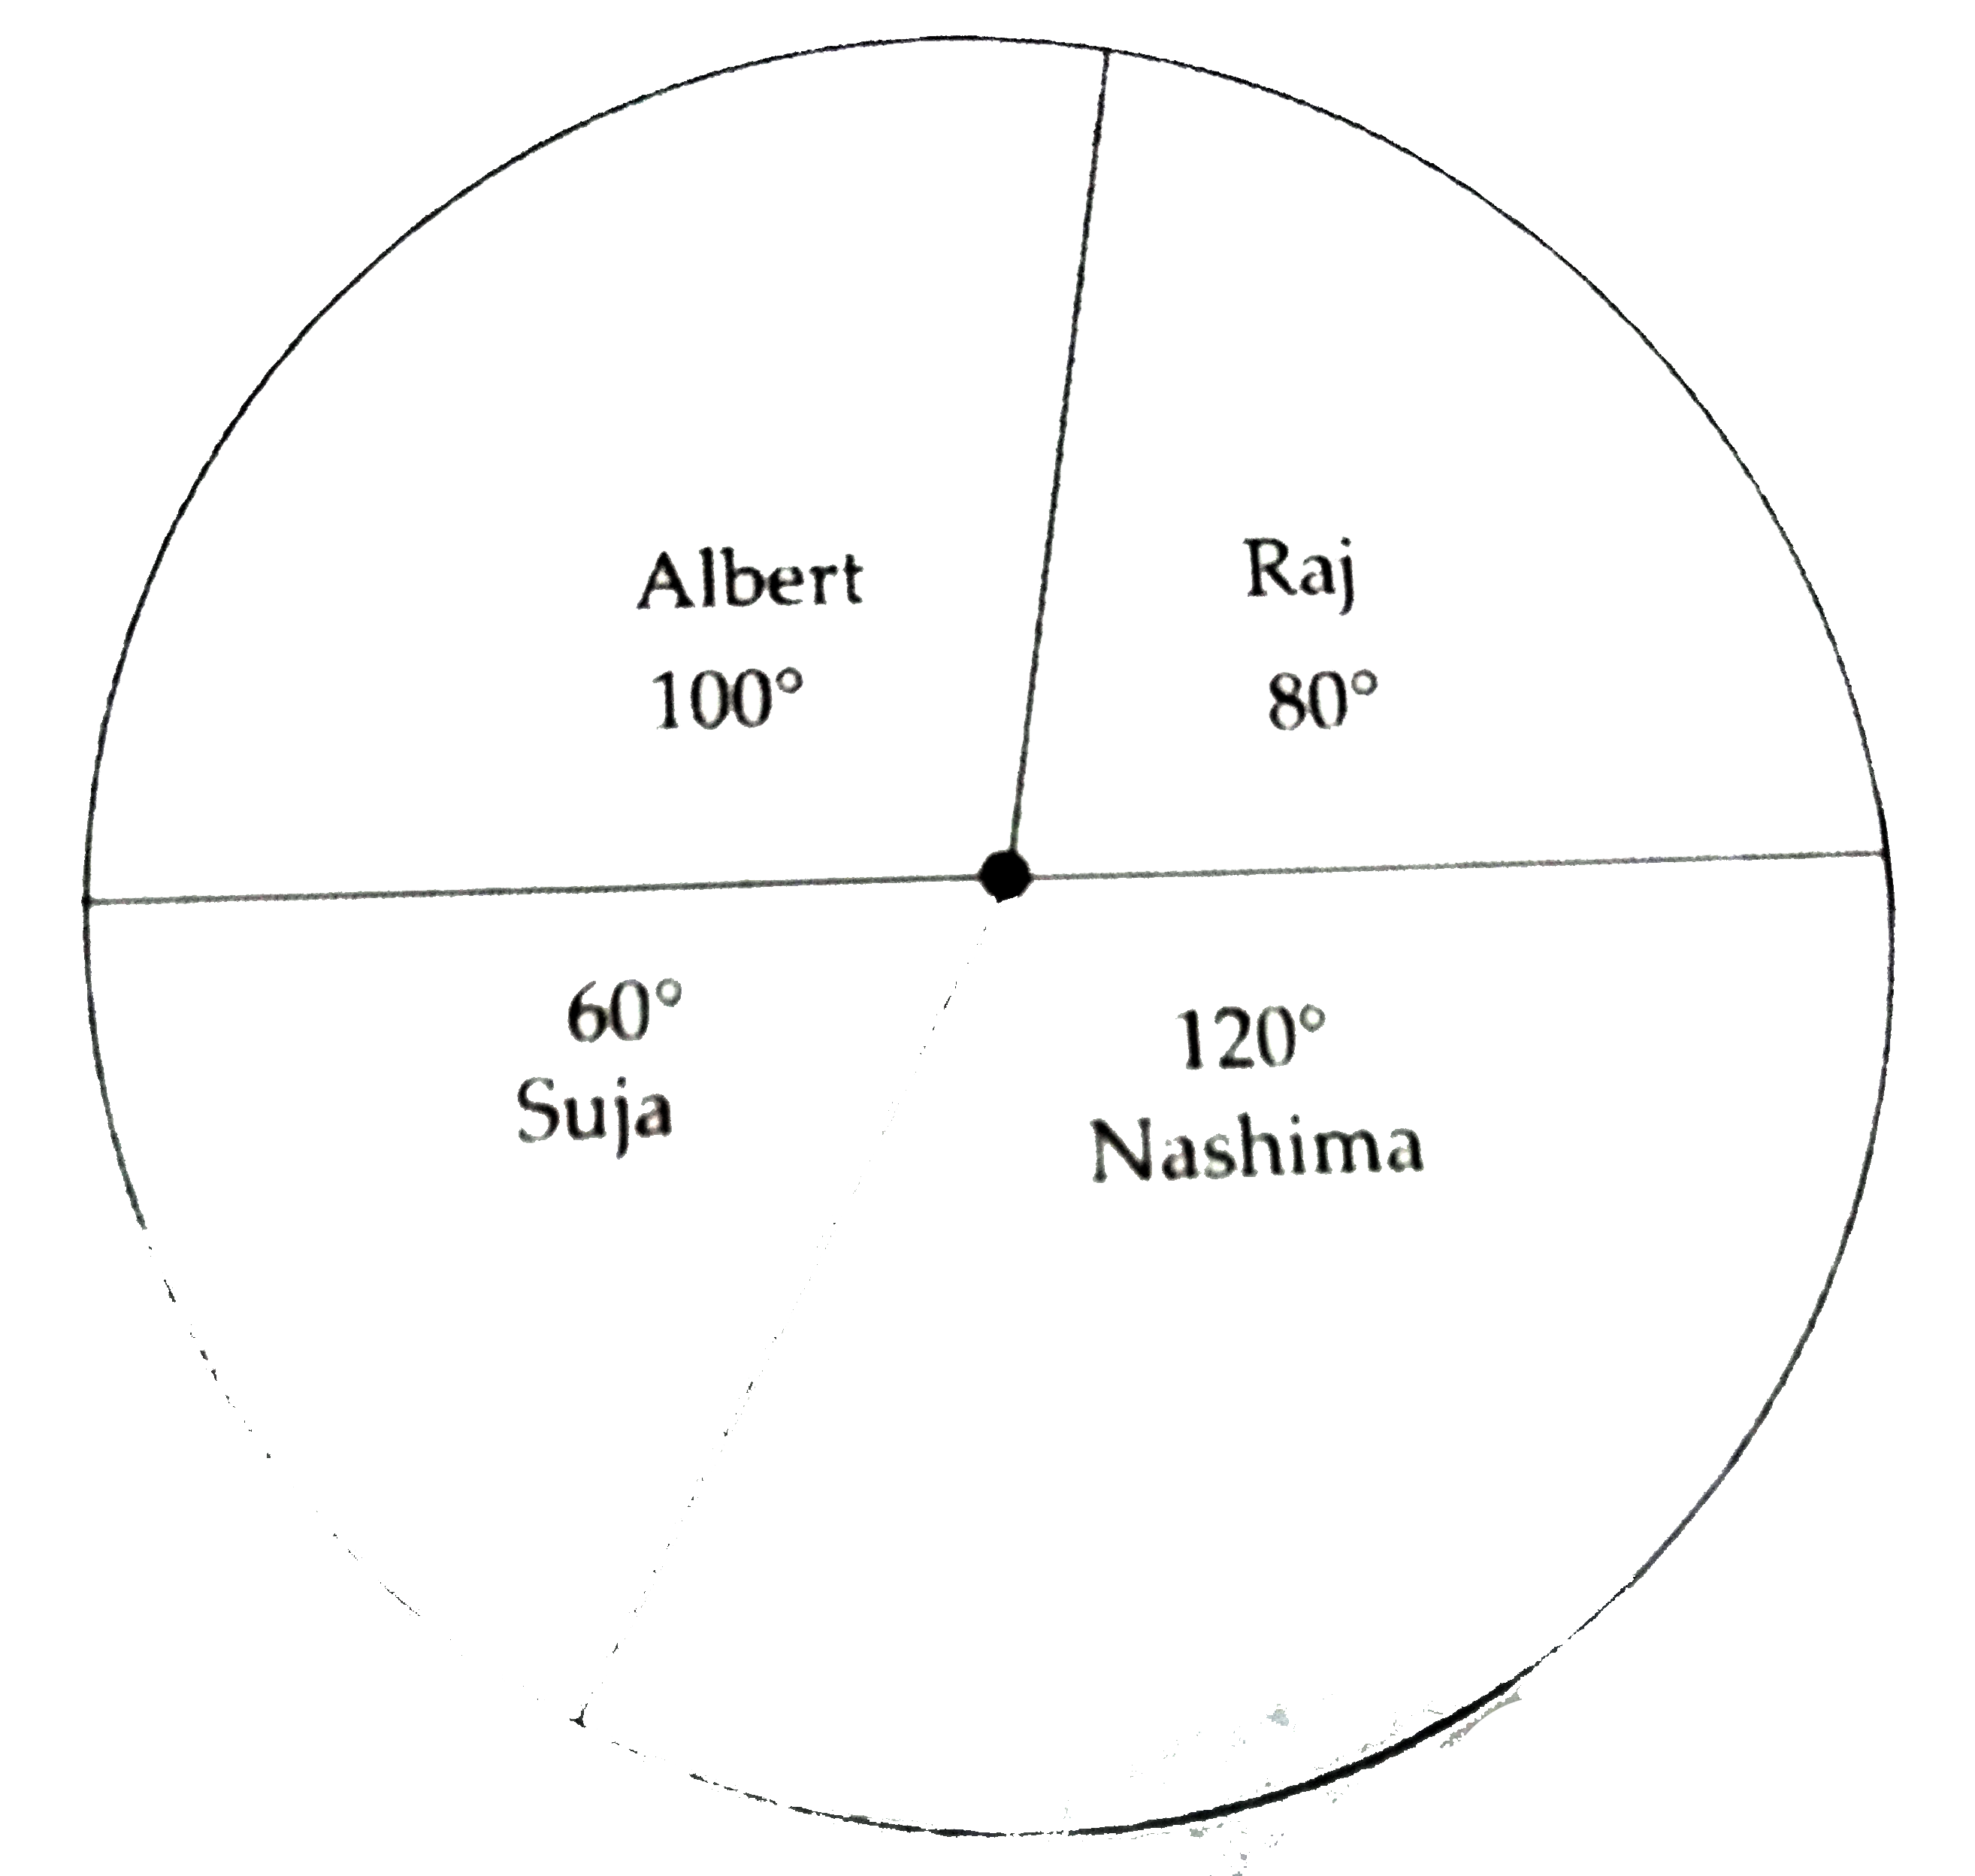
What is the minimum no. of votes ? Who got it ?
View SolutionThe following pie diagram represents the number of valid votes obtained by four students who contested for school captain . The total of valid votes polled was 720 . Answer the following questions.
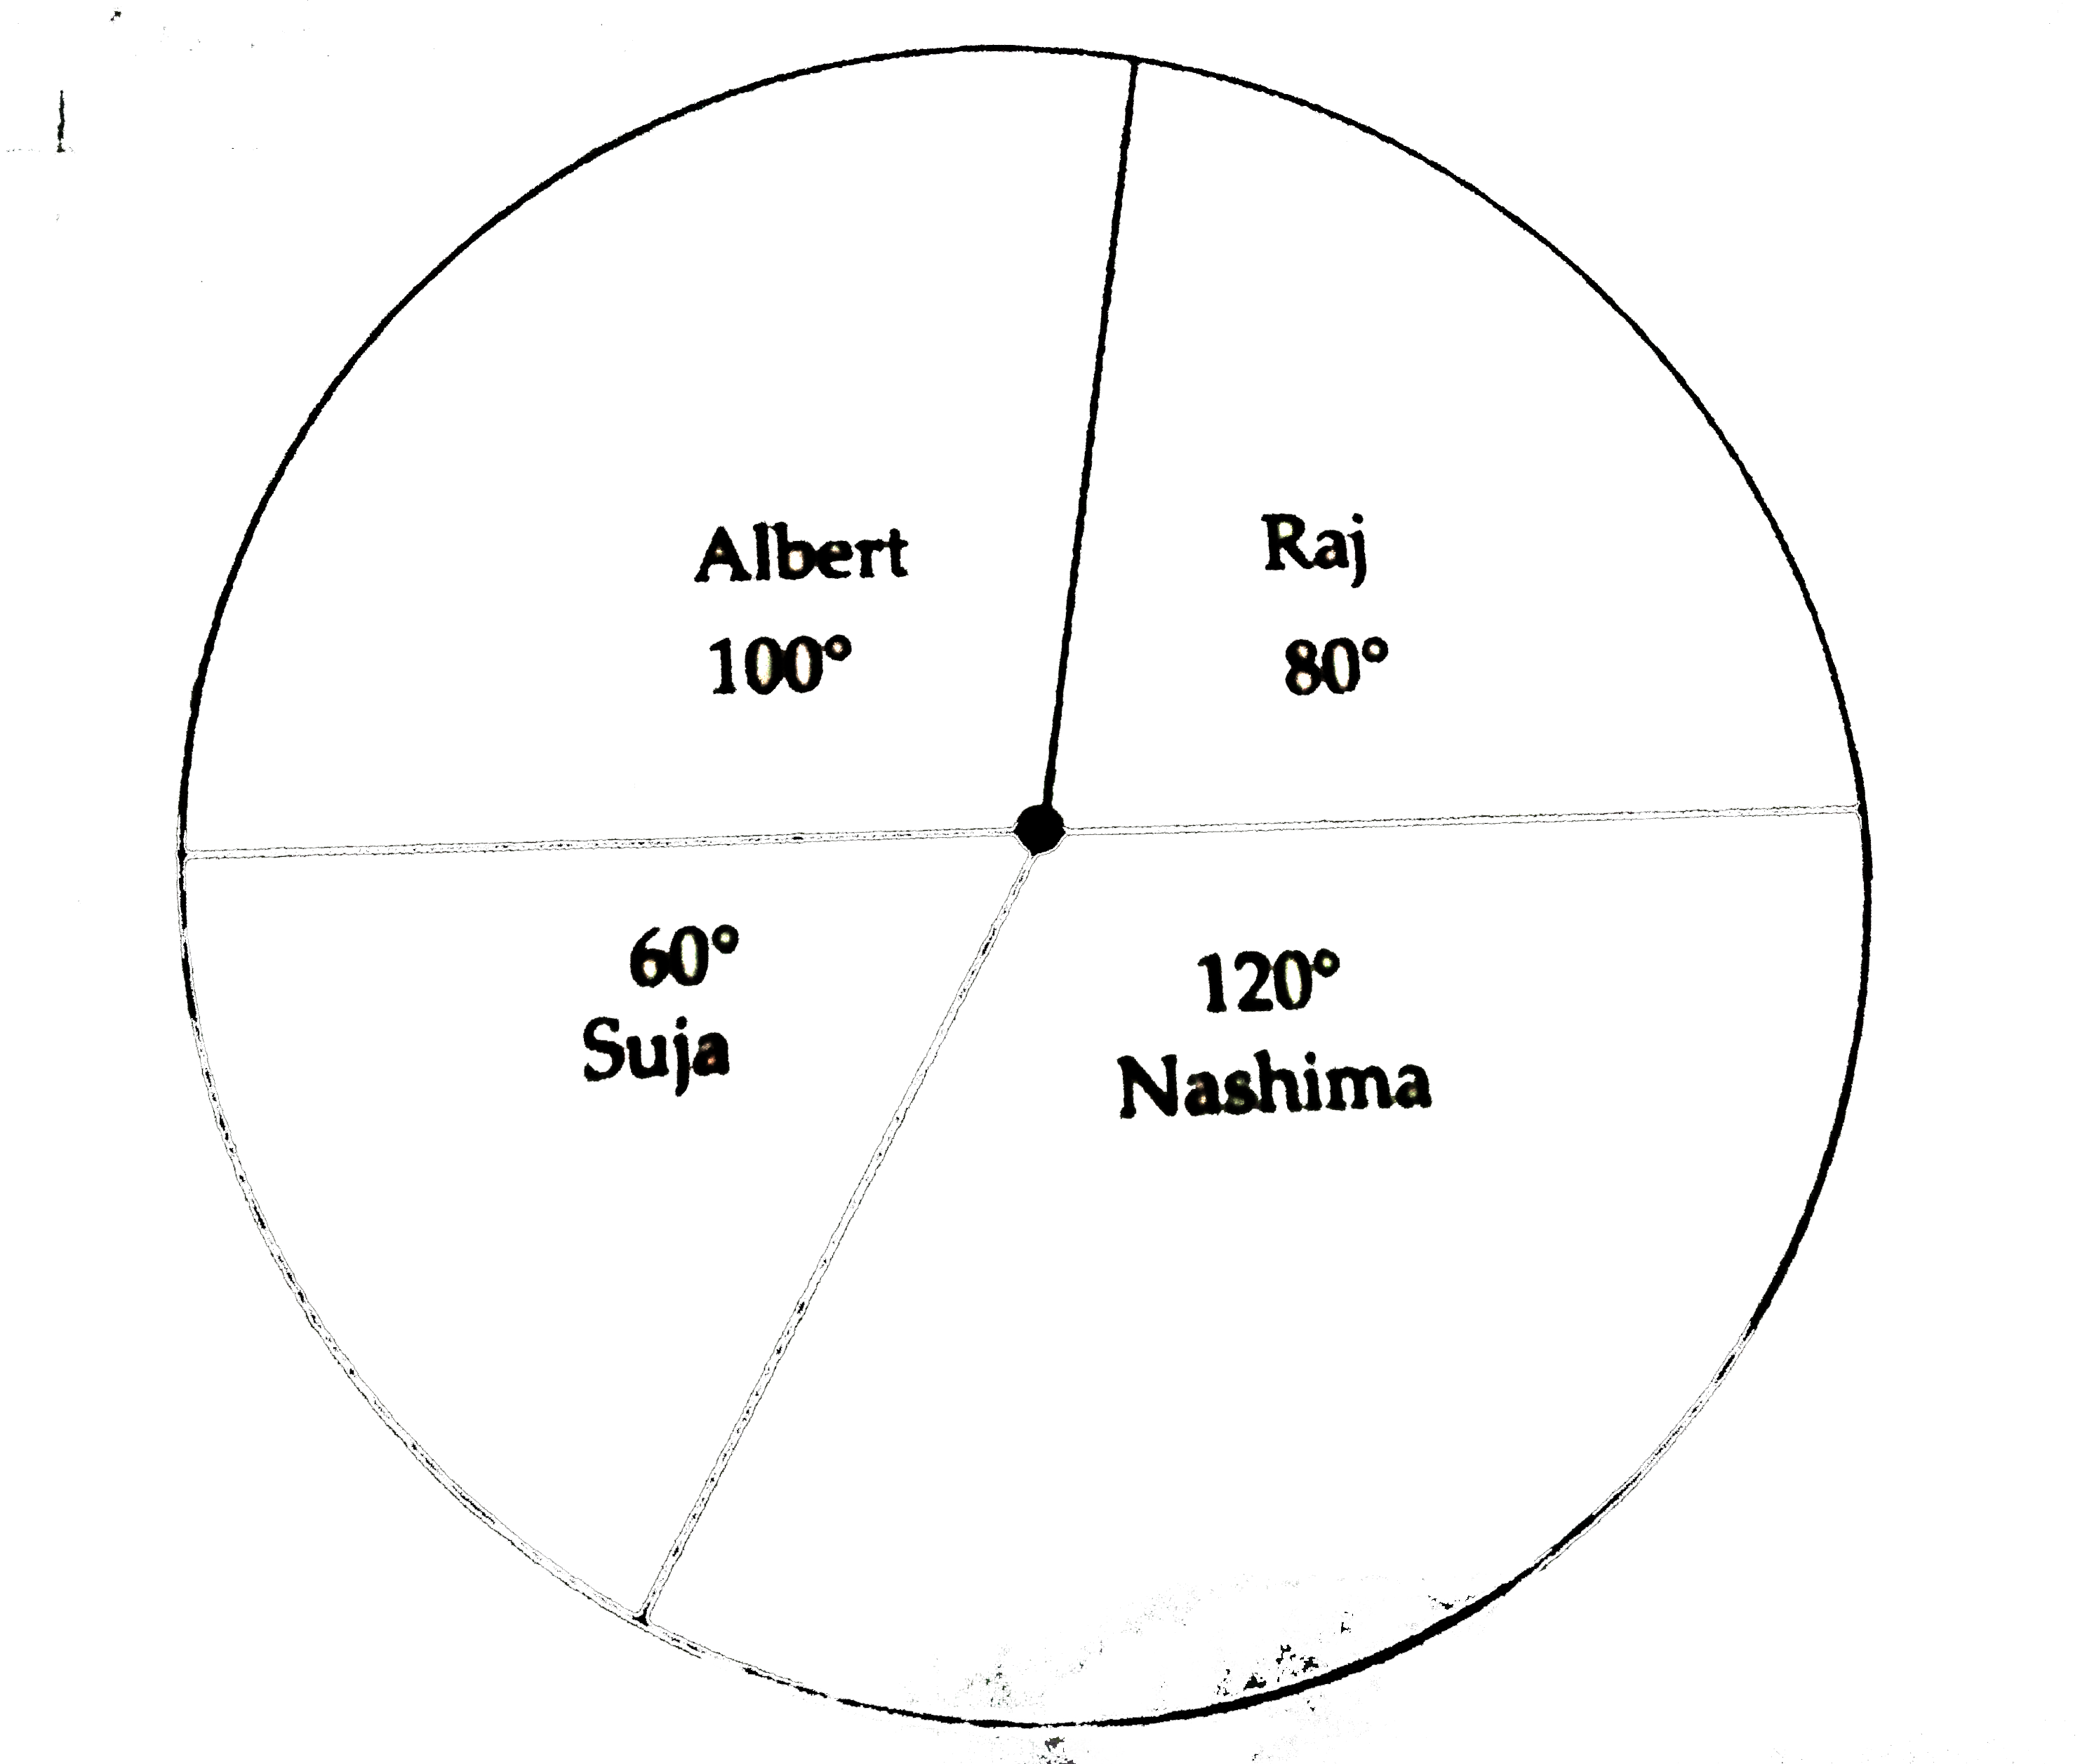
By how many votes did the winner defeat the nearest contestant ?
View SolutionThe following pie chart gives the marks scored in an examination by a student in various subjects . If the total marks obtained by the student were 360 , answer the questions.
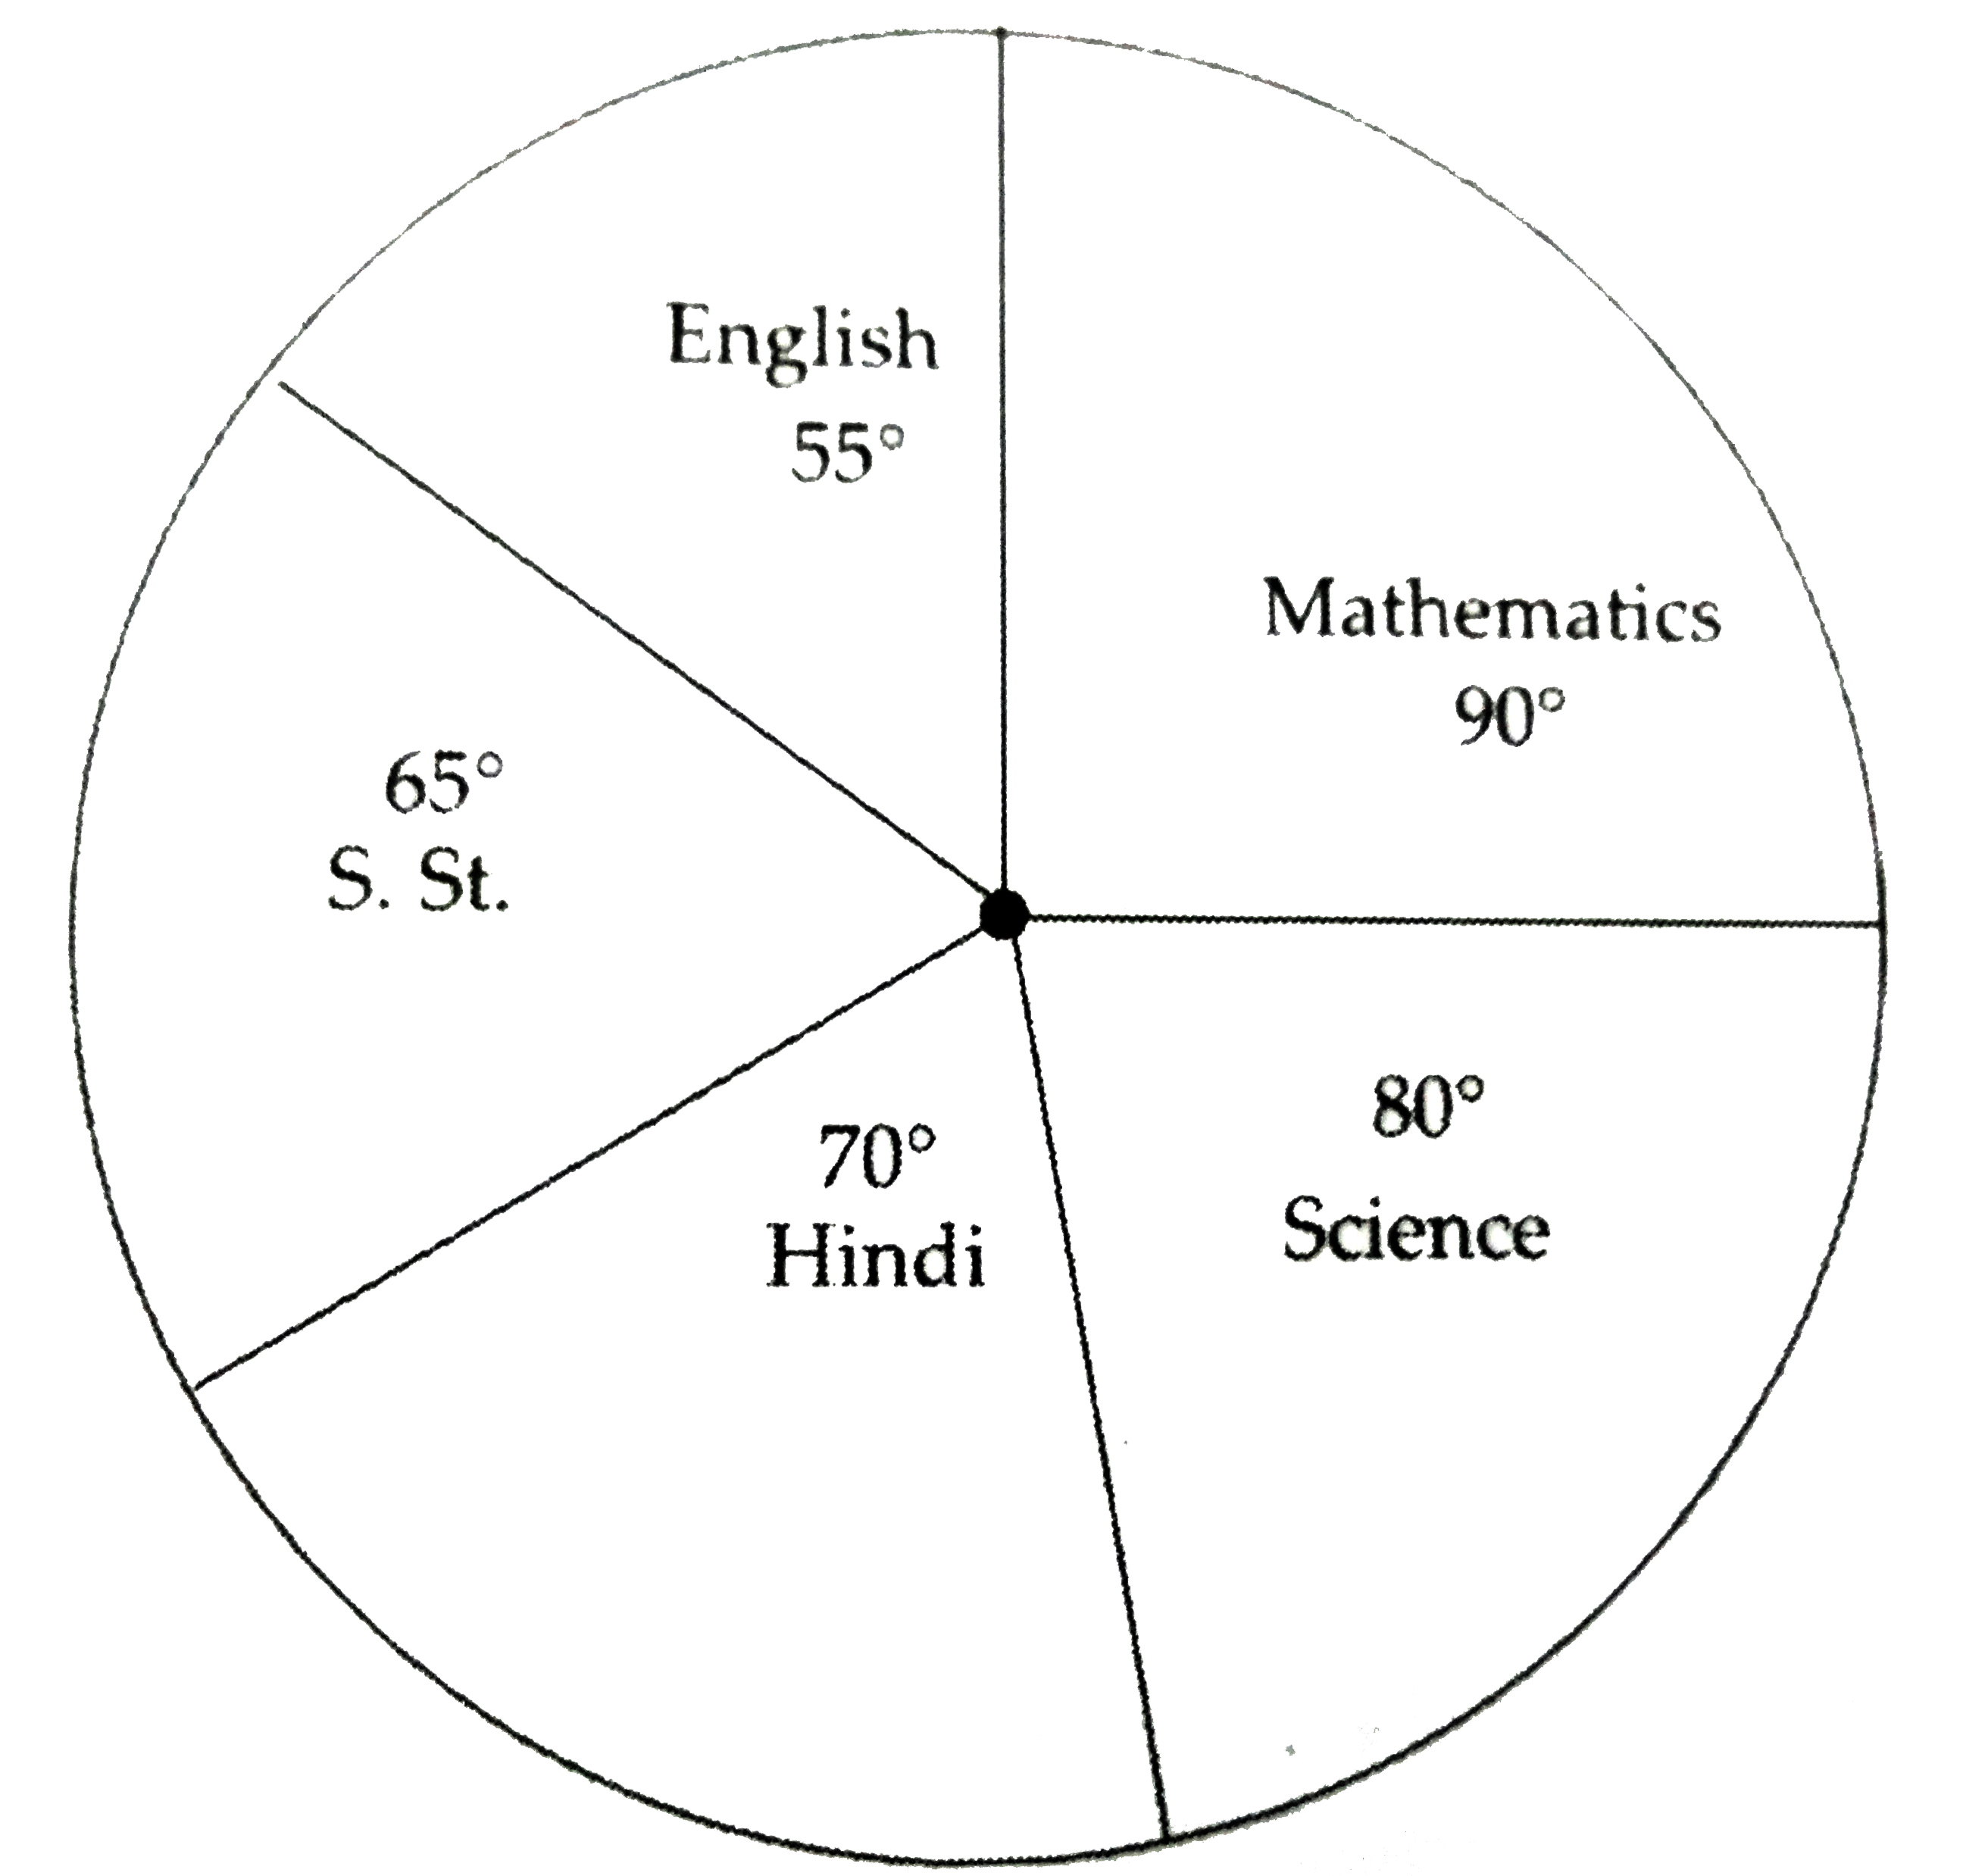
Find the marks obtained in each subject.
View SolutionThe following pie chart gives the marks scored in an examination by a student in various subjects . If the total marks obtained by the student were 360 , answer the questions.
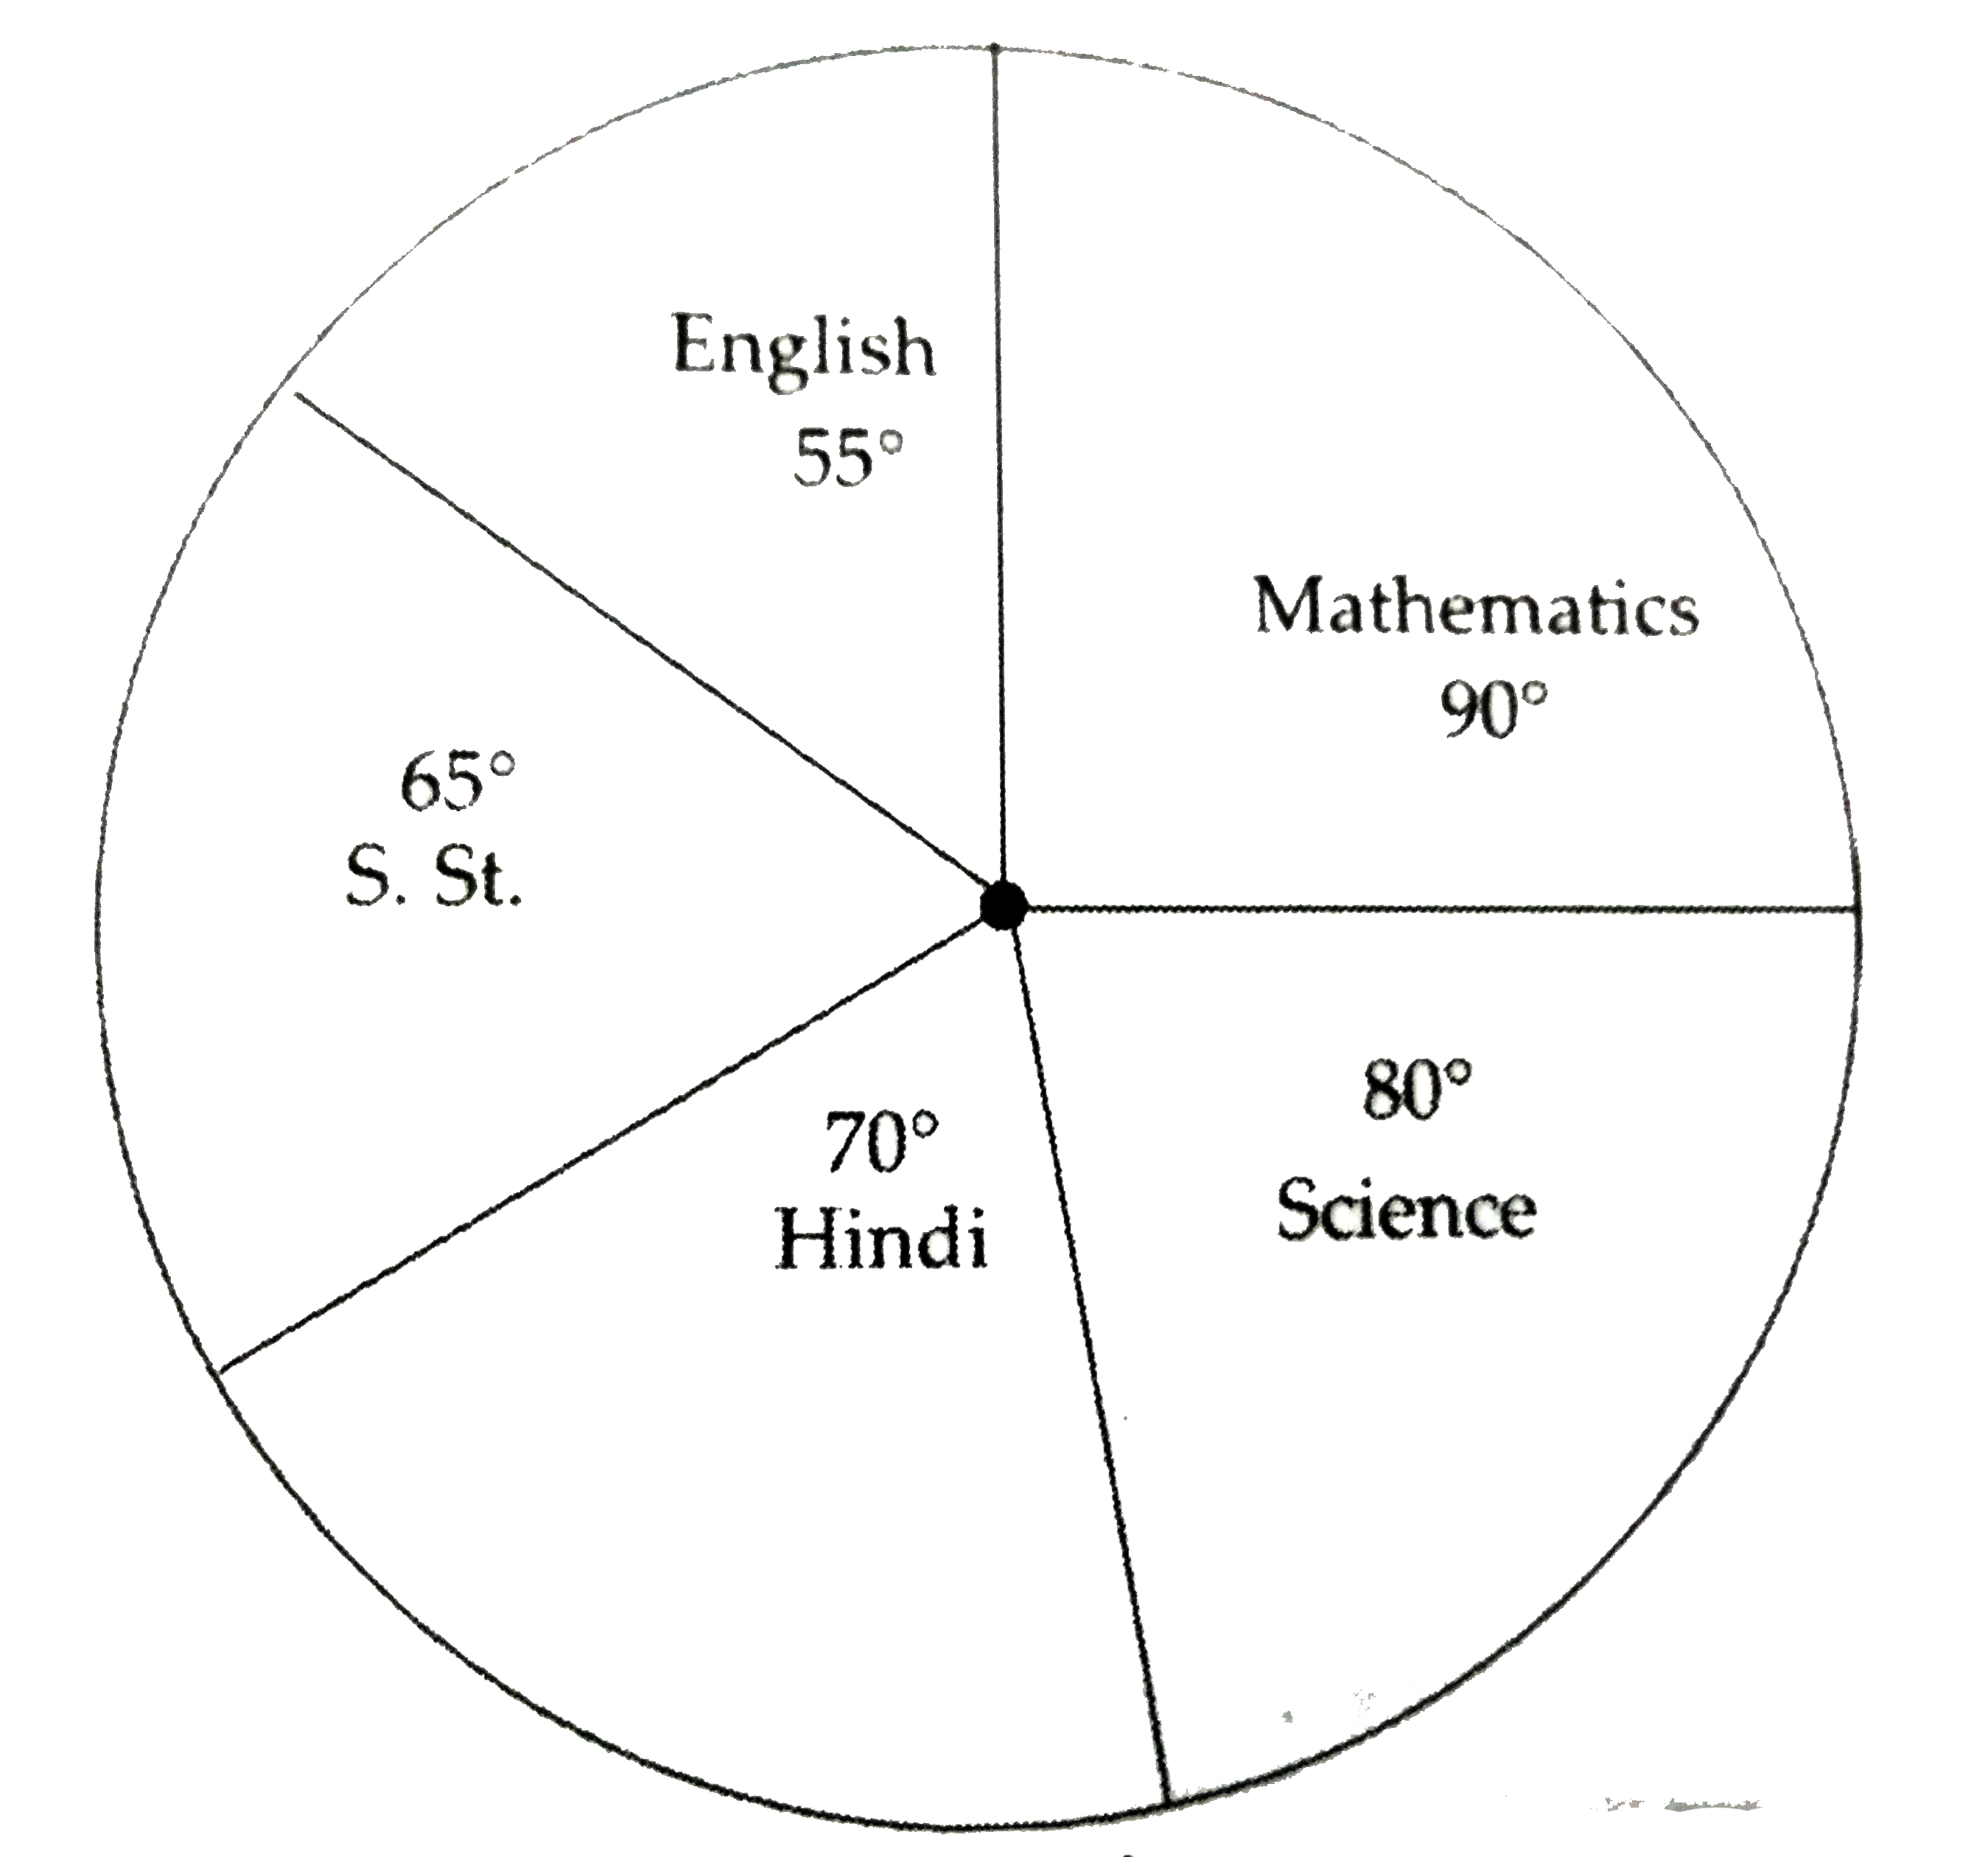
How many more marks he got in mathmatics than in science?
View SolutionThe following pie chart gives the marks scored in an examination by a student in various subjects . If the total marks obtained by the student were 360 , answer the questions.
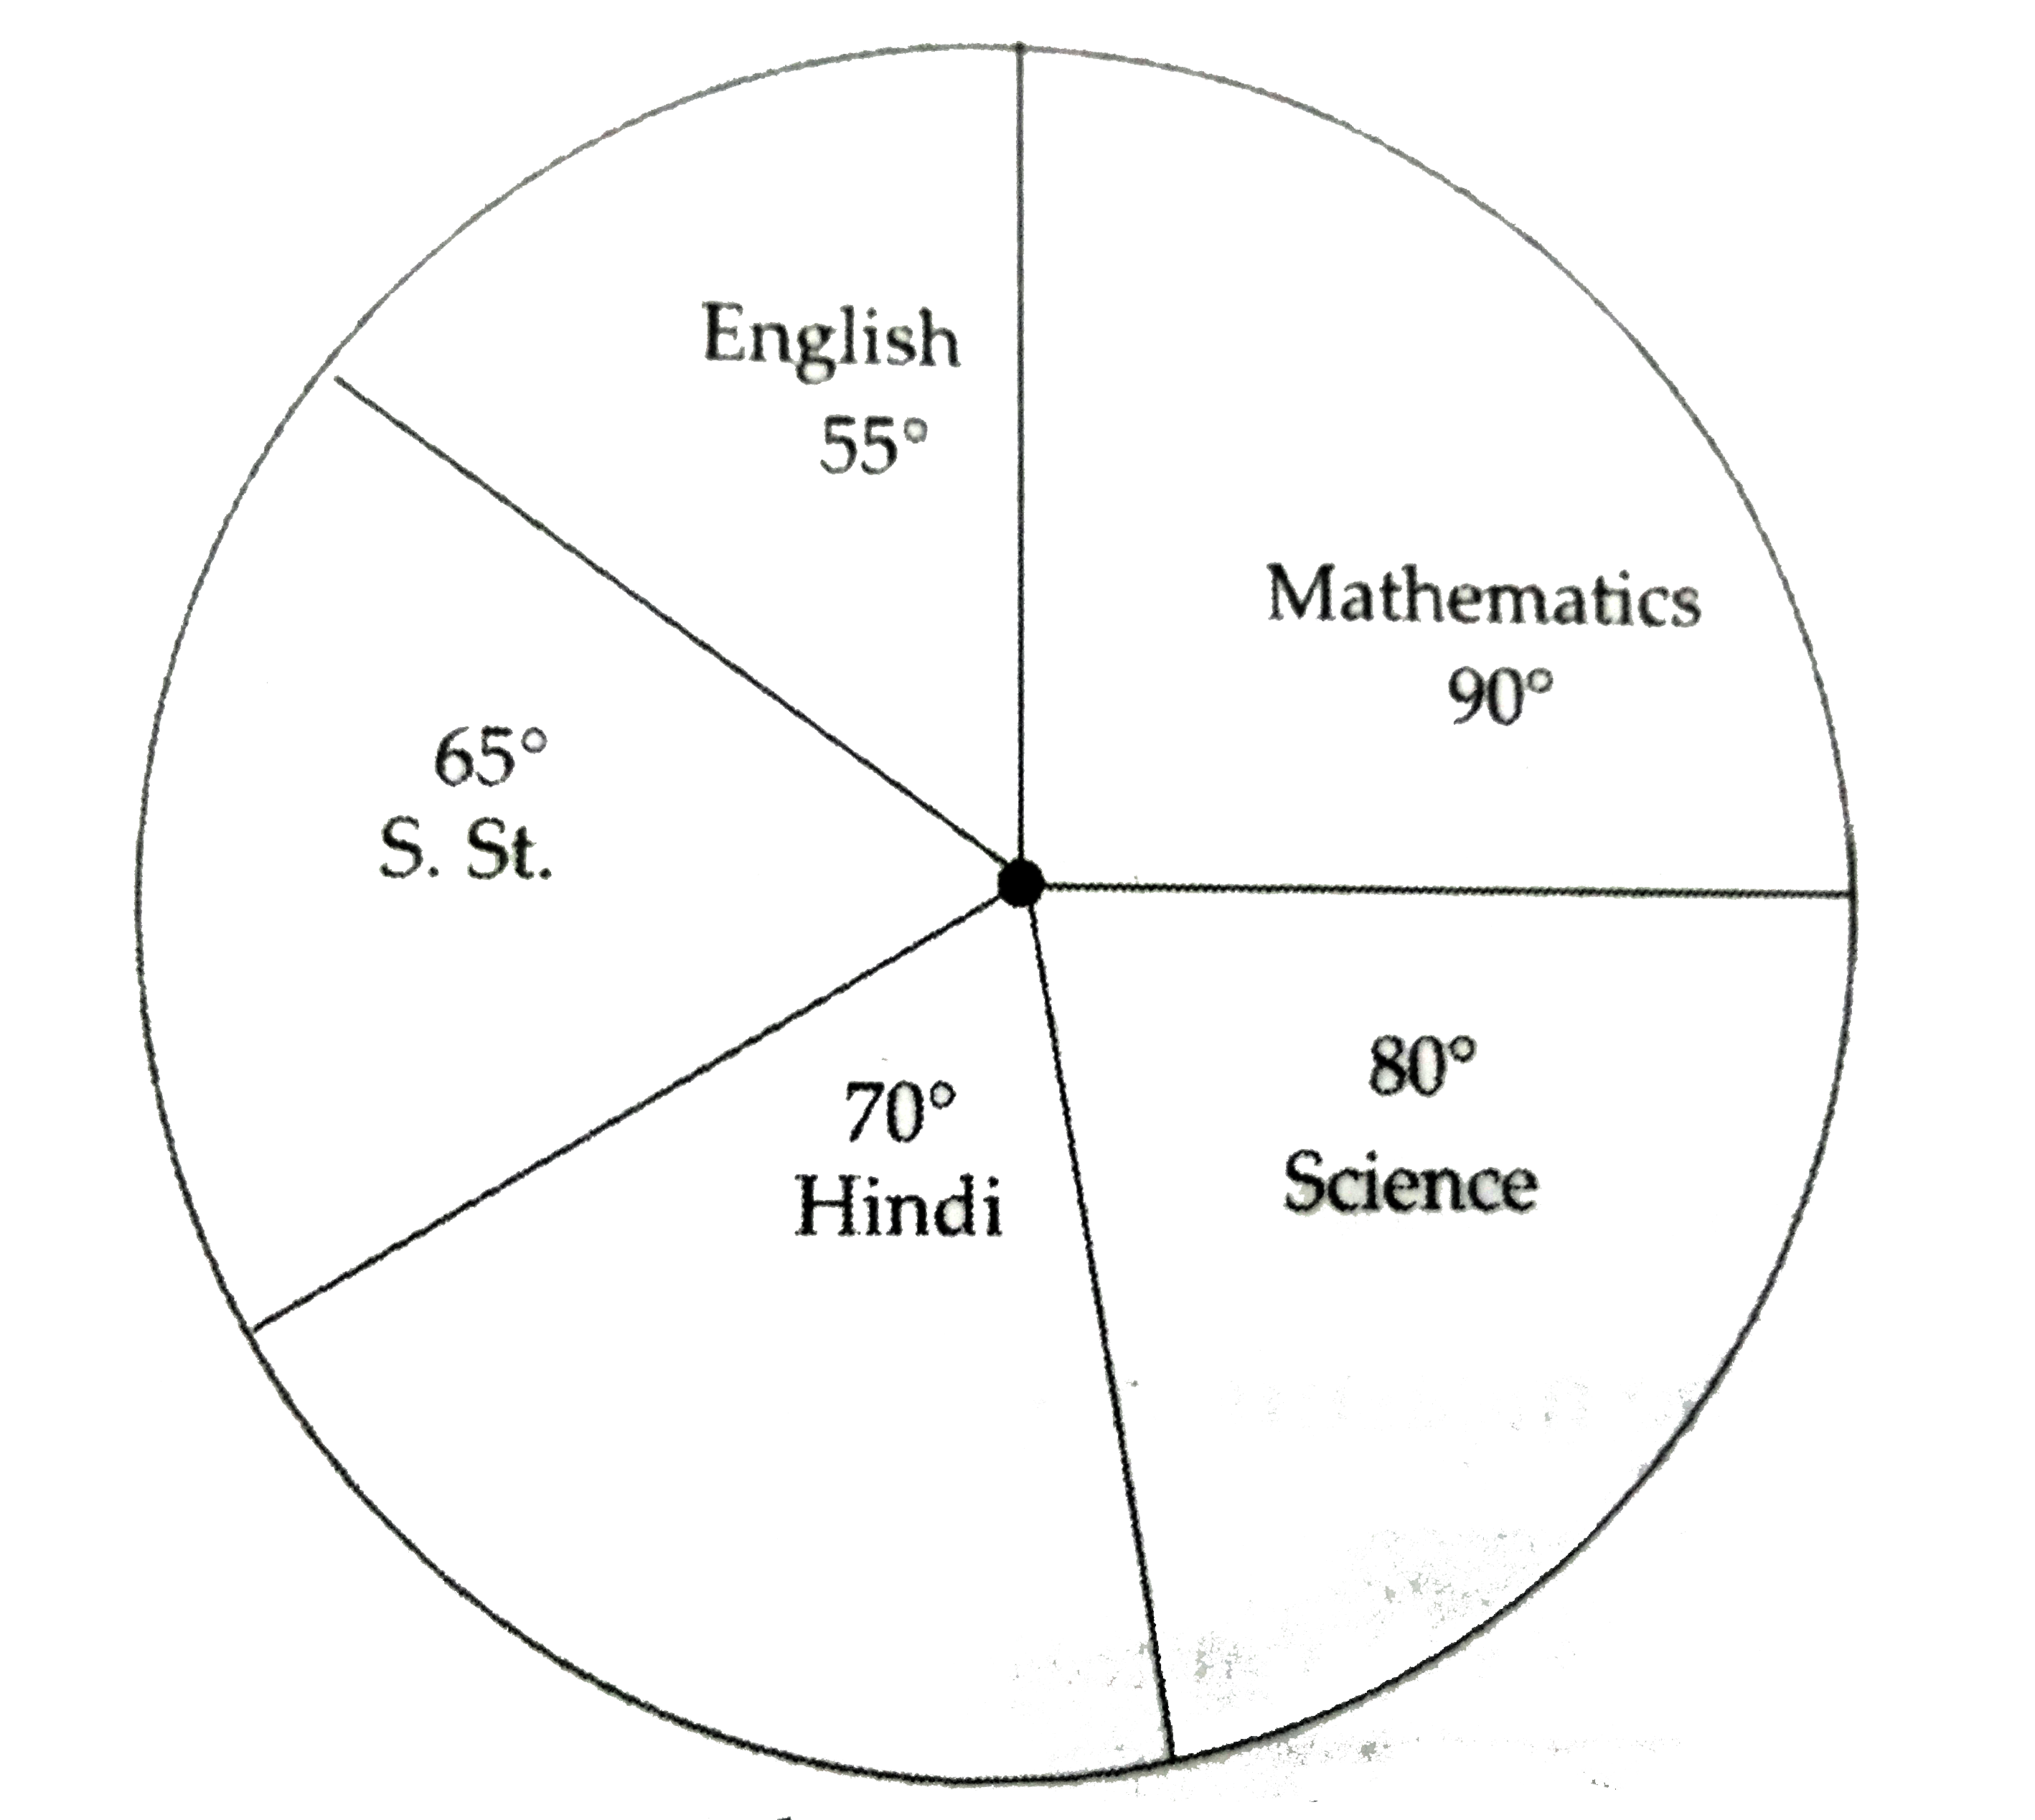
which subject he get the least marks ?
View Solution
PROBLEM FOR PRACTICE (Based on practice set ) questions and complete solutions for chapter STATISTICS of CHETAN MATHS (TAMIL ENGLISH) of Class 10