Complete Solutions to EXAMPLE of chapter Statistics of Class 10 book with complete answers and questions
| Class 10 | MATHS |
| Chapter | Statistics |
| CHETANA PUBLICATION | EXAMPLE |
| Number Of Questions | 27 |
| Academic Year | 2023-24 |
Find the class mark of the class 11 to 15.
01:39View SolutionThe classes are 5-10,10-15,15-20,…….Find the class width of each class.
02:36View SolutionFrom one footwear shop,12 pair of chappals were sold.The sizes of these chappals are given 7,8,6,7,7,5,9,6,7,8,7.find their mode.
03:04View SolutionFind the median of the data 30,25,32,23,42,36,40,33,21,43.
02:40View SolutionFind the mean of numbers 25,30,27,23 and 25.
02:49View SolutionThe following table shows the number of students and the time they utilized daily for their studies. Find the mean time spent by students for their studies by direct method.
 03:57View Solution
 01:42View Solution
A milk centre sold milk to 50 customers.The table below gives the number of customers and the milk they purchsed.Find the mean of the milk sold by direct method
 03:56View Solution
In the following table,the toll paid by drivers and the number of vehicles is shown.Find the mean of the toll by 'assumed mean' method.
 05:12View Solution
A frequency ditribution tabe for the production of oranges of some farm owners is given below.Find the mean production of oranges by 'assumed mean' method
 06:21View Solution
The loans sanctioned by a bank for construction of farm ponds are shown in the following table.Find the mean of the loans.
 04:12View Solution
The following frequency distribution table shows the amount of aid given to 50 flood affected families.Find the mean of the amount of aid.
 04:39View Solution
A frequency distribution of funds collected by 120 workers in a company for the drought affected people are given in the following table.Find the mean of the funds by 'step deviation' method.
 06:19View Solution
Find the fraction.
 04:24View Solution
The weekly wages of 120 workers in a factory are shown in the following frequency distribution table.Find the mean of the weekly wages.
 04:05View Solution
The following table shows classification of number of workers and the number of hours they work in a software company.Find the median of a number of hours they work.
 05:16View Solution
The frequency distribution table shows the number of mango trees in a grove and their yield of mangoes.Find the median of data.
 05:14View Solution
The production of electric bulbs in different factories is shown in the following table.Find the median of the productions.
 06:48View Solution
The distance covered by 250 public transport buses in a day is shown in the following frequency distribution table.Find the median of the distances.
 05:34View Solution
 01:23View Solution
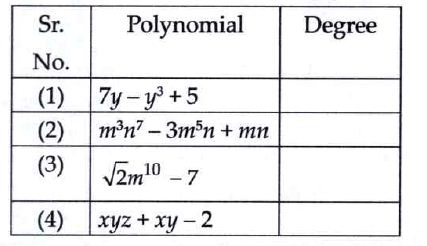
Find degree of the following
 01:23View Solution
The following table shows the information regarding the milk collected from farmers on a milk collection centre and the content of fat in the milk,measured by a lactometer.Find the mode of fat content.
 04:44View Solution
 01:42View Solution
 01:23View Solution
Medical checkup of 180 women was conducted in a health centre in a village.50 of them were short of heamoglobin,10 suffered from cataract and 25 had respiratory disorders.The remaining women were healthy.Show the information in a pie chart.
08:49View SolutionThe annual investments of a family in pie diagram are as follows: Immovable property `120^@`, shares `60^@`, post `30^@`, bank deposits `90^@` and mutual funds `60^@`. How much amount is deposited in bank if investment in shares is ₹2000?
02:03View SolutionThe annual investments of a family in pie diagram are as follows: Immovable property `120^@`, shares `60^@`, post `30^@`, bank deposits `90^@` and mutual funds `60^@`. How much more money is invested in immovable property than in mutual funds if amount invested in shares is ₹2000?
02:36View Solution
EXAMPLE questions and complete solutions for chapter Statistics of CHETANA MATHS (MARATHI ENGLISH) of Class 10
