Complete Solutions to EXAMPLES of chapter STATISTICS of Class 10 book with complete answers and questions
| Class 10 | MATHS |
| Chapter | STATISTICS |
| NCERT BANGLISH | EXAMPLES |
| Number Of Questions | 9 |
| Academic Year | 2023-24 |
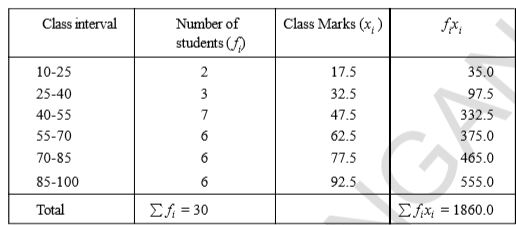
The marks obtained in mathematics by 30 students of Class X of a certain scholl are given in table the below. Find the mean of the marks obtained by the students.
 02:59View Solution
The table below gives the percentage distribution of female teachers in the primary schools of rural areas of various states and union territories (U.T) of India. Find the mean percentage of female teachers using all the three methods.
 03:19View Solution
The below distribution shows the numbers of wickets taken by bowkers in one-day cricket matches. Find the mean number of wickets by choosing a suitable method. What does the mean signify ?
 04:50View Solution
The wickets taken by a bowler in 10 cricket matches are as follows: 2,6,4,5,0,2,1,3,2,3. Find the mode of the data.
01:17View SolutionA survey conducted on 20 households in a locality by a group of students resulted in the following frequency table for the number of family members in a household.

Find the mode of this data.04:33View SolutionThe marks distribution of 30 students in a mathematics examination are given in the adjacent table. Find the mode of this data. Also compare and interpret the mode and the mean .
 03:22View Solution
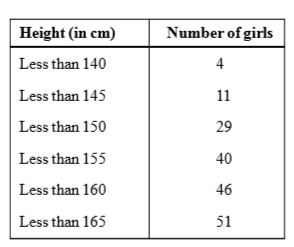
A survey regarding the heights (in cm) of 51 girls of Class X of a school was conducted and data was obtained as shown in table. Find their median.
 03:23View Solution
The median of the following data is 525. Find the values of x and y , if the total frequency is 100. Here, CI stands for class interval and Fr for frequency.
 04:04View Solution
Find True or False: 14 is the mode of the data 3,14,15,13,11,14,18.
02:02View Solution
EXAMPLES questions and complete solutions for chapter STATISTICS of NCERT MATHEMATICS (Bengali) of Class 10
