Complete Solutions to Exercise 14.1 of chapter STATISTICS of Class 10 book with complete answers and questions
| Class 10 | MATHS |
| Chapter | STATISTICS |
| NCERT TAMIL | Exercise 14.1 |
| Number Of Questions | 8 |
| Academic Year | 2023-24 |
In a tree plantation programme, the number of trees planted by students of different classes is given in the following table. Draw a pie diagram showing the information.

View SolutionThe following distribution shows the daily pocket allowance of children of a locality. The mean pocket allowance is Rs 18. Find the missing frequency f.

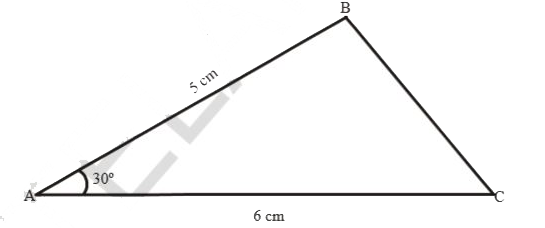
View SolutionIn the adjacent figure. AC = 6 cm, AB = 5 cm and `angleBAC = 30^(@)`. Find the area of the triangle.

View SolutionA frequency distribution table for the production of oranges of some farm owners is given below . Find the mean production of oranhes by assmed mean method .

View SolutionThe table below the daily expenditure on food of 25 household in a locality.

Find the mean dialy expenditure on a food by a suitable method.
View SolutionFill in the Table:

View SolutionThe marks obtained in mathematics by 30 students of Class X of a certain scholl are given in table the below. Find the mean of the marks obtained by the students.

View SolutionThe following table shows the ages of the patients admitted in a hospital on a particular day :

Find the mode and the mean of the data given below. Compare and interpret the two measures of central tendency.
View Solution
Exercise 14.1 questions and complete solutions for chapter STATISTICS of NCERT Maths(Tamil) of Class 10