Complete Solutions to Graphical Questions of chapter THERMOMETRY, THERMAL EXPANSION AND CALORIMETRY of Class 11 book with complete answers and questions
| Class 11 | PHYSICS |
| Chapter | THERMOMETRY, THERMAL EXPANSION AND CALORIMETRY |
| ERRORLESS | Graphical Questions |
| Number Of Questions | 14 |
| Academic Year | 2023-24 |
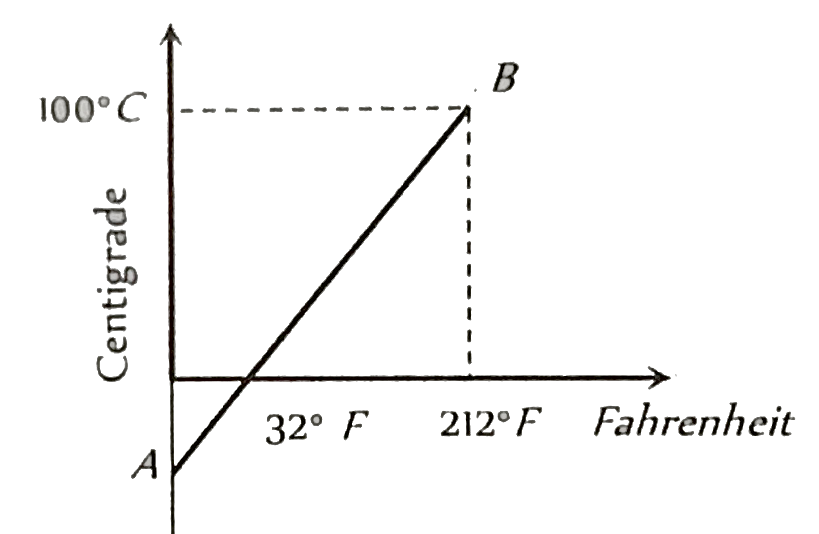
The graph AB shown in figure is a plot of temperature of a body in degree celsius and degree Fahrenheit. Then
 01:43View Solution
The graph shows the variation of temperature (T) of one kilogram of a material with the heat (H) supplied to it. At O, the substance is in the solid state. From the graph, we can conclude that
 02:13View Solution
A block of ice at `-10^@C` is slowly heated and converted to steam at `100^@C.` Which of the following curves represents the phenomenon qualitatively?
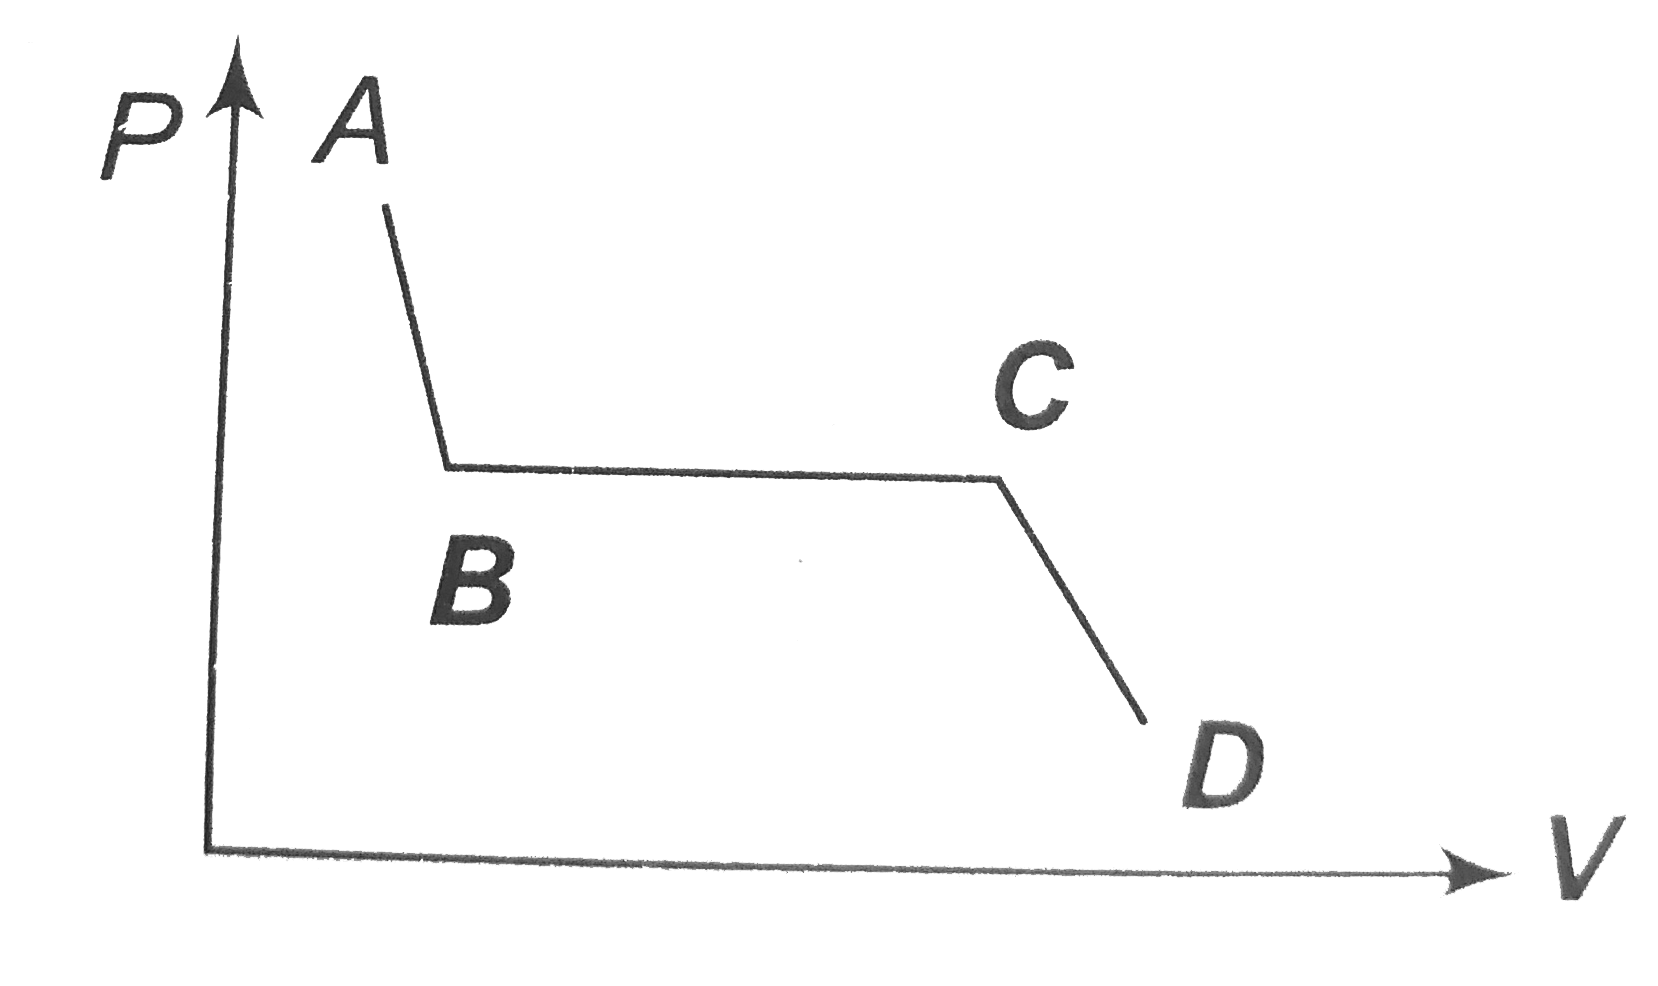
02:05View SolutionThe portion `AB` of the indicator diagram representing the state of matter denots
 01:18View Solution
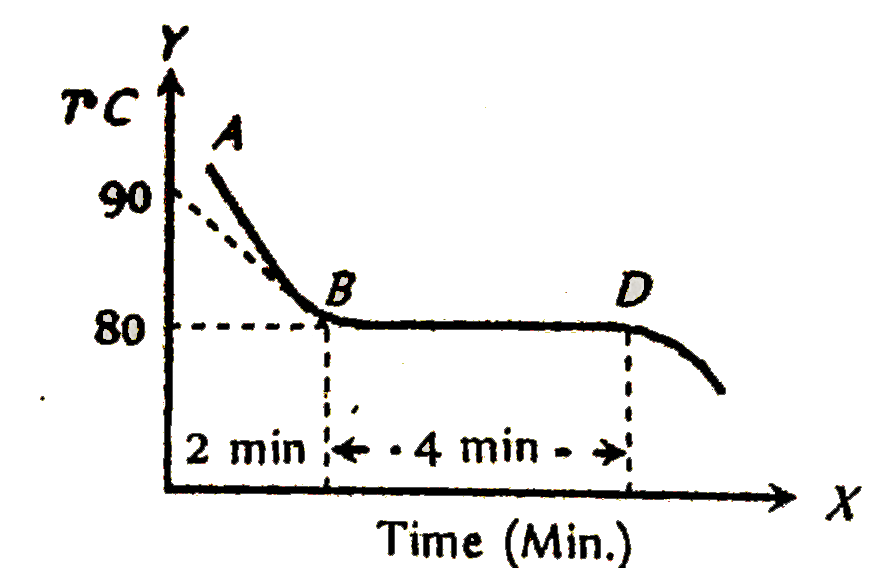
The figure given below shows the cooling curve of pure wax material after heating. It cools from A to B and solidifies along BD . If L and C are respective values of latent heat and the specific heat of the liquid wax, the ratio L / C is
 03:24View Solution
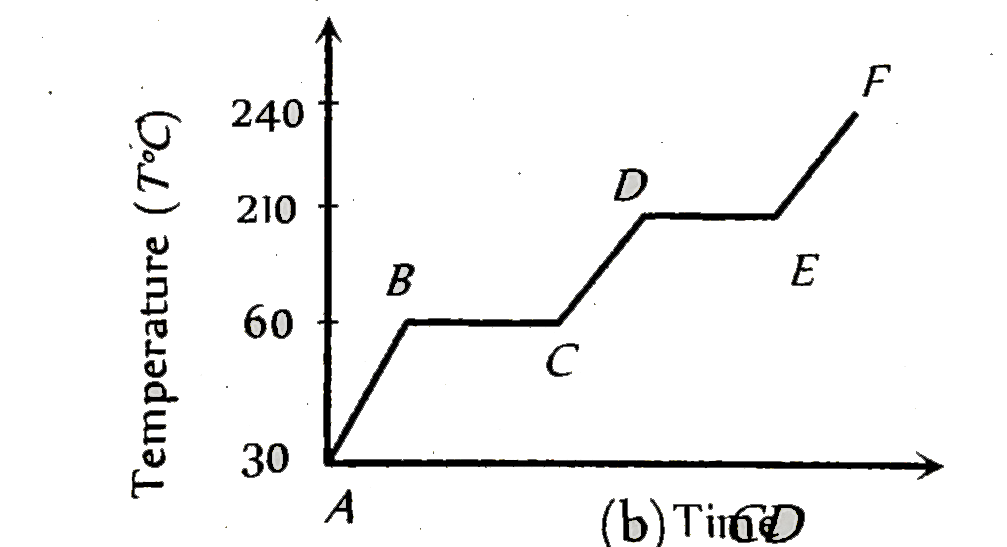
A solid substance is at `30^(@)C` . To this substance heat energy is supplied at a constant rate. Then temperature versus time graph is as shown in the figure. The substance is in liquid state for the portion (of the graph)
 02:45View Solution
Which of the following curve represent variation of density of water with temperature best-
02:43View SolutionIf a graph is plotted taking the temperature in Fahrenheit along the `Y`-axis and the corresponding temperature in Celsius along the `X`-axis, it will be a straight line
03:19View SolutionWhich of the curves in figure represents the telation between Celsius and Fahrenheit temperatures? `
`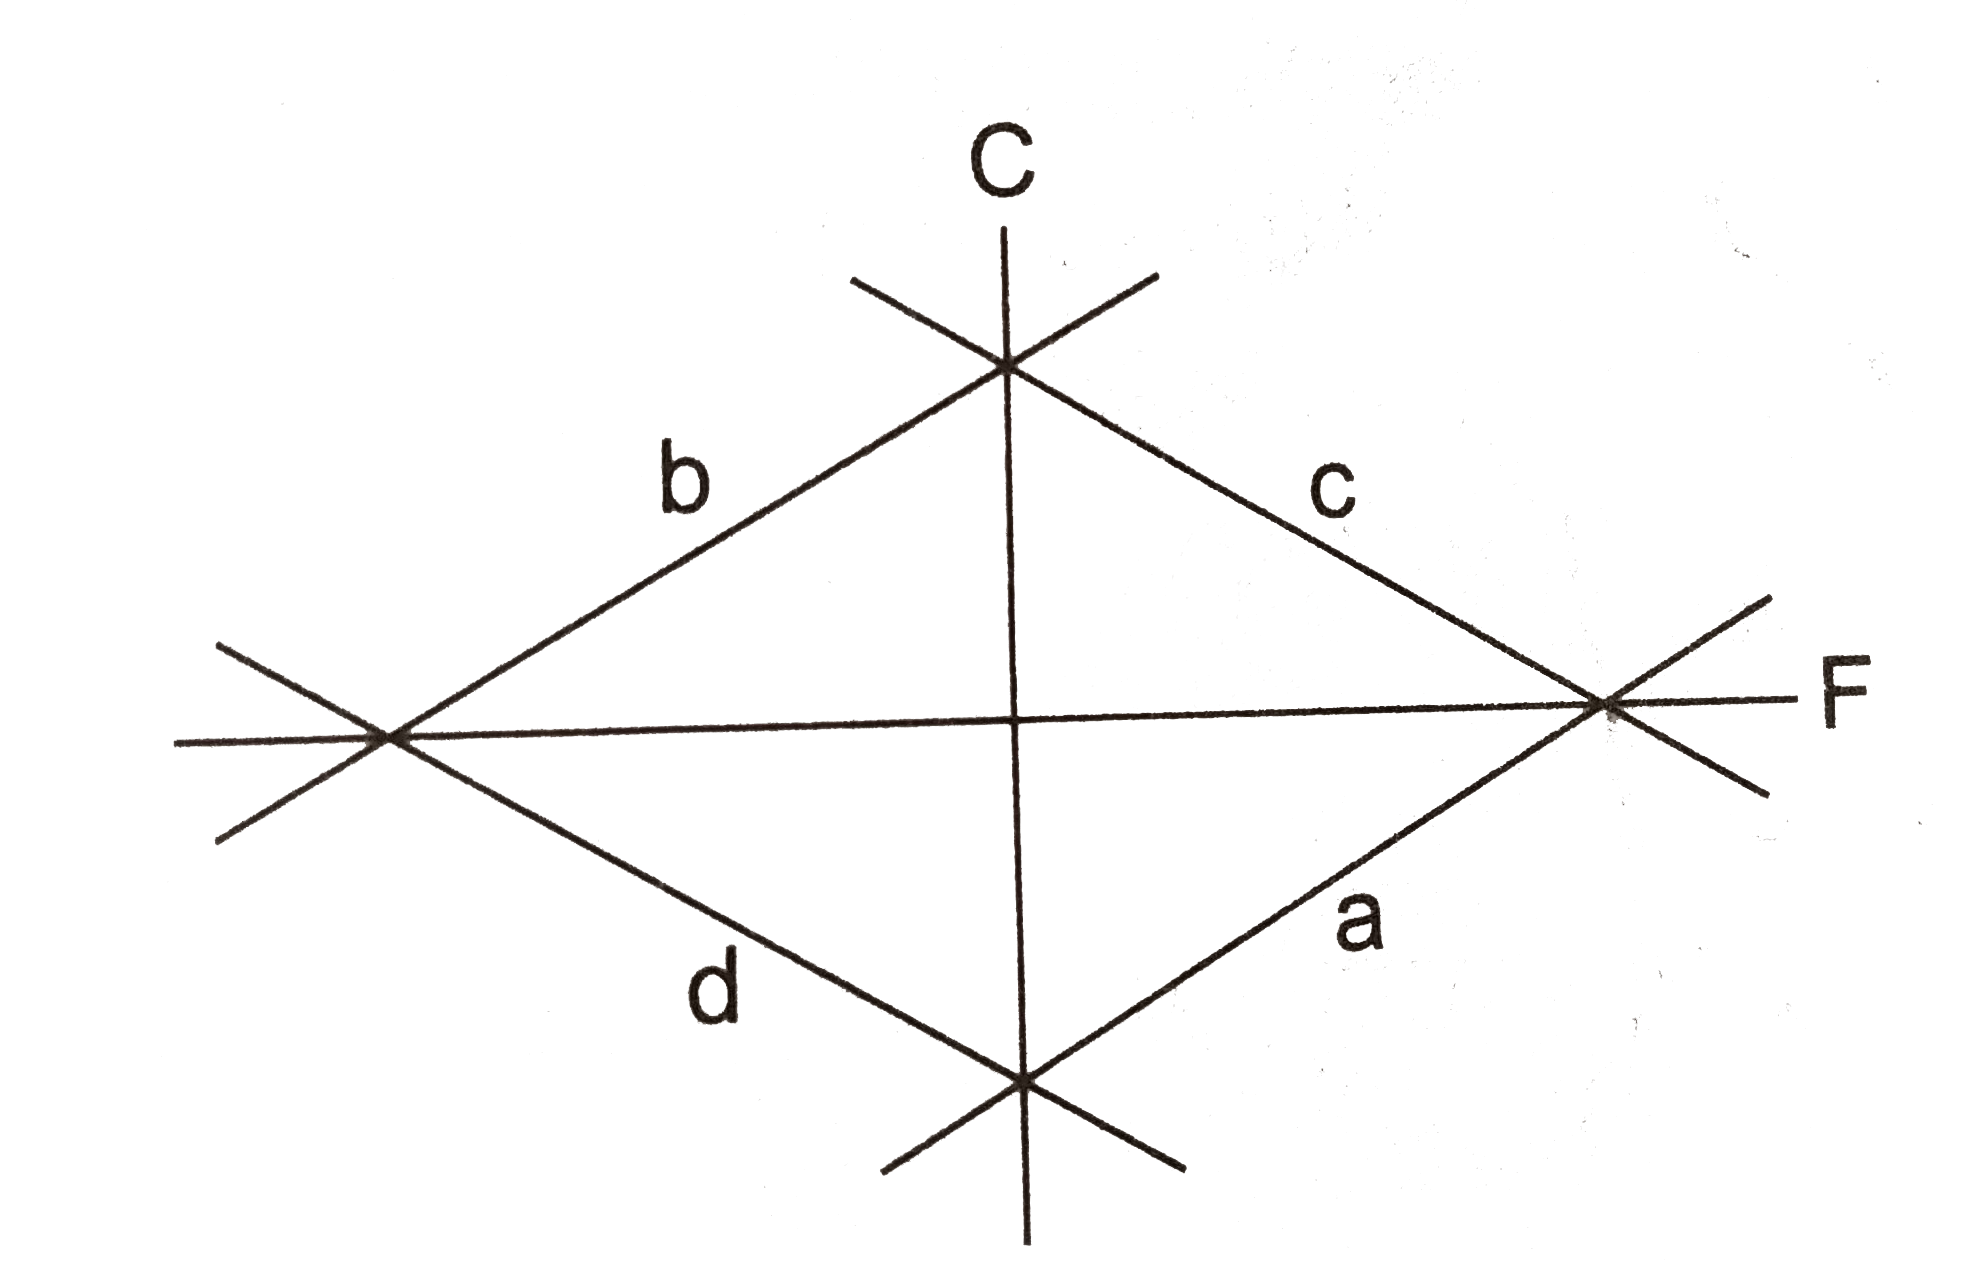 03:09View Solution
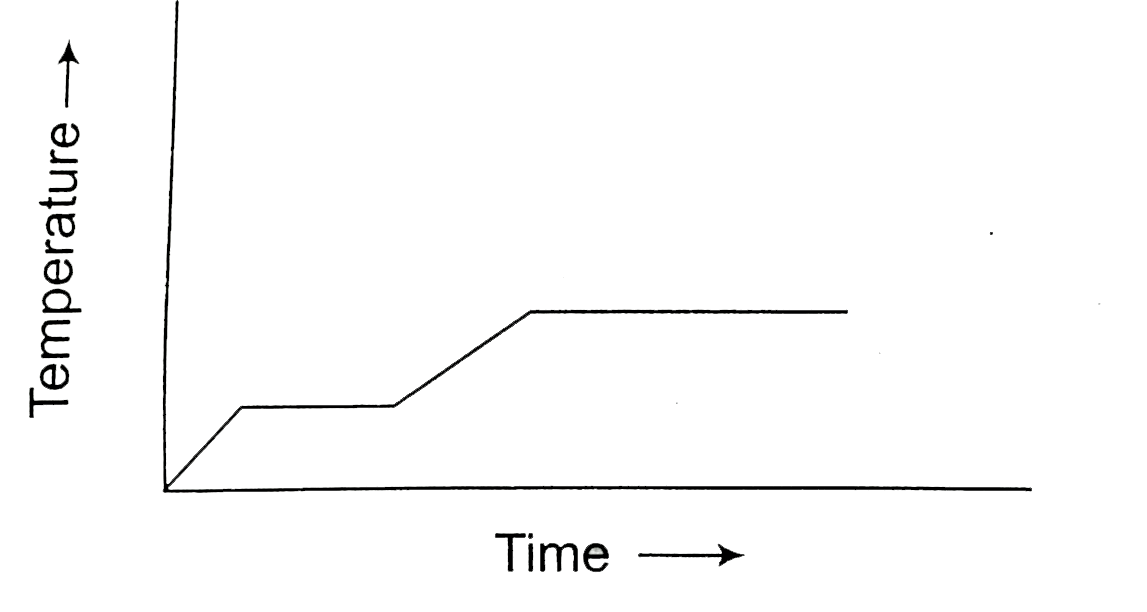
Heat is supplied to a certain homogeneous sample of matter, at a uniform rate. Its temperature is plotted against time, as shown Which of the following conclusions can be drawn?
(i) Its specific heat capacity is greater in the solid state than the liquid state.
(ii) Its specific heat capacity is greater in the liquid state than in the solid state.
(iii) Its latent heat of vaporization is greater than its latent heat of fusion.
(iv) Its latent heat of vaporization is smaller than its latent heat of fusion03:39View Solution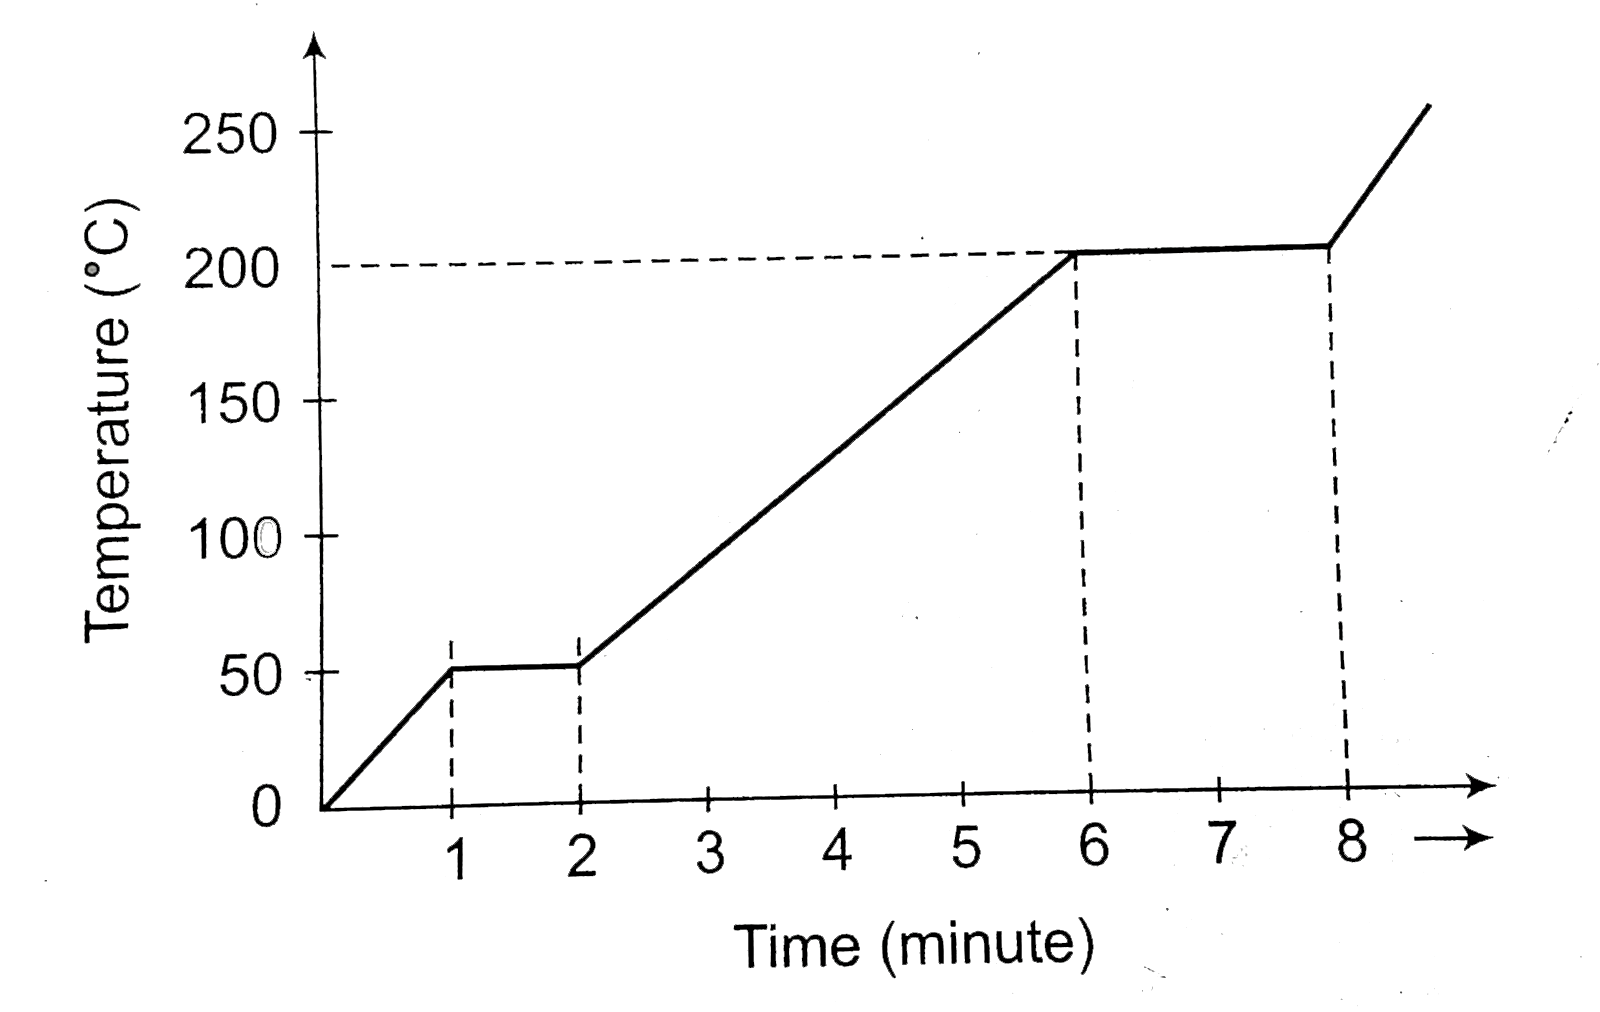
A student takes 50 g wax (specific heat `=0.6 kcal//kg^(@)C`) and heats it till it boils. The graph between temperature and time is as follows. Heat supplied to the wax per minute and boiling point are respectively.05:05View SolutionThe graph signifies
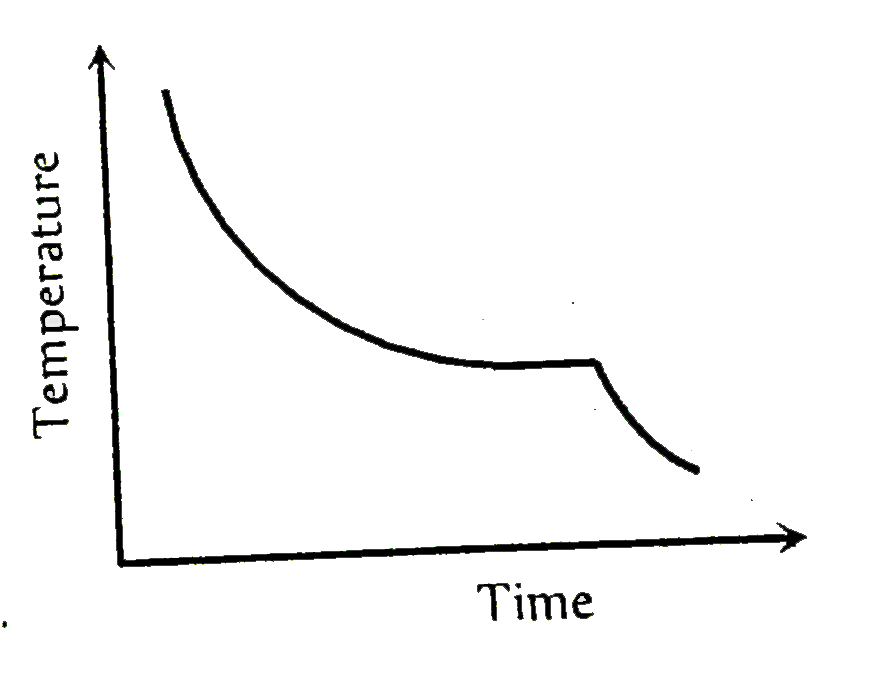 03:41View Solution
Which of the substances A, B or C has the highest specific heat ? The temperature vs time graph is shown
 01:47View Solution
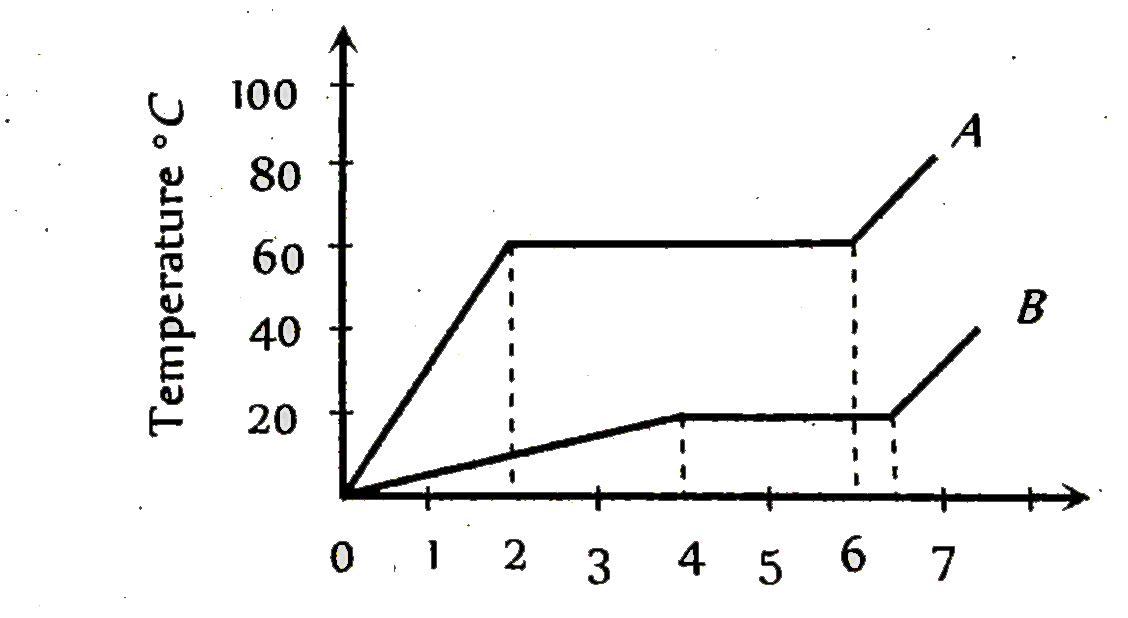
Two substances A and B of equal mass m are heated at uniform rate of `6 cal s^(-1)` under similar conditions. A graph between temperature and time is shown in figure. Ratio of heat absorbed `H_(A)//H_(B)` by them for complete fusion is
 View Solution
Graphical Questions questions and complete solutions for chapter THERMOMETRY, THERMAL EXPANSION AND CALORIMETRY of UNIVERSAL BOOK DEPOT 1960 PHYSICS (HINGLISH) of Class 11
