Complete Solutions to QUESTION BANK of chapter STATISTICS of Class 11 book with complete answers and questions
| Class 11 | MATHS |
| Chapter | STATISTICS |
| V PUBLICATION | QUESTION BANK |
| Number Of Questions | 45 |
| Academic Year | 2023-24 |
Find the mean deviation about the mean for the following data: `6,7,10,12,13,4,8,12`
View SolutionFind the mean deviation about țhe mean for the following data:
`12,3,18,17,4,9,17,19,20, 15,8,17,2,3,16,11 , 3,1,0,5.`
View SolutionFind the mean deviation about the median fơr the following data:
`3,9,5,3,12,10,18,4,7,19 , 21.`
View SolutionFind mean deviation about the mean for the following data:

View SolutionFind the mean deviation from the mean for the following data.

View SolutionCalculate the mean deviation about median for the following data:
 .
.
View SolutionFind the mean deviation about the mean for the following data:
4,7,8,9,10,12,13,17.
View SolutionFind the mean deviation about the mean for the following data:
38,70,48,40,42,55,63,46,54,44.
View SolutionFind the mean deviation about the median for the following data:
13,17,16,14,11,13,10,16,11,18,12,17.
View SolutionFind the mean deviation about the median for the following data:
36,72,46,42,60,45,53,46,51,49
View SolutionFind the mean deviation about the mean for the following data:

View SolutionFind the mean deviation about the mean for the following data:

View SolutionFind the mean deviation about the median for the following data:

View SolutionFind the mean deviation about the median for the following data:

View SolutionFind the mean deviation about the mean for the following data:

View SolutionFind the mean deviation about the mean for the following data:

View SolutionFind the mean deviation about the median for the following data:

View SolutionFind the mean deviation about the median for the following data:

View SolutionFind the Variance of the following data: `6,8, 10,12,14,16,18,20,22,24`
View SolutionFind the variance.and ștandard deviation for the following data:

View SolutionCalculate the mean, variance and standard deviation for the following distribution.

View SolutionFind the standard deviation for the folowing data :

View SolutionCalculate the mean, variance and standard deviation for the following distribution.

View SolutionFind the mean and variance for the following data 6,7,10,12,13,4,8,12
View SolutionWrite the sum of first n natural numbers.
View SolutionFind the mean and variance of the first 10 multiples of 3.
View SolutionFind the mean and standard deviation using short-cut method

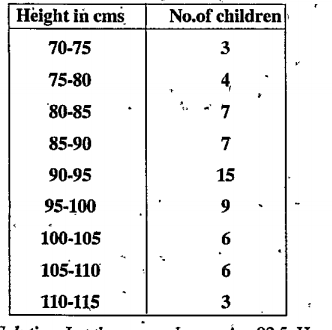
View SolutionFind the mean and variance for the following frequency distribution.

View SolutionFind the mean, variance and standard deviation using short cut method.

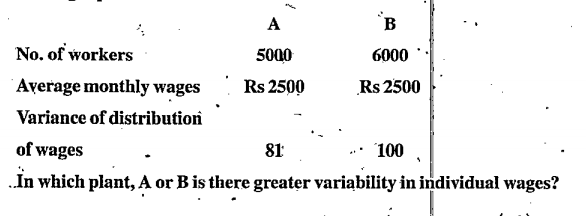
View SolutionTwo plants A and B of a factory show following results about the number of workers ands the wages paid to them.

View SolutionCoefficient of variation of two distributions are 60 and 70 and their standard deviations are 21 and 16 respectively.What are their arithmetic means?
View SolutionThe following values are calculated in respect of heights and weights of the students of a section of Class XI:

View SolutionThe following is the rècord of goals scored by team '(A)' in a football session.

View SolutionThe sum and squares corresponding to length x(in cm) and y(in gm) of 50 plant products are given below:
`sum_(i=1)^50 x_i=212,sum_(i=1)^50 x_i^2=902.8`
`sum_(i=1)^50 y_i=261,sum_(i=1)^50 y_i^2=1457.6`
which is more varying , the length or weight?
View SolutionThe variance of 20 observations is '5 .' If each observation is multiplied by 2, find the new variance of the resulting observations.
View SolutionThe mean of 5 observations is 4.4 and their variance is 8.24.If three of the observations are 1,2 and 6,find the other two observations.
View SolutionIf each of the observation x1,x2,………..xn is increased by 'a',where a is a negative or positive number,shows that the variance remains unchanged.
View SolutionThe mean and standard deviation of 100 observations were calculated as 40 and '5.1', respectively by a student who took by mistake 50 instead of 40 for one observation. What are the correct mean and standard deviation?
View SolutionThe mean and variance of 7 observations are 8 and 16 respectively. If five of the observations are '2,4,10,12,14'. Find the remaining two observations:
View SolutionThe mean and standard deviation of six observations are 8 and 4, respectively. If each observation is multiplied by 3, find the new mean and new standard deviation of the resulting observations.
View SolutionThe mean and standard deviation of marks obtained by. 50 students of a class in. three subjects, Mathematics, Physics and Chemistry are given below.

Which of three subjects shows the highest variability, in marks and which shows the lowest?
View SolutionCalculate the mean deviation about median from the following data
`340,150,210, 240,300,310,320.`
View SolutionFind the mean deviation about the mean for the following data: `6,7,10,12,13,4,8,12`
View SolutionFind the variance and standard deviation for the following data
`65,68,58,44,48,45, 60,62,60,50`
View SolutionIf each of the observation x1,x2,………..xn is increased by 'a',where a is a negative or positive number,shows that the variance remains unchanged.
View Solution
QUESTION BANK questions and complete solutions for chapter STATISTICS of V PUBLICATION of Class 11