Complete Solutions to EXERCISE 14.3 of chapter DATA HANDLING of Class 6 book with complete answers and questions
| Class 6 | MATHS |
| Chapter | DATA HANDLING |
| SWAN PUBLICATION | EXERCISE 14.3 |
| Number Of Questions | 5 |
| Academic Year | 2023-24 |
Read the adjoining bar graph showing the number of students in a particular class of a school:
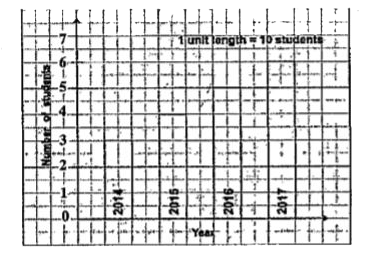
Answer tbe following questions :
(i) What is the scale of.this graph ?
(ii) How many students are there in 2016 ?
(iii) Is the number of students in the year 2017 twice the year 2014 ?
View SolutionRead the bar graph and answer the following questions :
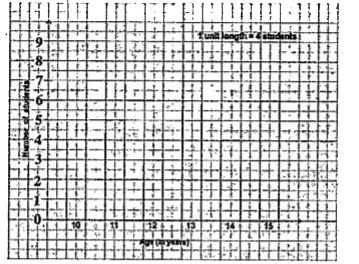
(i) What is the information given by the bar, graph ?
(ii) Which scale is used in this bar graph ?
(iii) What is the maximum age ? How many students have maximum age?
(iv) How many students have minimum age ?
(v) How-many students are 13 years old ?
View SolutionRead the given bar graph and answer the following questions:
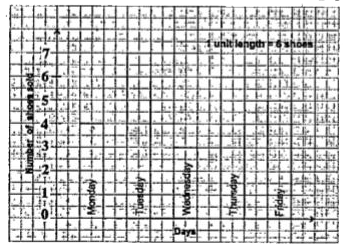
(i) What information does the bar graph represent ?
(ii) What is the scale chosen for this graph ?
(iii) On which day were the maximum number of shoes sold and how many ?
(iv) On which day were the minimum number of shoes sold and how many ?
(v) How many shoes were sold on Thursday ?
View SolutionRead the bar graph which shows the number of books of different subjects in a library:
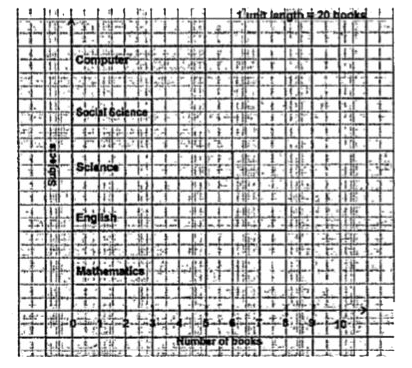
Answer the following questions :
(i) What information does the bar graph gives ?
(ii) Which is the scale chosen for this graph ?
(iii) Which subject has maximum number of books and how-many ?
(iv) Which subject has minimum number of books and how many ?
View SolutionThe number of Mathematics books sold by a shopkeeper on the different days are shown below:
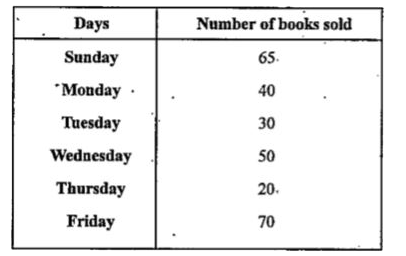
Draw a bar graph to represent the above information choosing the scale of your choice.
View Solution
EXERCISE 14.3 questions and complete solutions for chapter DATA HANDLING of SWAN PUBLICATION of Class 6