Complete Solutions to EXERCISE 3.3 of chapter DATA HANDLING of Class 7 book with complete answers and questions
| Class 7 | MATHS |
| Chapter | DATA HANDLING |
| SWAN PUBLICATION | EXERCISE 3.3 |
| Number Of Questions | 9 |
| Academic Year | 2023-24 |
Following data gives total marks (out of 600) obtained by six students of a particular class. Represent the data on a bar graph.

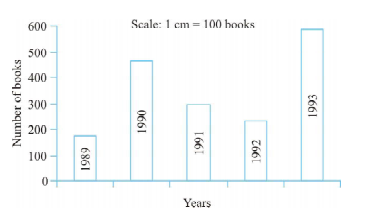
View SolutionRead the bar graph which shows the number of books sold by a bookstore during five consecutive years and answer the following questions:

About how many books were sold in 1989? 1990? 1992?
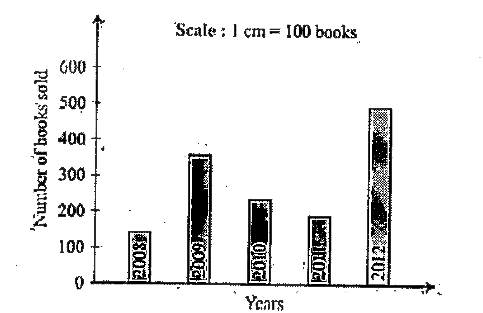
View SolutionThe following bar graph shows the number of books sold by a bookstore during five consecutive years. Read the bar graph and answer the following questions.
In which year about 475 books ? And in which year were about 25 books sold ?

View SolutionTwo hundred students of 6th and 7th class were asked to name their favourite so as to decide upon what should be the colour of their school building. The results are shown in the table :

Which is the most preferred colour ?
View SolutionTwo hundred students of 6th and 7th class were asked to name their favourite so as to decide upon what should be the colour of their school building. The results are shown in the table :

Represent the data on a graph.
Which is the least preferred colour ?
View SolutionTwo hundred students of 6th and 7th class were asked to name their favourite so as to decide upon what should be the colour of their school building. The results are shown in the table :

How many colours are there in all ? WHat are they ?
View SolutionConsider the following data collected from a survery of a colony :

Draw a double bar graph choosing an appropriate scale. What do you infer form the bar graph :
Which sports is the most popular ?
View SolutionConsider the following data collected from a survery of a colony :

Draw a double bar graph choosing an appropriate scale. What do you infer form the bar graph :
Which is more preferred, watching or participating in sports ?
View SolutionThe following table shows the time (in hours) Spent by a student of class VII in a day.

View Solution
EXERCISE 3.3 questions and complete solutions for chapter DATA HANDLING of SWAN PUBLICATION of Class 7