Complete Solutions to EXERCISE (SUBJECTIVE PROBLEMS) ( VERY SHORT ANSWER TYPE) of chapter INTRODUCTION TO GRAPHS of Class 8 book with complete answers and questions
| Class 8 | MATHS |
| Chapter | INTRODUCTION TO GRAPHS |
| MTG IIT JEE FOUNDATION | EXERCISE (SUBJECTIVE PROBLEMS) ( VERY SHORT ANSWER TYPE) |
| Number Of Questions | 19 |
| Academic Year | 2023-24 |
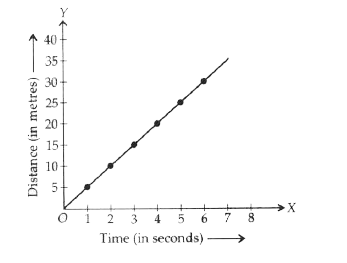
Given below is the distance vs time graph d=5t , where d is distance and t is time. Read the graph carefully and answer the questions given below:

Find the distance covered when time is 3 sec.
(ii) Find the distance covered in 5 seconds.
(iii) Find the time in which the body covered 30 m.
View SolutionPlot the following points on a graph paper:
(3,2)
View SolutionPlot the following points on a graph paper:
(2,2)
View SolutionGiven the ordinate and abscissa for each of the following points:
A(2,3)
View SolutionGiven the ordinate and abscissa for each of the following points:
B(3,2)
View SolutionGiven the ordinate and abscissa for each of the following points:
C(0,7)
View SolutionGiven the ordinate and abscissa for each of the following points:
D(3,0)
View SolutionPlot any three points such that x-coordinate of each point is equal to its y-coordinate. Join these points in pairs. Do they lie on a line passing through the origin?
View SolutionThe following table gives the information regarding the number of persons employed to do a piece of work and time taken to complete the work:

Plot the line graph for this information.
View SolutionDraw the graph of y = 3x +1.
View SolutionIf in a point abscissa is negative and ordinate is positive , then in which quadrant the point lies.
View SolutionA stone is dropped off the edge of a cliff. The height (h metres) of the cliff is proportional to the square of the time (t seconds) taken by the stone to reach the ground.
Write down a relationship between h and t, using k as the constant of variation.
View SolutionA stone is dropped off the edge of a cliff. The height (h metres) of the cliff is proportional to the square of the time (t seconds) taken by the stone to reach the ground.
Calculate the value of k, using the information, "The stone takes 5 seconds to reach the ground when dropped off a cliff, 125 m high.'
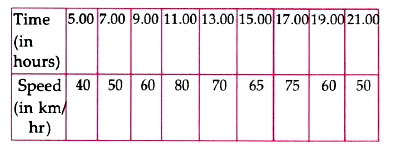
View SolutionA car is going for a long journey of 16 hours, 4. starting at 5:00 hrs. The speeds of the car at different hours are given below: Draw a velocity-time graph for the above data.

View SolutionThe prices of different lengths of ladder (in m ) is shown in the following table:

Represent this information by a graph.
View SolutionThe perimeter `P` and sides of a square are connected by the relation `P=4sdot` Draw the graph of this relation on the graph paper.
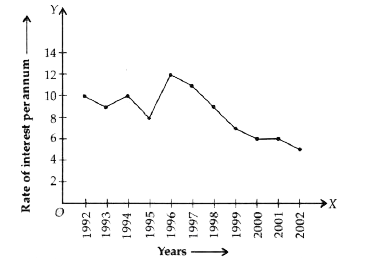
View SolutionThe graph exhibits the rate of interest on fixe deposits upto one year announced by the Reserve Bank of India in different years. Read the graph and find :

(i) In which period was the rate of interest maximum?
(ii) In which period was the rate of interest minimum?
View SolutionFrom the data given below, draw a linear graph showing the relationship between the cost of trousers and the number of trousers.

View SolutionSimple interest on a certain sum is 40 per year. Then, S= `40 xx X,` where X is the number of years.
Find the value of S, when
(i) X=5 (ii) X=6.
View Solution
EXERCISE (SUBJECTIVE PROBLEMS) ( VERY SHORT ANSWER TYPE) questions and complete solutions for chapter INTRODUCTION TO GRAPHS of MTG IIT JEE FOUNDATION of Class 8
All Exercises from MTG IIT JEE FOUNDATION Class 8 MATHS INTRODUCTION TO GRAPHS
- EXERCISE (Assertion & Reason Type)
- EXERCISE (INTEGER/NUMERICAL VALUE TYPE)
- EXERCISE (MATCH THE FOLLOWING
- EXERCISE (Multiple Choice Question) (Level-1)
- EXERCISE (Multiple Choice Question) (Level-2)
- EXERCISE (SUBJECTIVE PROBLEMS) ( VERY SHORT ANSWER TYPE)
- EXERCISE (SUBJECTIVE PROBLEMS) (LONG ANSWER TYPE)
- EXERCISE (SUBJECTIVE PROBLEMS) (SHORT ANSWER TYPE)
- EXERCISE (SUBJECTIVE PROBLEMS) (VERY SHORT ANSWER TYPE)
- ILLUSTRATIONS
- NCERT SECTIONS (15.1)
- NCERT SECTIONS (15.2)
- NCERT SECTIONS (15.3)
- OLYMPIAD/HOTS CORNER
- SOLVED EXAMPLES