Complete Solutions to ADDITIONAL QUESTIONS FOR PRACTICE (Long Answer Type Questions ) of chapter INTRODUCTION TO GRAPHS of Class 8 book with complete answers and questions
| Class 8 | MATHS |
| Chapter | INTRODUCTION TO GRAPHS |
| NAND LAL PUBLICATION | ADDITIONAL QUESTIONS FOR PRACTICE (Long Answer Type Questions ) |
| Number Of Questions | 3 |
| Academic Year | 2023-24 |
The following table gives the information of the sales expected by a company and the actual sale during last 7 years . Draw the line graph of the information and answer the questions give below :

Were the actual sale and expected sale same during which year and how much was it ?
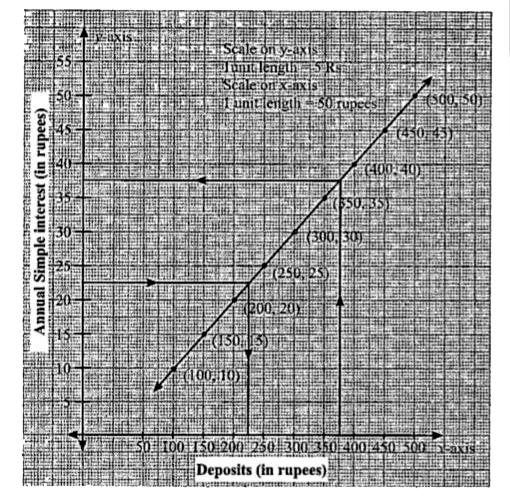
View Solutionbank gives `10%` simple interest on deposits .Draw the graph to illustrate the relation between the simple interest and the sum deposited . From the graph drawn find it . Investment made to get the annual simple interest of Rs . 22.50 .
View SolutionThe simple interest obtained on investing Rs . 375 .

View Solution
ADDITIONAL QUESTIONS FOR PRACTICE (Long Answer Type Questions ) questions and complete solutions for chapter INTRODUCTION TO GRAPHS of NAND LAL PUBLICATION of Class 8