Complete Solutions to TOPIC - 1 (4 Marks Questions) of chapter STATISTICS AND GRAPH WORK of Class 9 book with complete answers and questions
| Class 9 | MATHS |
| Chapter | STATISTICS AND GRAPH WORK |
| OSWAL | TOPIC - 1 (4 Marks Questions) |
| Number Of Questions | 9 |
| Academic Year | 2023-24 |
Construct the frequency distribution table from the following cumulative frequency table :
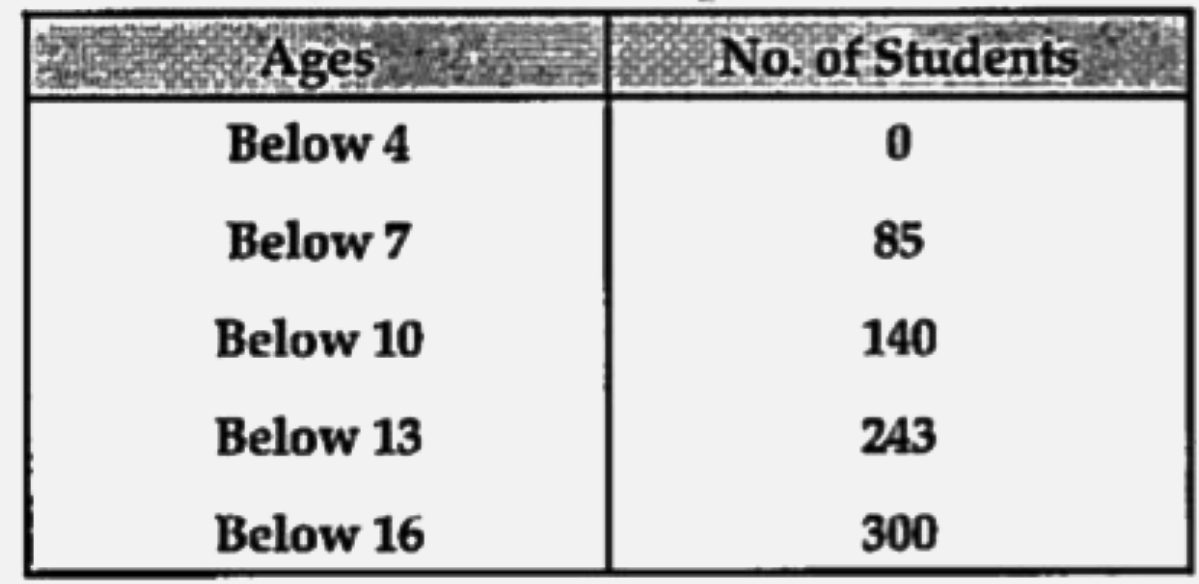
State the number of students in the age group 10 - 13.
View SolutionConstruct the frequency distribution table from the following cumulative frequency table :
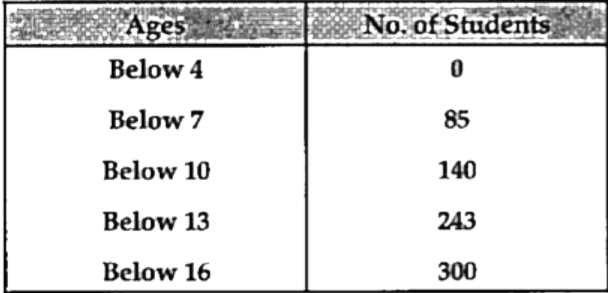
State the age - group which has the least number of students .
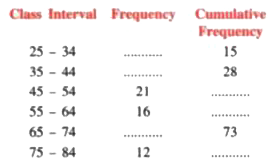
View SolutionFill in the blanks in the following table:
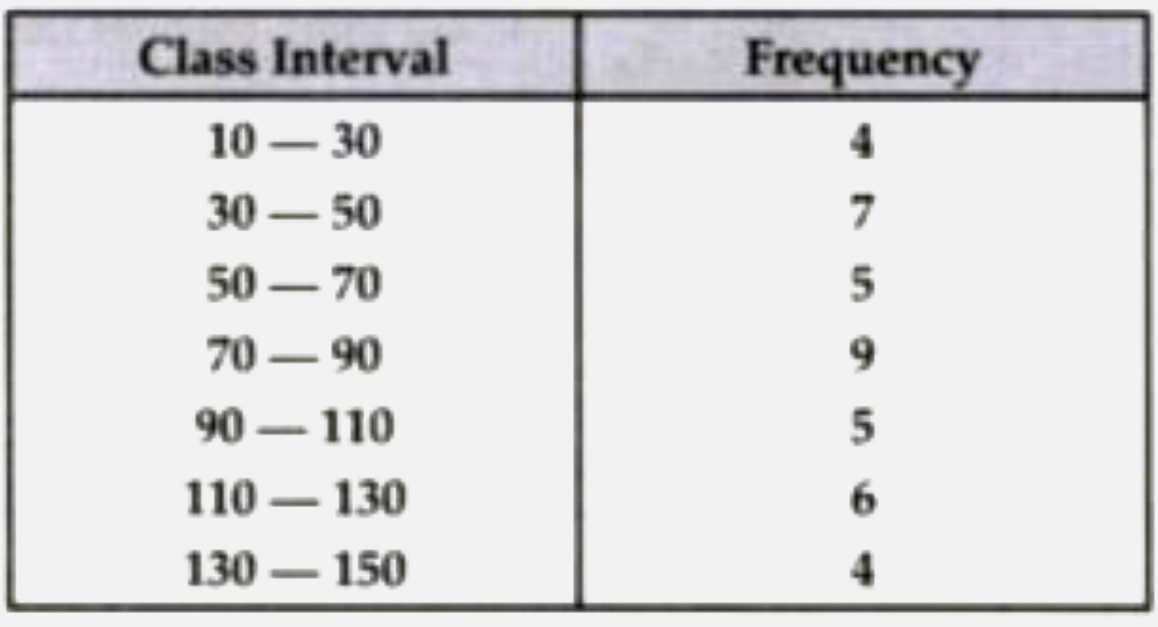
View SolutionDraw frequency polygons for each of the following :
Using histogram
View SolutionDraw frequency polygons for each of the following :
Without using histogram.
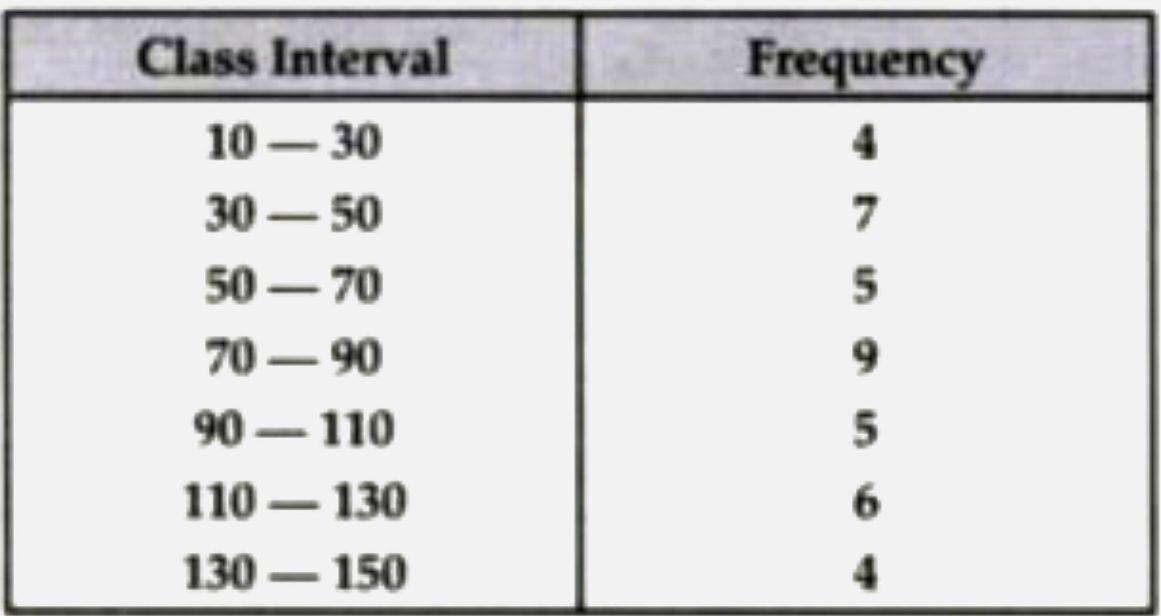
View SolutionConstruct a combined histogram and frequency polygon for the following frequency distribution :
`{:("Calss Interval","Frequency"),(10-20,3),(20-30,5),(30-40,6),(40-50,4),(50-60,2):}`
View SolutionConstruct a frequency polygon for the following data.
`{:("Calss Interval","Frequency"),(10-14,5),(15-19,8),(20-24,12),(25-29,9),(30-34,4):}`
View SolutionConstruct a frequency polygon for the following frequency distribution , using a graph sheet .
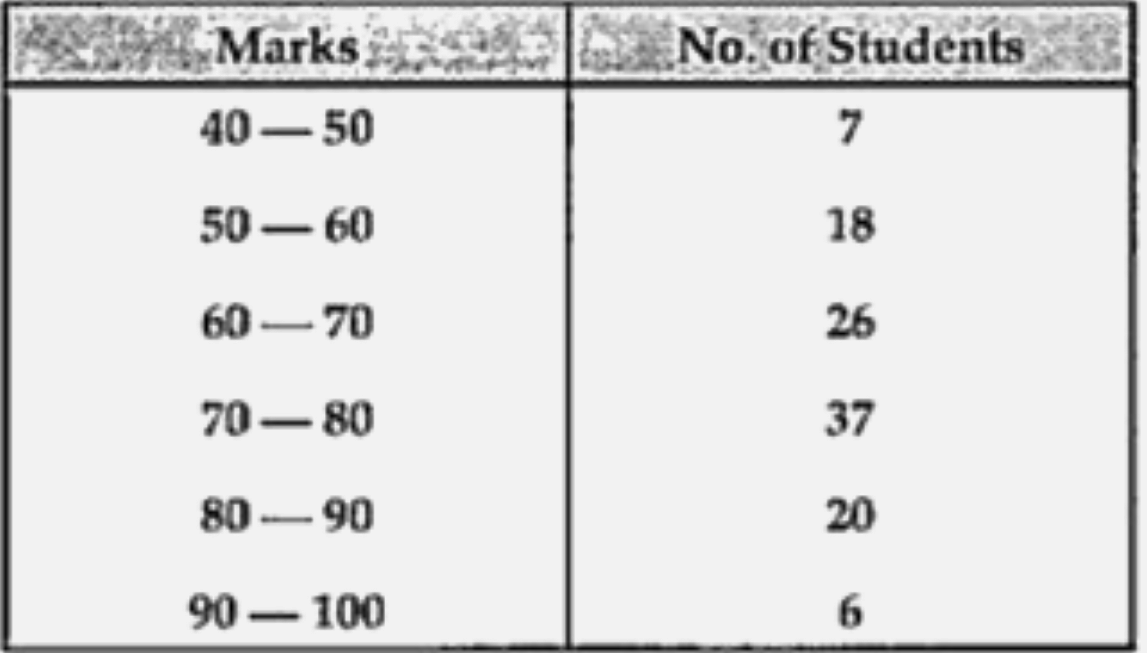
Use 2 cm = 10 Marks
2 cm = 5 Students [Specimen paper , 2019]
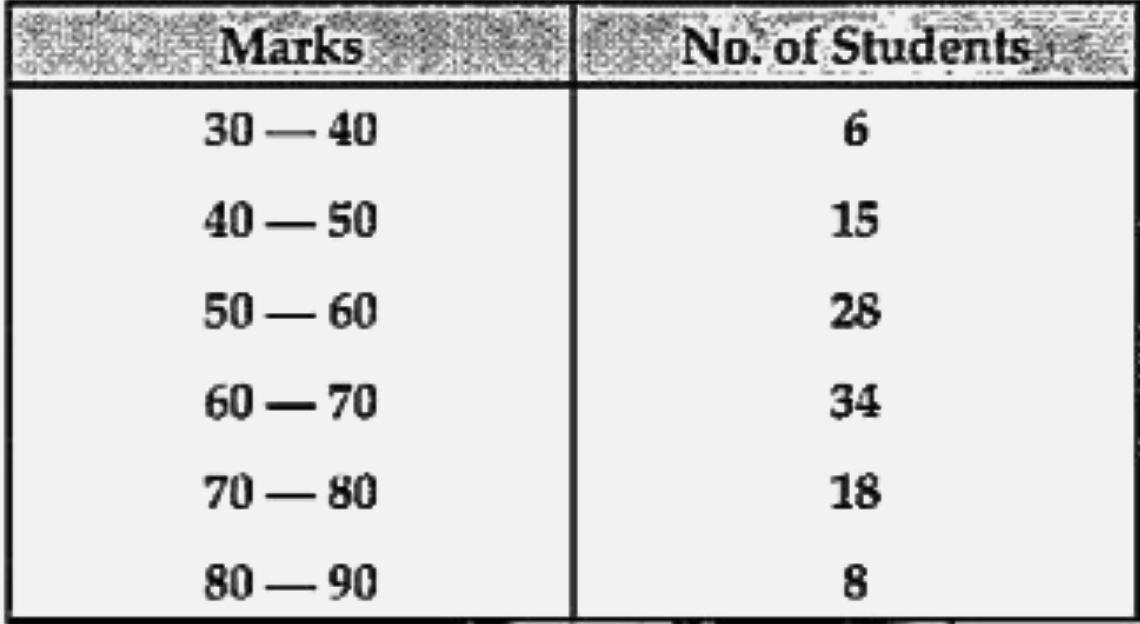
View SolutionConstruct a frequency polygon for the following distribution . Using a graph sheet.
View Solution
TOPIC - 1 (4 Marks Questions) questions and complete solutions for chapter STATISTICS AND GRAPH WORK of ICSE of Class 9