Complete Solutions to Problems From NCERT/exemplar of chapter PROBABILITY of Class 9 book with complete answers and questions
| Class 9 | MATHS |
| Chapter | PROBABILITY |
| NAGEEN PRAKASHAN | Problems From NCERT/exemplar |
| Number Of Questions | 7 |
| Academic Year | 2023-24 |
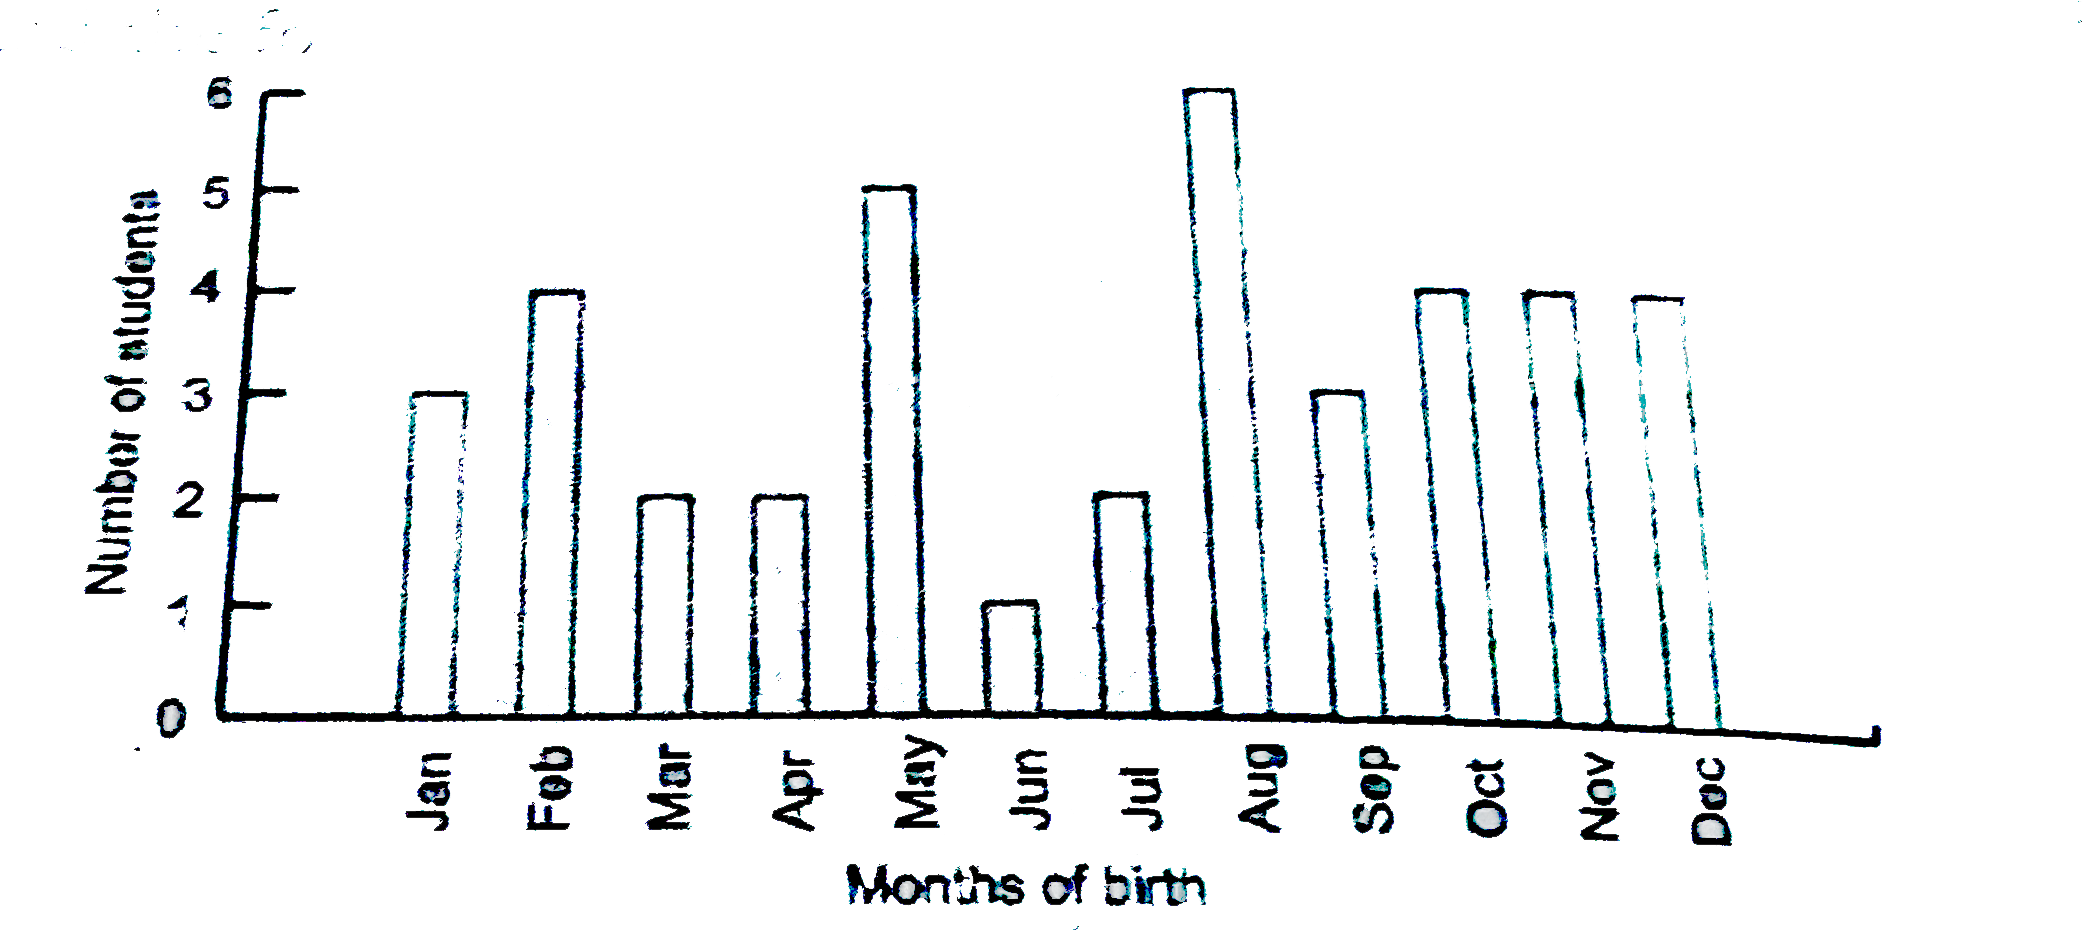
In a particular section of class IX, 40 students were asked about the month of their birth and the following graph was prepared for the data so obtained.

Find the probability that a student of the class was born in August.
View SolutionThree coins are tossed simultaneously 200 times with the following frequencies of different outcomes.
`|{:("Outcome","3 heads","2 heads","1 head","No head"),("Frequency"," 23"," 72"," 77"," 28"):}|`
If the three coins are simultaneously tossed again, compute the probability of 2 heads coming up.
View SolutionAn organisation selected 2400 families at random and surveyed them to determine relationship between income level and the number of vechicles in a family. The information gathered is listed in the table below:

Suppose a family is chosen. Find the probability that the family chosen is :
(i) earning Rs. 10000-13000 per month and owning exactly 2 vehicles.
(ii) earning Rs. 16000 or more per month and owning exactly 1 vehicle.
(iii) earning less than Rs. 7000 per month and does not own any vehicle.
(iv) earning Rs. 13000-16000 per month and owning more than 2 vehicles.
(v) owning not more than 1 vehicle.
View SolutionA teacher wanted to analysis the performance of two sections of students in a mathematics test of 100 marks. Looking performance, she found that a few students got under 20 marks and a few got 70 marks or above. So she decided to group them into intervals of varying sizes as follows :
0-20, 20-30, ....., 60-70, 70-100. Then she formed the following table :
`|{:("Marks"," Number of students"),(0-20," 7"),(20-30," 10"),(30-40," 10"),(40-50," 20"),(50-60," 20"),(60-70," 15"),(70-"above"," 8"),("Total"," 90"):}|`
(i) Find the probability that a student obtained less than `20%` in the mathematics test.
(ii) Find the probability that a student obtained marks 60 or above .
View SolutionA study was conduced to find out the concentration of sulphur dioxide in the air in parts per million (ppm) of a certain city. The data obtained for 30 days is as follow:
`{:("0.03 0.08 0.08 0.09 0.04 0.17"),("0.16 0.05 0.02 0.06 0.18 0.20"),("0.11 0.08 0.12 0.13 0.22 0.07"),("0.08 0.01 0.10 0.06 0.09 0.18"),("0.11 0.07 0.05 0.07 0.01 0.04"):}`
You were asked to prepare a frequency distribution table, regarding the concentration of sulphur dioxide in the air in parts per million of a certain city for 30 days. Using this table, find the probability of the concentration of sulphur dioxide in the interval 0.12-0.16 on any of these days.
View SolutionBulbs are packed in cartons each containing 40 bulbs. Seven hundred cartons were examined for defective bulbs and the results are given in the following table :
`{:("Number of defective bulbs"," 0 1 2 3 4 5 6 More than 6"),("Frequency","400 180 48 41 18 8 3" " 2"):}`
One carton was selected at random. What is the probaility that it has
(i) no defective bulbs ?
(ii) defective buble from 2 to 6 ?
(iii) defective bulbs less than 4 ?
View SolutionOver the past 200 working days, the number of defective parts produced by a machine is given in the following table :
`|{:("Number of","0 1 2 3 4 5 6 7 8 9 10 11 12 13"),("defective parts",),("Days","50 32 22 18 12 12 10 10 10 8 6 6 2 2"):}|`
Determine the probability that tomorrow's output will have :
(i) no defective part.
(ii) at least one defective part,
(iii) not more than 5 defective parts,
(iv) more than 13 defective parts.
View Solution
Problems From NCERT/exemplar questions and complete solutions for chapter PROBABILITY of NAGEEN MATHS (HINGLISH) of Class 9