Complete Solutions to EXAMPLE of chapter STATISTICS of Class 9 book with complete answers and questions
| Class 9 | MATHS |
| Chapter | STATISTICS |
| PSEB | EXAMPLE |
| Number Of Questions | 10 |
| Academic Year | 2023-24 |
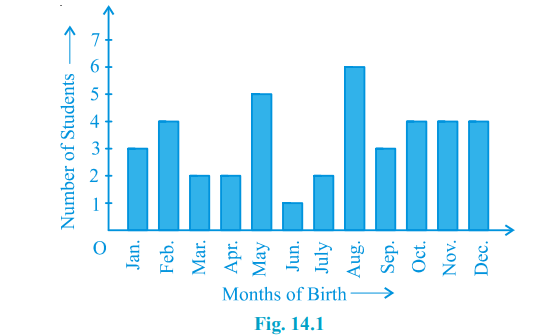
In a particular section of Class IX, 40 students were asked about the months of their birth and the following graph was prepared for the data so obtained:
 Observe the bar graph given above and answer the following questions:
(i) How many students were born in the month of November?
(ii) In which month were the maximum number of students born?
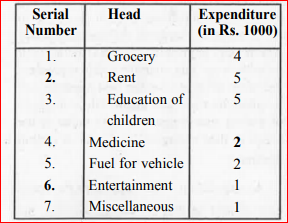
View SolutionA family with monthly income of Rs. 20,000 had planned the following expenditures under various heads :
 Draw a bar graph for the above data.
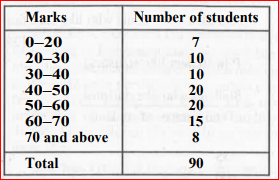
View SolutionA teacher analyses the performance of two sections of students in a mathematics test of 100 marks given in the following table :
 : Find the probability that a student obtained less than 20% in the mathematics test.
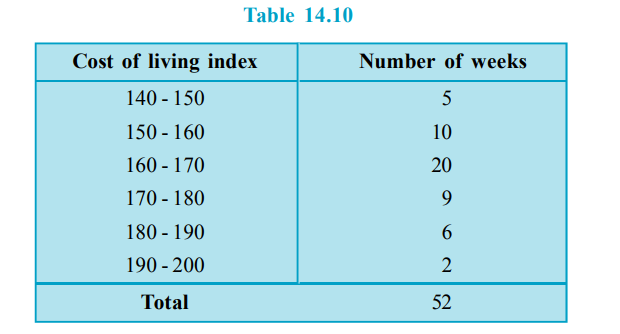
View SolutionIn a city, the weekly observations made in a study on the cost of living index are given in the following table:
 Draw a frequency polygon for the data above (without constructing a histogram).
View Solution5 people were asked about the time in a week they spend in doing social work in their community. They said 10, 7, 13, 20 and 15 hours, respectively. Find the mean (or average) time in a week devoted by them for social work.
View SolutionConsider the marks obtained (out of 100 marks) by 30 students of Class IX of a school:
 Find the mean of the marks obtained by 30 students of Class IX of a school.
View SolutionThe heights (in cm) of 7 students of a class are as follows:162, 164, 173, 170, 166,168, 167 Find the median of this data.
View SolutionThe points scored by a Kabaddi team in a series of matches are as follows: 17, 2, 7, 27, 15, 5, 14, 8, 10, 24, 48, 10, 8, 7, 18, 28 Find the median of the points scored by the team.
View SolutionFind the mode of the following marks (out of 10) obtained by 20 students: 4, 6, 5, 9, 3, 2, 7, 7, 6, 5, 4, 9, 10, 10, 3, 4, 7, 6, 9, 9
View SolutionConsider a small unit of a factory where there are 5 employees : a supervisor and four labourers. The labourers draw a salary of ₹5,000 per month each while the supervisor gets ₹ 15,000 per month. Calculate the mean, median and mode of the salaries of this unit of the factory.
View Solution
EXAMPLE questions and complete solutions for chapter STATISTICS of PSEB of Class 9