Complete Solutions to EXERCISE of chapter STATISTICS of Class 9 book with complete answers and questions
| Class 9 | MATHS |
| Chapter | STATISTICS |
| VGS PUBLICATION-BRILLIANT | EXERCISE |
| Number Of Questions | 92 |
| Academic Year | 2023-24 |
Which of the following are primaryt and secondary data ?
(i) Collection of the data about enrollment of students in your school for a period from 2001 to 2010.
(ii) Height of students in your class recorded by physical education teacher.02:21View SolutionWhich of the following are primary and secondary data? Height of students in your class recorded by physical education teacher.
03:17View SolutionConsider the marks obtained by 50 students in a mathematics test for a total marks of 10. 5,8,6,4,2, 5,4,9,10,2, 1,1,3,4,5, 8,6,7,10,2, 1,1,3,4,4, 5,8,6,7,10, 2,8,6,4,2, 5,4,9,10,2, 1,1,3,4,5, 8,6,4,5,8
05:03View SolutionThe weight (in grams) of 50 oranges, picked at random from a basket of oranges are given below: 35, 45, 55, 50, 30, 110, 95, 40, 70, 100, 60, 80, 85, 60, 52, 95, 98, 35, 47, 45, 105, 90, 30, 50, 75, 95, 85, 80, 35, 45, 40, 50, 60, 65, 55, 45, 30, 90, 115, 65, 60, 40, 100, 55, 75, 110, 85, 95, 55, 50.construct a grouped frequency distribution table
07:26View SolutionThe relative humidity (in %) of a certain City for a September month of 30 days was as follows:

(i) Construct a grouped frequency distribution table with classes 84-86, 86,-88 etc.
(ii) What is the range of the data?06:49View SolutionThe relative humidity (in %) of a certain City for a September month of 30 days was as follows:

(i) Construct a grouped frequency distribution table with classes 84-86, 86,-88 etc.
(ii) What is the range of the data?06:49View SolutionThe blood groups of 36 students of IX class are record as follows. A, O, A, O, A, B, O, A, B, A, B, O, B, O B, O, O, A, B, O, B, AB, O, A, O, O, O, A, AB, O, A, B, O, A, O, B. Represent the data in the form of a frequency distribution table. Which is most common and which is the rarest blood group among these groups?
03:01View SolutionThree coins are tossed 30 times simultaneously. Each time the number of heads occurring was noted down as follows:

Prepare a frequency distribution table for the data given above.02:24View SolutionA TV channel or organised SMS (Short Message Service) poll on prohibition on smoking giving options like A- complete prohibition, B- prohibited in public places only, C- not necessary, SMS results in one hour were
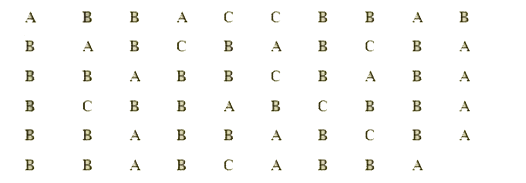
Represent the amount of data is grouped frequency distribution table. How many appropriate answers were received? What was the majority of peoples' opinion?04:09View SolutionIdentify the scale used on the axes of the adjacent graph. Write the frequency distribution from it.
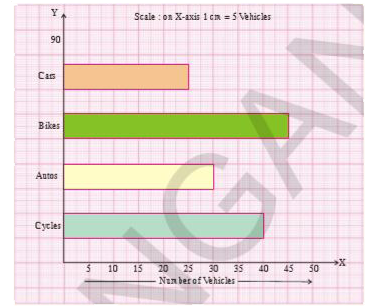 03:04View Solution
The marks 30 students of a class, obtained in a test (out of 75) , are given below : 42, 21, 50, 37, 42, 37, 38, 42, 49, 52, 38, 53, 57, 47, 29, 59, 61, 33, 17, 17, 39, 44, 42 39, 14, 7, 27, 19, 54, 51. From a frequency table with equal class intervals.(Hint : one of them being 0-10)
05:01View SolutionThe electricity bills (in rupees) of 25 houses in a locality are given below. Construct a grouped frequency distribution table with a class size of 75.
170, 212, 252, 225, 310, 712, 412, 425, 322, 325, 192, 198, 230, 320, 412,
530, 602, 724, 370, 402, 317, 403, 405, 372, 41306:39View SolutionA company manufactures car batteries of particular type. The life (in years) of 40 batteries was recorded as follows:
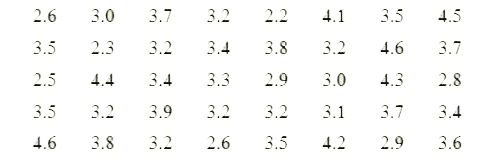
Construct a grouped frequency distribution table with exclusive classes for this data, using class intervals of size 0.5 starting from the interval 2-2.5.06:25View SolutionGive 3 situations, where mean, median and mode are separately appropriate and counted.
03:45View SolutionRain fall of a place in the week is 4 cm, 5 cm, 12cm, 3cm, 6cm, 8cm, 0.5cm. Find the average rainfall per day.
01:42View SolutionIf the mean of 10, 12, 18, 13, P and 17 is 15, find the value of P.
01:10View SolutionIf the mean of the following data is 7.5 , then find the value of ‘A’ .
 05:47View Solution
Find the median of the scores 75, 21, 56 , 36 , 81 , 05, 42
01:33View SolutionMedian of a data, arranged in ascending order 7, 10, 15, x, y, 27, 30 is 17 and when one more observation 50 is added to the data, the median has become 18. Find x and y.
06:53View SolutionIn finding the median, the given data must be written in order. Why ?
02:05View SolutionThe following numbers are the sizes of shoes sold by a shop in a particular day. Find the mode.
6, 7, 8, 9, 10, 6, 7, 10, 7, 6, 7, 9, 7, 601:53View SolutionClassify your class mates according to their heights and find the mode of it.
02:57View SolutionIf shopkeeper has to place an order for shoes, which number shoes should he order more?
02:11View SolutionTest scores out of 100 for a class of 20 students are as follows:
93, 84, 97, 98, 100, 78, 86, 100, 85, 92, 55, 91, 90, 75, 94, 93, 60, 81, 95
(a) Make a frequency table taking class interval as 91-100, 81-90, ...
(b) Find the modal class (The "Modal class" is the class containing the greatest frequency).
(c) find the interval that contains the median.05:46View SolutionTest scores out of 100 for a class of 20 students are as follows:
93, 84, 97, 98, 100, 78, 86, 100, 85, 92, 55, 91, 90, 75, 94, 93, 60, 81, 95
(a) Make a frequency table taking class interval as 91-100, 81-90, ...
(b) Find the modal class (The "Modal class" is the class containing the greatest frequency).
(c) find the interval that contains the median.05:46View SolutionWeights of parcels in a transport office are given below. Find the mean weight of the parcels.
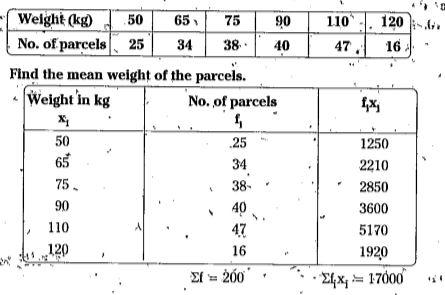 02:46View Solution
AFLATOUN social and financial educational programme initiated savings programme among the high school children in Hyderabad district. Mandal wise savings in a month are given in the following table. Find arithmetic mean of school wise savings in each mandal. Also find the arithmetic mean of saving of all schools.
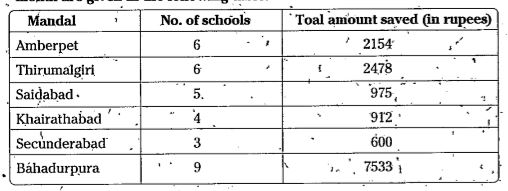 05:55View Solution
The mean (average) weight of three students is 40 kg. One of the students Ranga weighs 46 kg. The other two students, Rahim and Reshma have the same weight. Find Rahims weight.
02:22View SolutionThere are four unknown numbers. The mean of the first two numbers is 4 and the mean of the first three is 9. The mean of all four numbers is 15, if one of the four numbers is 2 find the other numbers.
04:43View SolutionName three measures of central tendency.
05:13View SolutionWhat is a measure of central tendency?
02:24View SolutionDefine mean.
02:12View SolutionRain fall of a place in the week is 4 cm, 5 cm, 12cm, 3cm, 6cm, 8cm, 0.5cm. Find the average rainfall per day.
01:42View SolutionIf the mean of 17, 10, 12, p and 13 is 14, find the value of P.
02:52View SolutionDefine median
01:21View SolutionFind the median values 30, 13, 19, 25, 21, 9 and 35.
01:55View SolutionFind the median of the values 20, 6, 15, 8, 14, 12.
02:49View SolutionDefine mode.
01:34View SolutionMean `barx=A+(sumf_id_i)/(sumf_i)` .Find `barx` if A=29.5 `sumf_id_i= -15` and `sumf_i=25` .
02:40View SolutionGiven that `barx=(sumf_ix_i)/(sumf_i)` .Find `sumf_i` if `barx =14` and `sumf_ix_i=420`
02:12View SolutionGiven that `barx=(sumf_ix_i)/(sumf_i)` . Calculate `barx` if `sumf_ix_i=760` and `sumf_i =50`
01:56View SolutionWhat happens to "Mean" if 3 is added to each data value ? What about median and mode ?
02:29View SolutionWhat will happen to the measures of central tendency if we multiply each data value by the same amount ?
02:06View SolutionWhat will happen to the mean, mode and median if each data value is multiplied by 2?
03:37View SolutionWrite the mark wise frequencies in the following frequency distribution table.
 02:44View Solution
Explain inclusive classes and exclusive classes.
04:43View SolutionWrite the class boundaries of the following classes : 25-29, 30-34, 35-39, 40-44, 45-49, 50 - 54
04:29View SolutionWhat is the lower limit of a class ? What is the upper limit of a class ? How do you calculate the boundaries of classes?
03:08View SolutionWrite the formula for finding mean of ungrouped frequency distribution and explain its terms.
01:41View SolutionFind the median marks in the data.
 03:44View Solution
There are 40 students in a class. Their average mark in English is 55. The mean of 10 girl students is 58. Find the mean of the boy students in the class.
06:11View SolutionInformation collected in the form of facts, numerical figures, tables etc.is called
02:12View SolutionData collected from a source like registers is called
02:18View SolutionRange of the data "18, 24, 15, 17, 33, 16, 29, 45, 12, 3, 33, 21" is
01:31View Solution0- 10, 11- 20, 21 - 30, 31 -40. The real lower limit of the class 21 - 30 is
01:36View SolutionIn the above problem `a_5`=…
01:23View SolutionThe temperatures of a city recorded during a week are `42^@ , 35^@ , 44^@ , 33^@ , 39^@ , 45^@` and `42^@`The average temperature is
01:47View SolutionIn a deviation problem `sumf_id_i=-12` and A=15, `sumf=20`, then `barx`=
02:08View SolutionMedian of 3, 7, 4, 6 and 12 is
01:57View SolutionMedian of the data 5, 8, 9, x, 11, 13 is 9.5 (given that data is arranged in ascending order) then x is
02:23View SolutionFormula to find mean for a grouped data is
01:53View SolutionMode of the data 3, 7, 8, 8, 7, 6, 8, 4, 3, 11 is
01:35View SolutionMean of the data `x_1 , x_2 , x_3 , x_4 , x_5` is 15. If each observation is multiplied 3, then the mean becomes
02:22View SolutionIf the mean of the data 12, 8, 6, 3, 9 is 7.6. If 5 is added to each observation, then the new mean is
03:28View SolutionMean of the data 8, 7, 6, 14, 12, 10, 20, 16, 15 and 14 is 12.2. If each observation is multiplied by 2 and then 3 is added, the new mean is
04:05View SolutionThe median of n observations arranged in ascending order when n is even
02:19View SolutionA data having two modes is
02:33View SolutionThe mode of the data 8, 5, 3, 8, 3, 6, 5, 3, 7, 5 and 11 is
02:15View SolutionThe difference between any two lower limits is called
02:41View SolutionThe mean of the observations x-1, x and x + 1 is
01:54View SolutionThe median of first 10 natural numbers is
01:49View Solution30-39, 40-49, 50-59 .. తరగతులు .. రకపు తరగతులు .
01:34View SolutionThe mode of the distribution 2, 5, 7, 5, 3, 1, 5, 8, 7, 5 is
01:40View SolutionThe median of the observations 15, 12, 14,20,16,10 is
03:18View SolutionMid values are used to calculate ..........
06:53View SolutionWhich of the following is not a measure of central tendency ?
06:02View SolutionThe mode of the observations 8, 9, 10, 11, 12, 8, 9, 12, 9, 8, 9, 11, 9, 8 is
01:55View SolutionThe median of the observations 6, 21, 9, 19, 15 and 13 is
02:14View SolutionThe lower limit of the class 60 - 69 is
01:58View SolutionThe upper limit of the class 30-40 is
01:46View SolutionThe mean of first ten odd natural numbers is
02:09View SolutionThe width of the class interval 40-50 is
01:27View SolutionThe value of among the observation of which occurs most frequently is called
02:55View SolutionIf three students with marks 26, 27 and 28 were joined, which class frequency
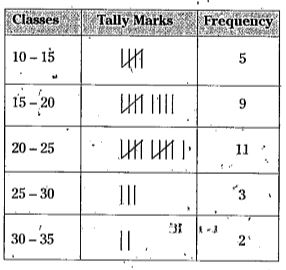 01:53View Solution
While drawing a bar graph, which class bar is the smallest in it's length?
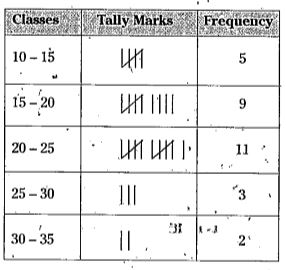 01:28View Solution
In an ungrouped data there are 10 scores. After arranging them which term is the median ?
02:38View SolutionIn an ungrouped data there are 10 scores. After arranging them which term is the median ?
02:38View SolutionTo find mean weight of 3 types of vegetables with are 4 kg, 6 kg, 8 kg, Usha and Laxmi do like these : Usha : Weight given = 4 kg, 6 kg, 8 kg Mean weight = `barx = 3/18=1/6 kg` Laxmi : When given = 4kg, 6kg, 8kg Mean weight =`barx = (4xx6xx8)/3 = 64 kg` . From The above information.
02:33View SolutionA paper is folded several times. When it was opened it was observed that it contained 22 triangles and 22 quadrilaterals and 12 pentagons. From the above mode is
02:42View SolutionMeans of first 10 whole numbers and first 10 natural numbers is in the ratio of
03:51View Solution`barx=A+(sumf_i d_i)/(sumf_i)` is the formula to find mean for an ungrouped data. In this formula letter A represents for
01:47View Solution
EXERCISE questions and complete solutions for chapter STATISTICS of VGS PUBLICATION-BRILLIANT of Class 9
