MARCK EACH from NAVBODH MATHS Chapter 21 STATISTICS for Class 10
| Class 10 | MATHS |
| Chapter | STATISTICS |
| NAVBODH MATHS | MARCK EACH |
| Medium | English |
| Academic Year | 2023-2024 |
Question 17
Observe the following frequency polygon and answer following questions :
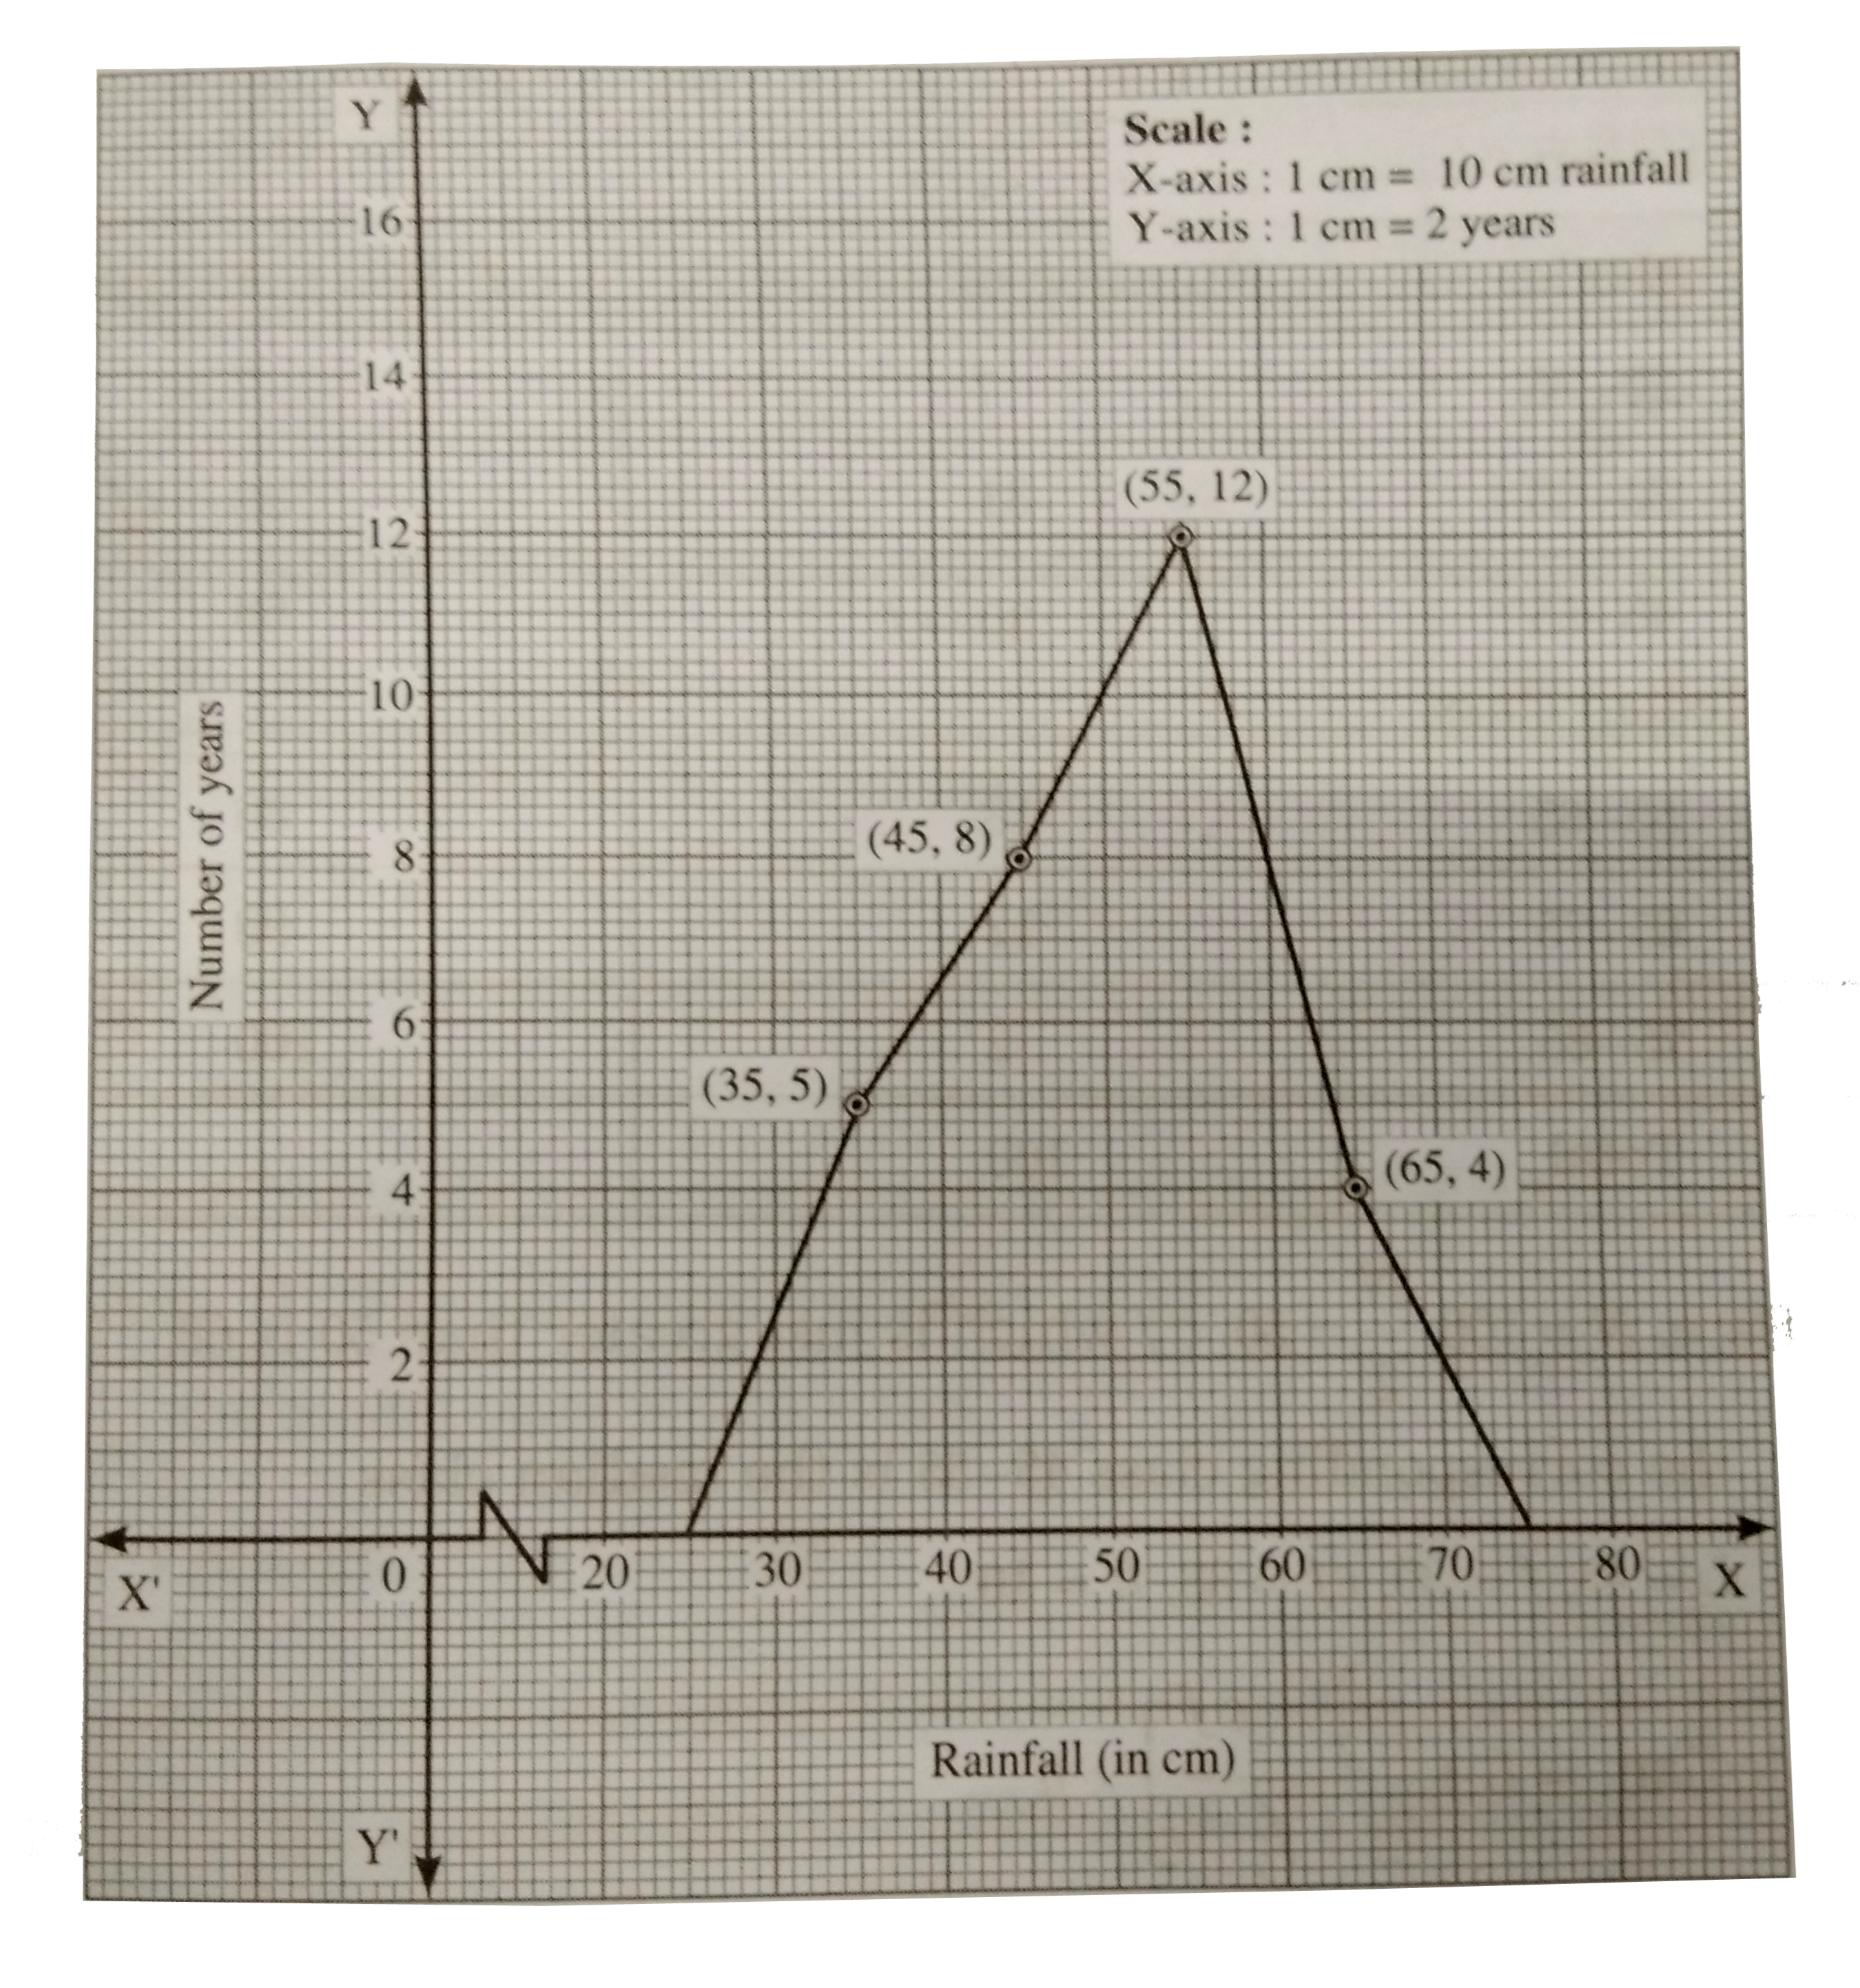
(1) For how many years was the rainfall maximum?
(2) For how many years was the rainfall minimum?
(3) What was the rainfall for 12 years?
(4) For how many years was the rainfall 35 cm?
(5) What is the difference between the maximum and minimum rainfall?
(6) Which classes have frequency zero?View SolutionQuestion 21
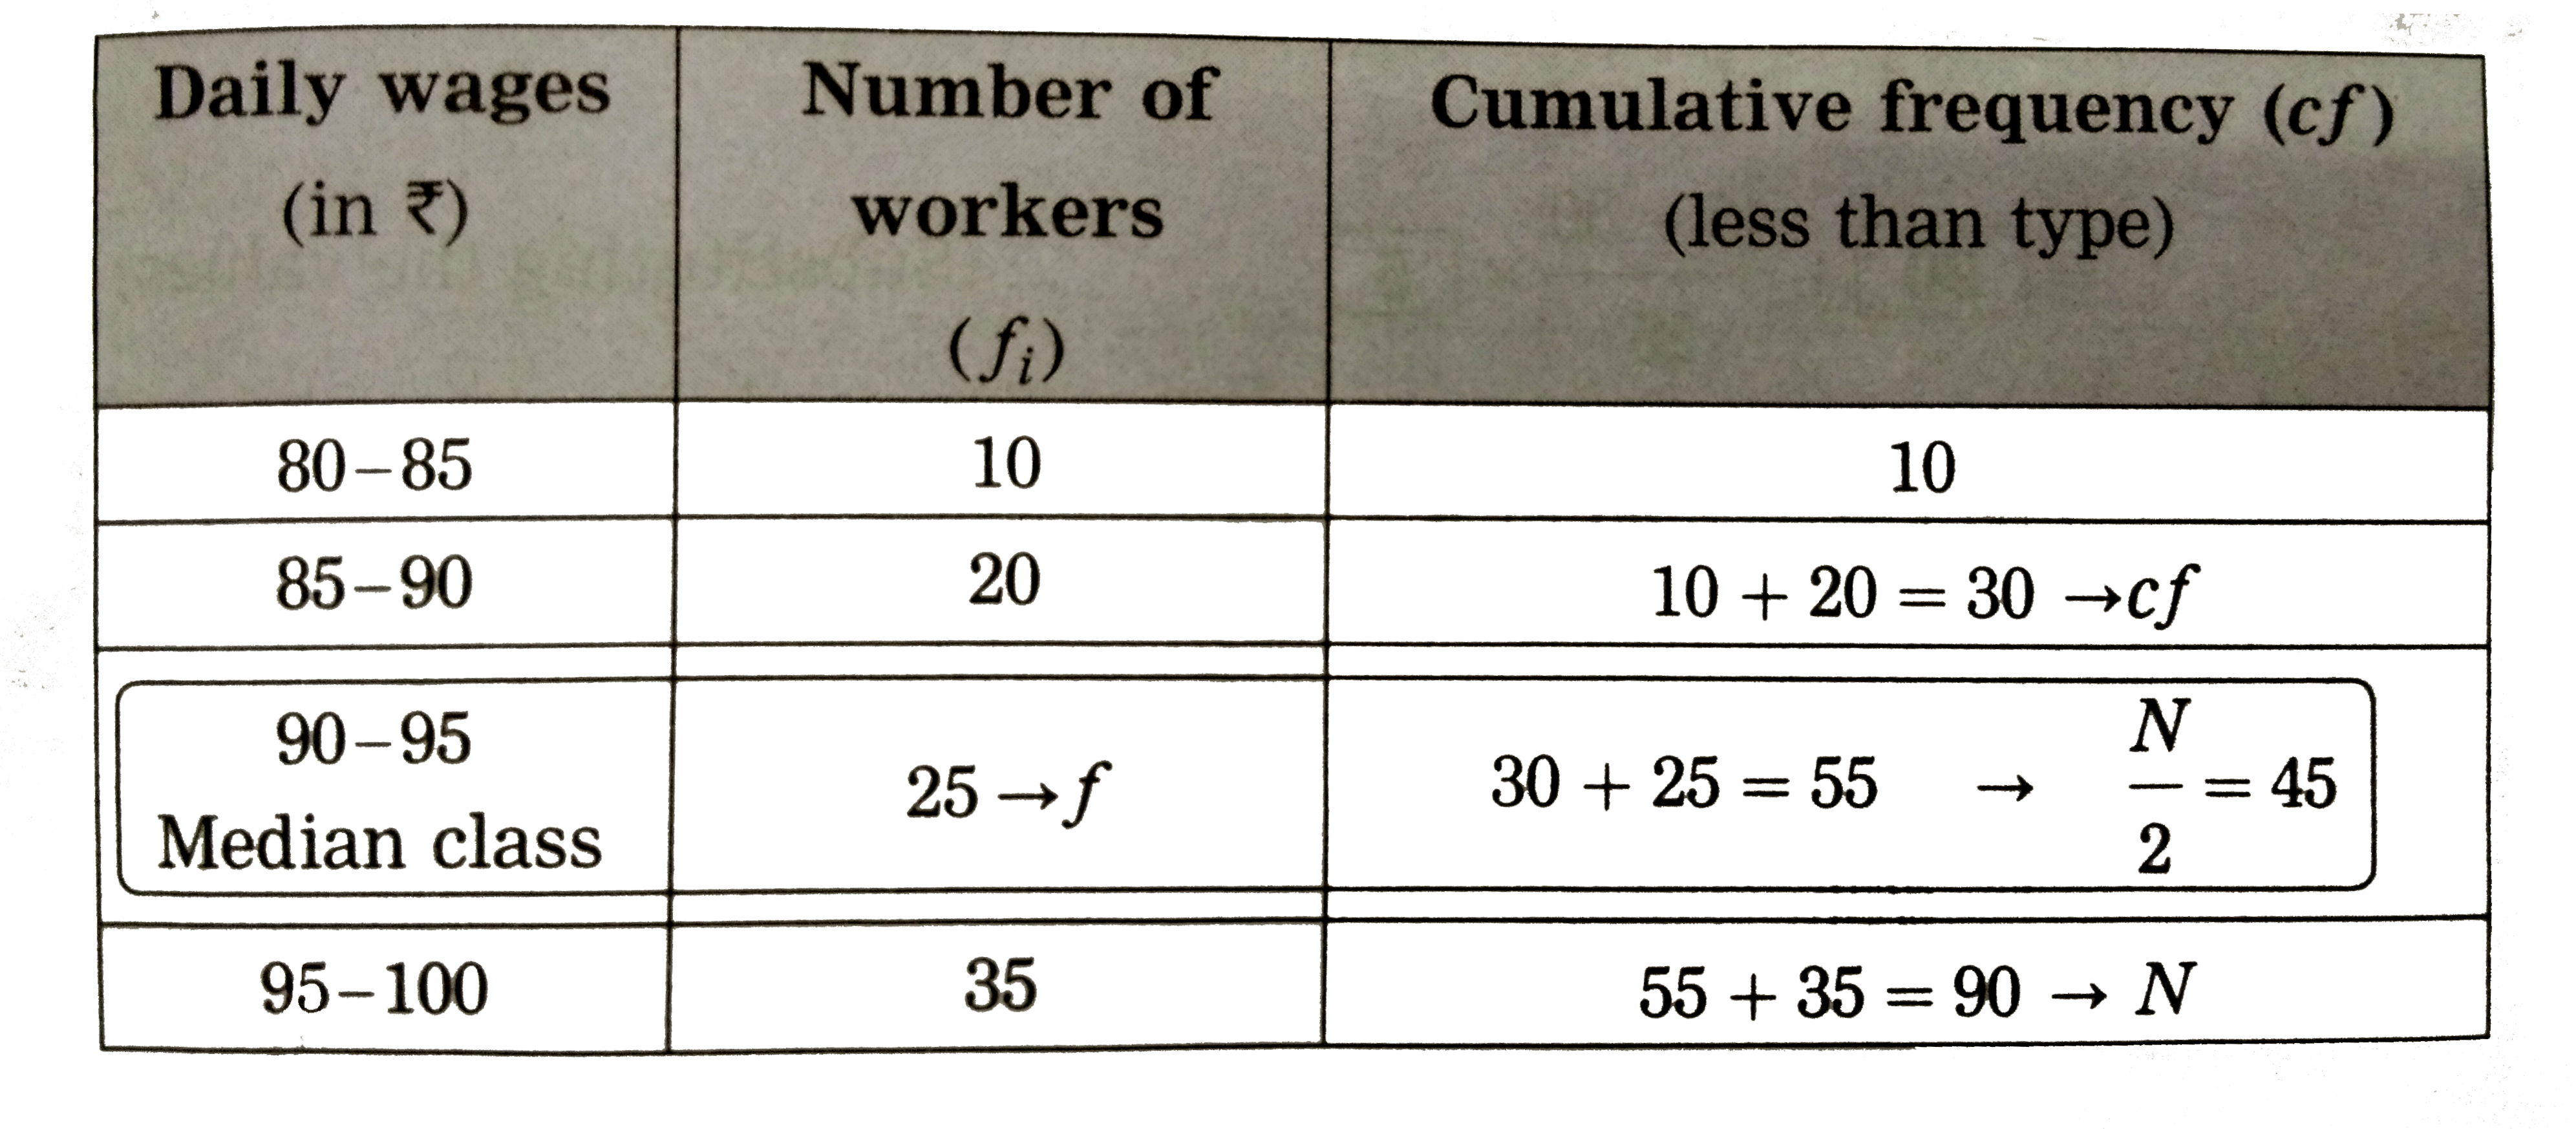
The following frequency distribution table shows the number of mango trees in a grove, their yield of mangoes and also the cumulative frequency. Complete the following activity to find the median of the data.
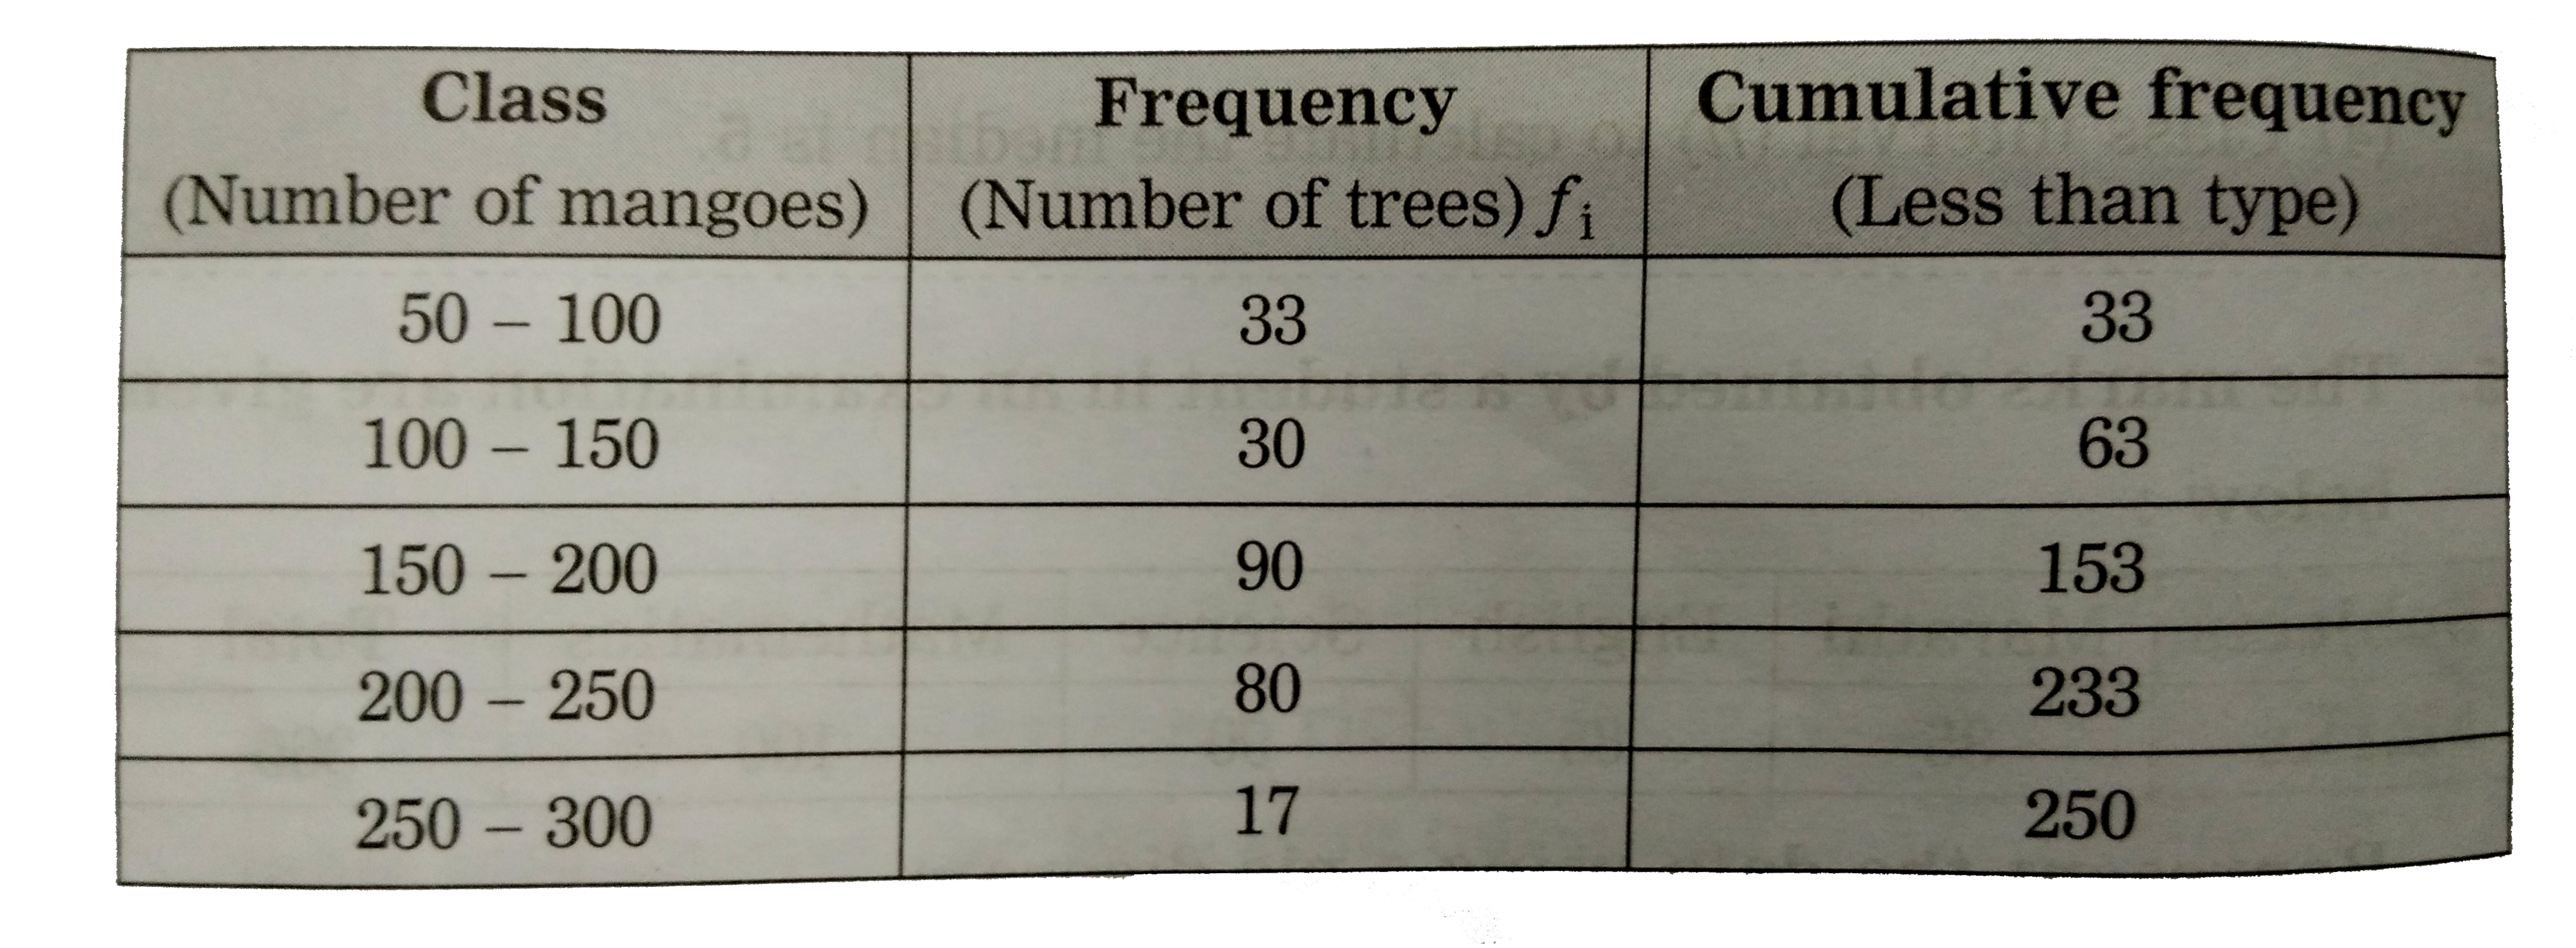
Here, total of frequencies N=250.
N2=2502=125
The cumulative frequency which is just greater than 125 is □
∴ the corresponding class □ is the median class.
L=150,f=90,cf=□,h=50
Median =L+[□f]×h
=150+[□90]×50
=150+□90×50≈184.4
The median of the data is 184.4 mangoes.View SolutionQuestion 23
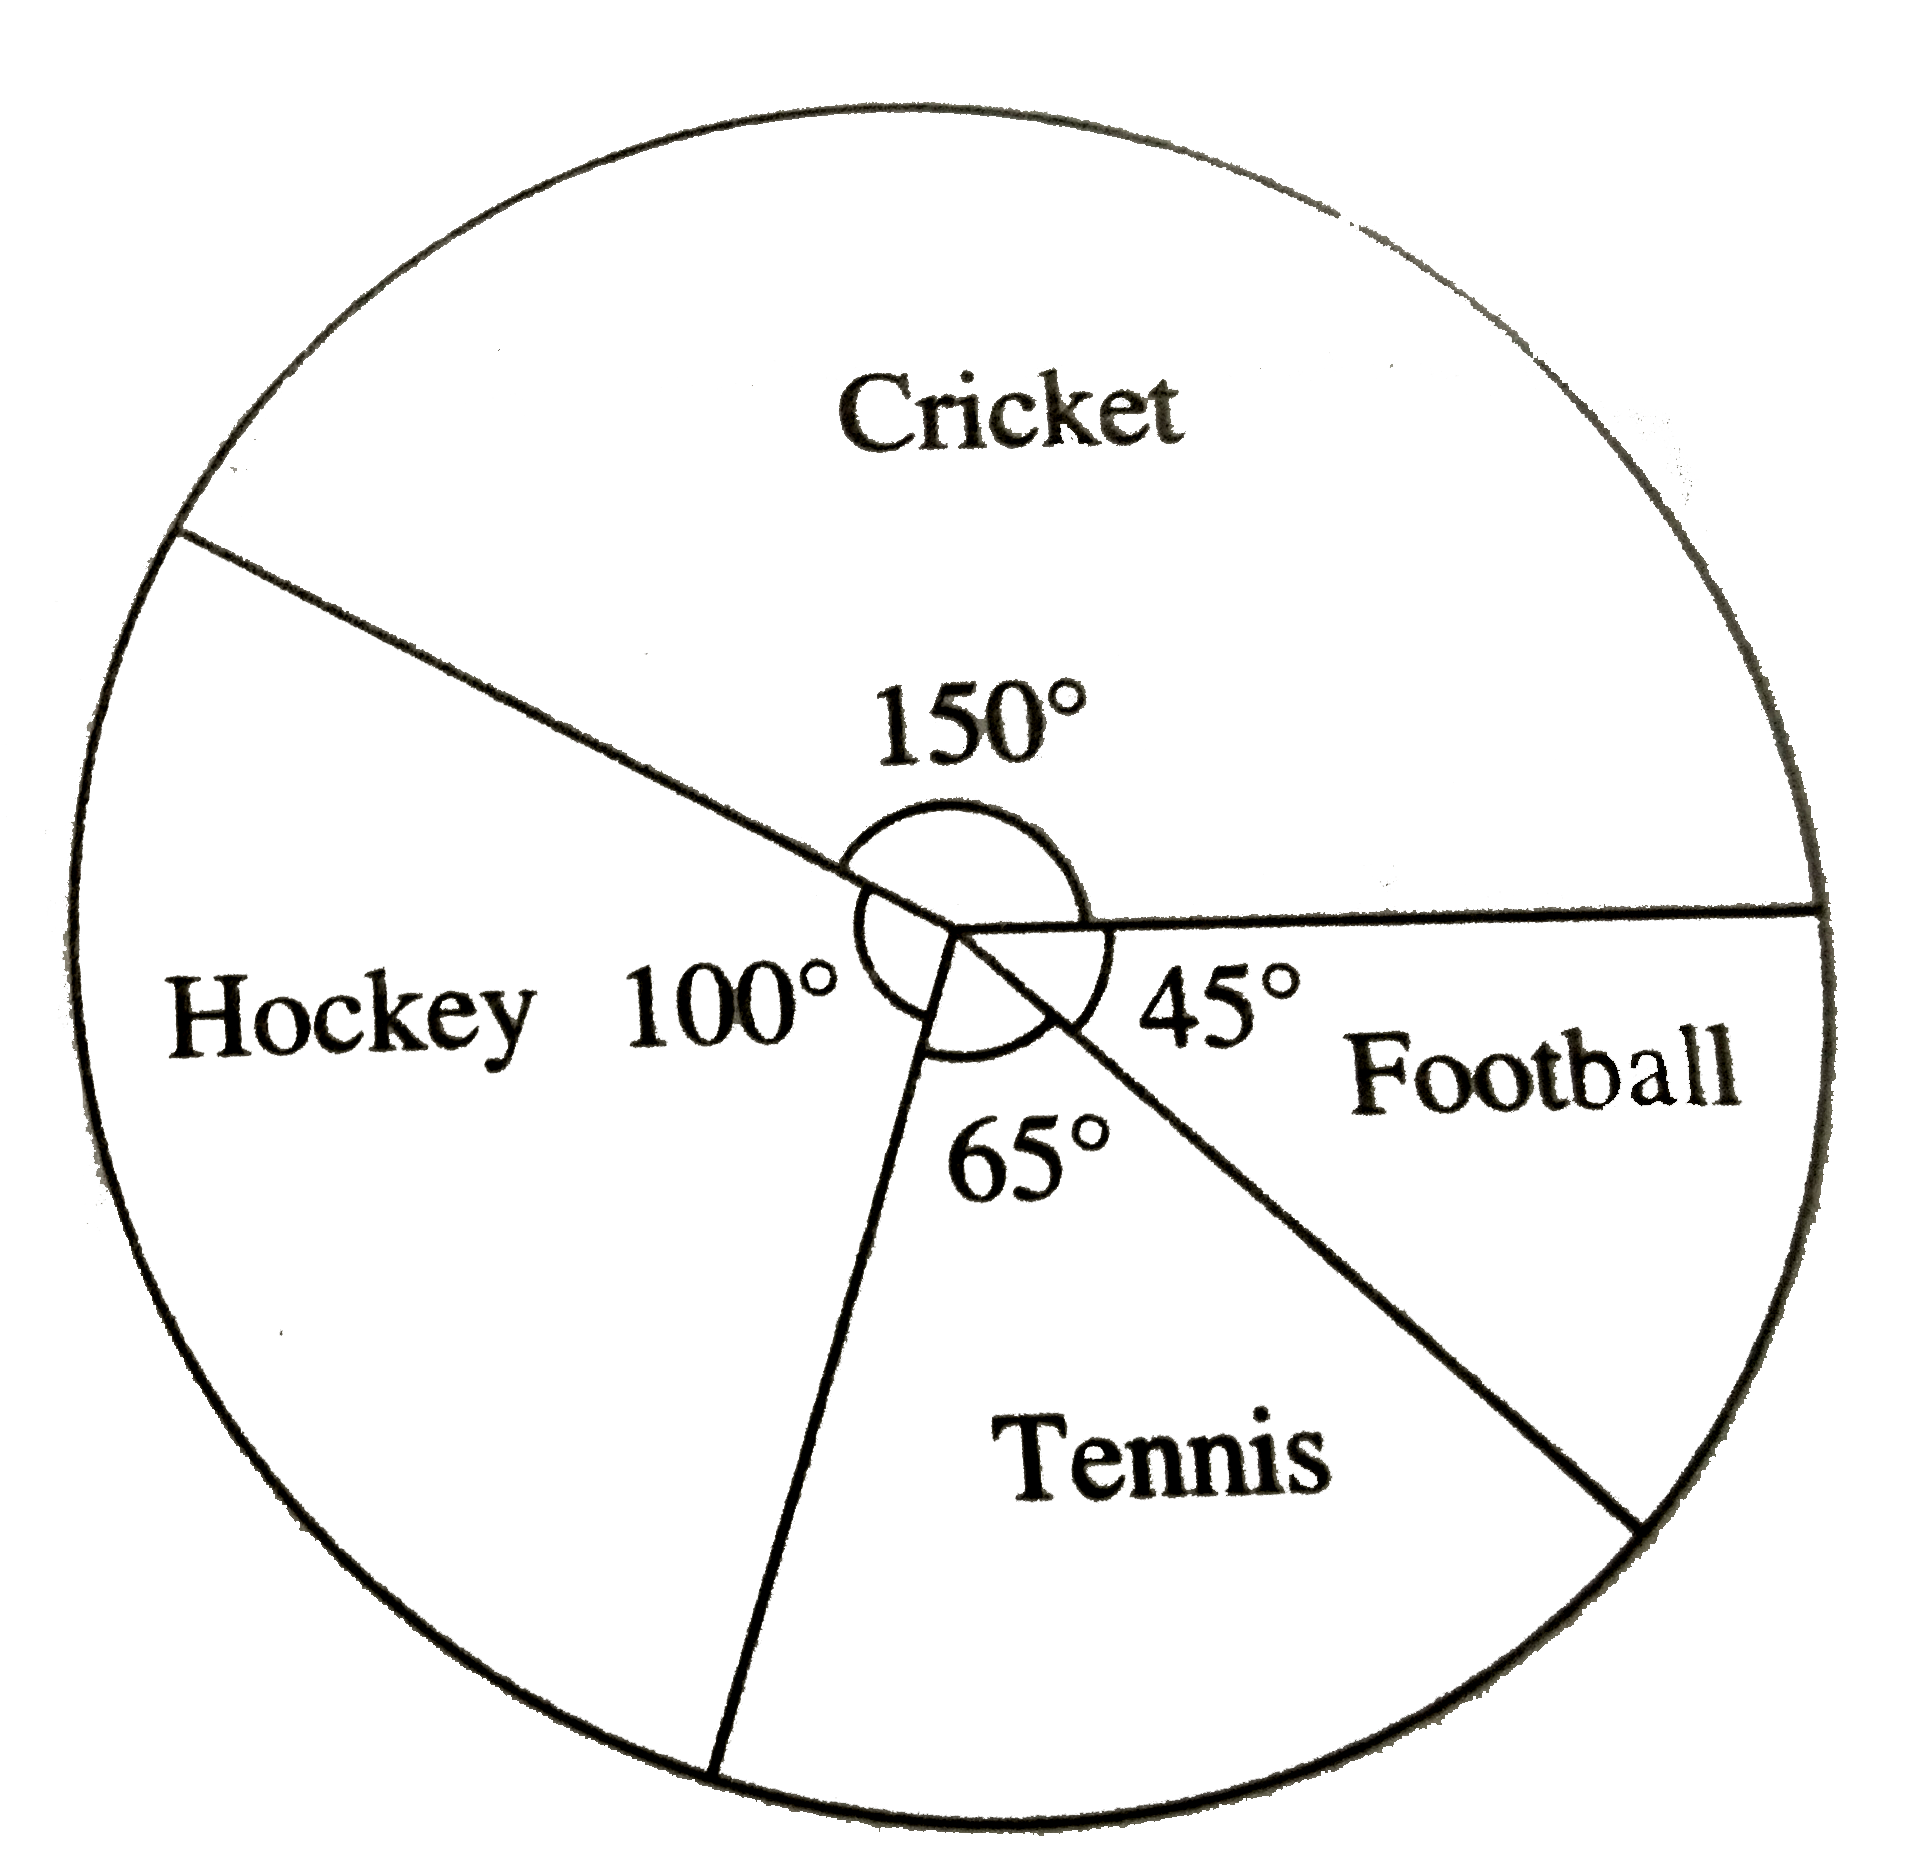
The pie diagram shows the sources of funds for the construction of 'National Highway X' project. The found received through bonds is RS 11,200 crores.
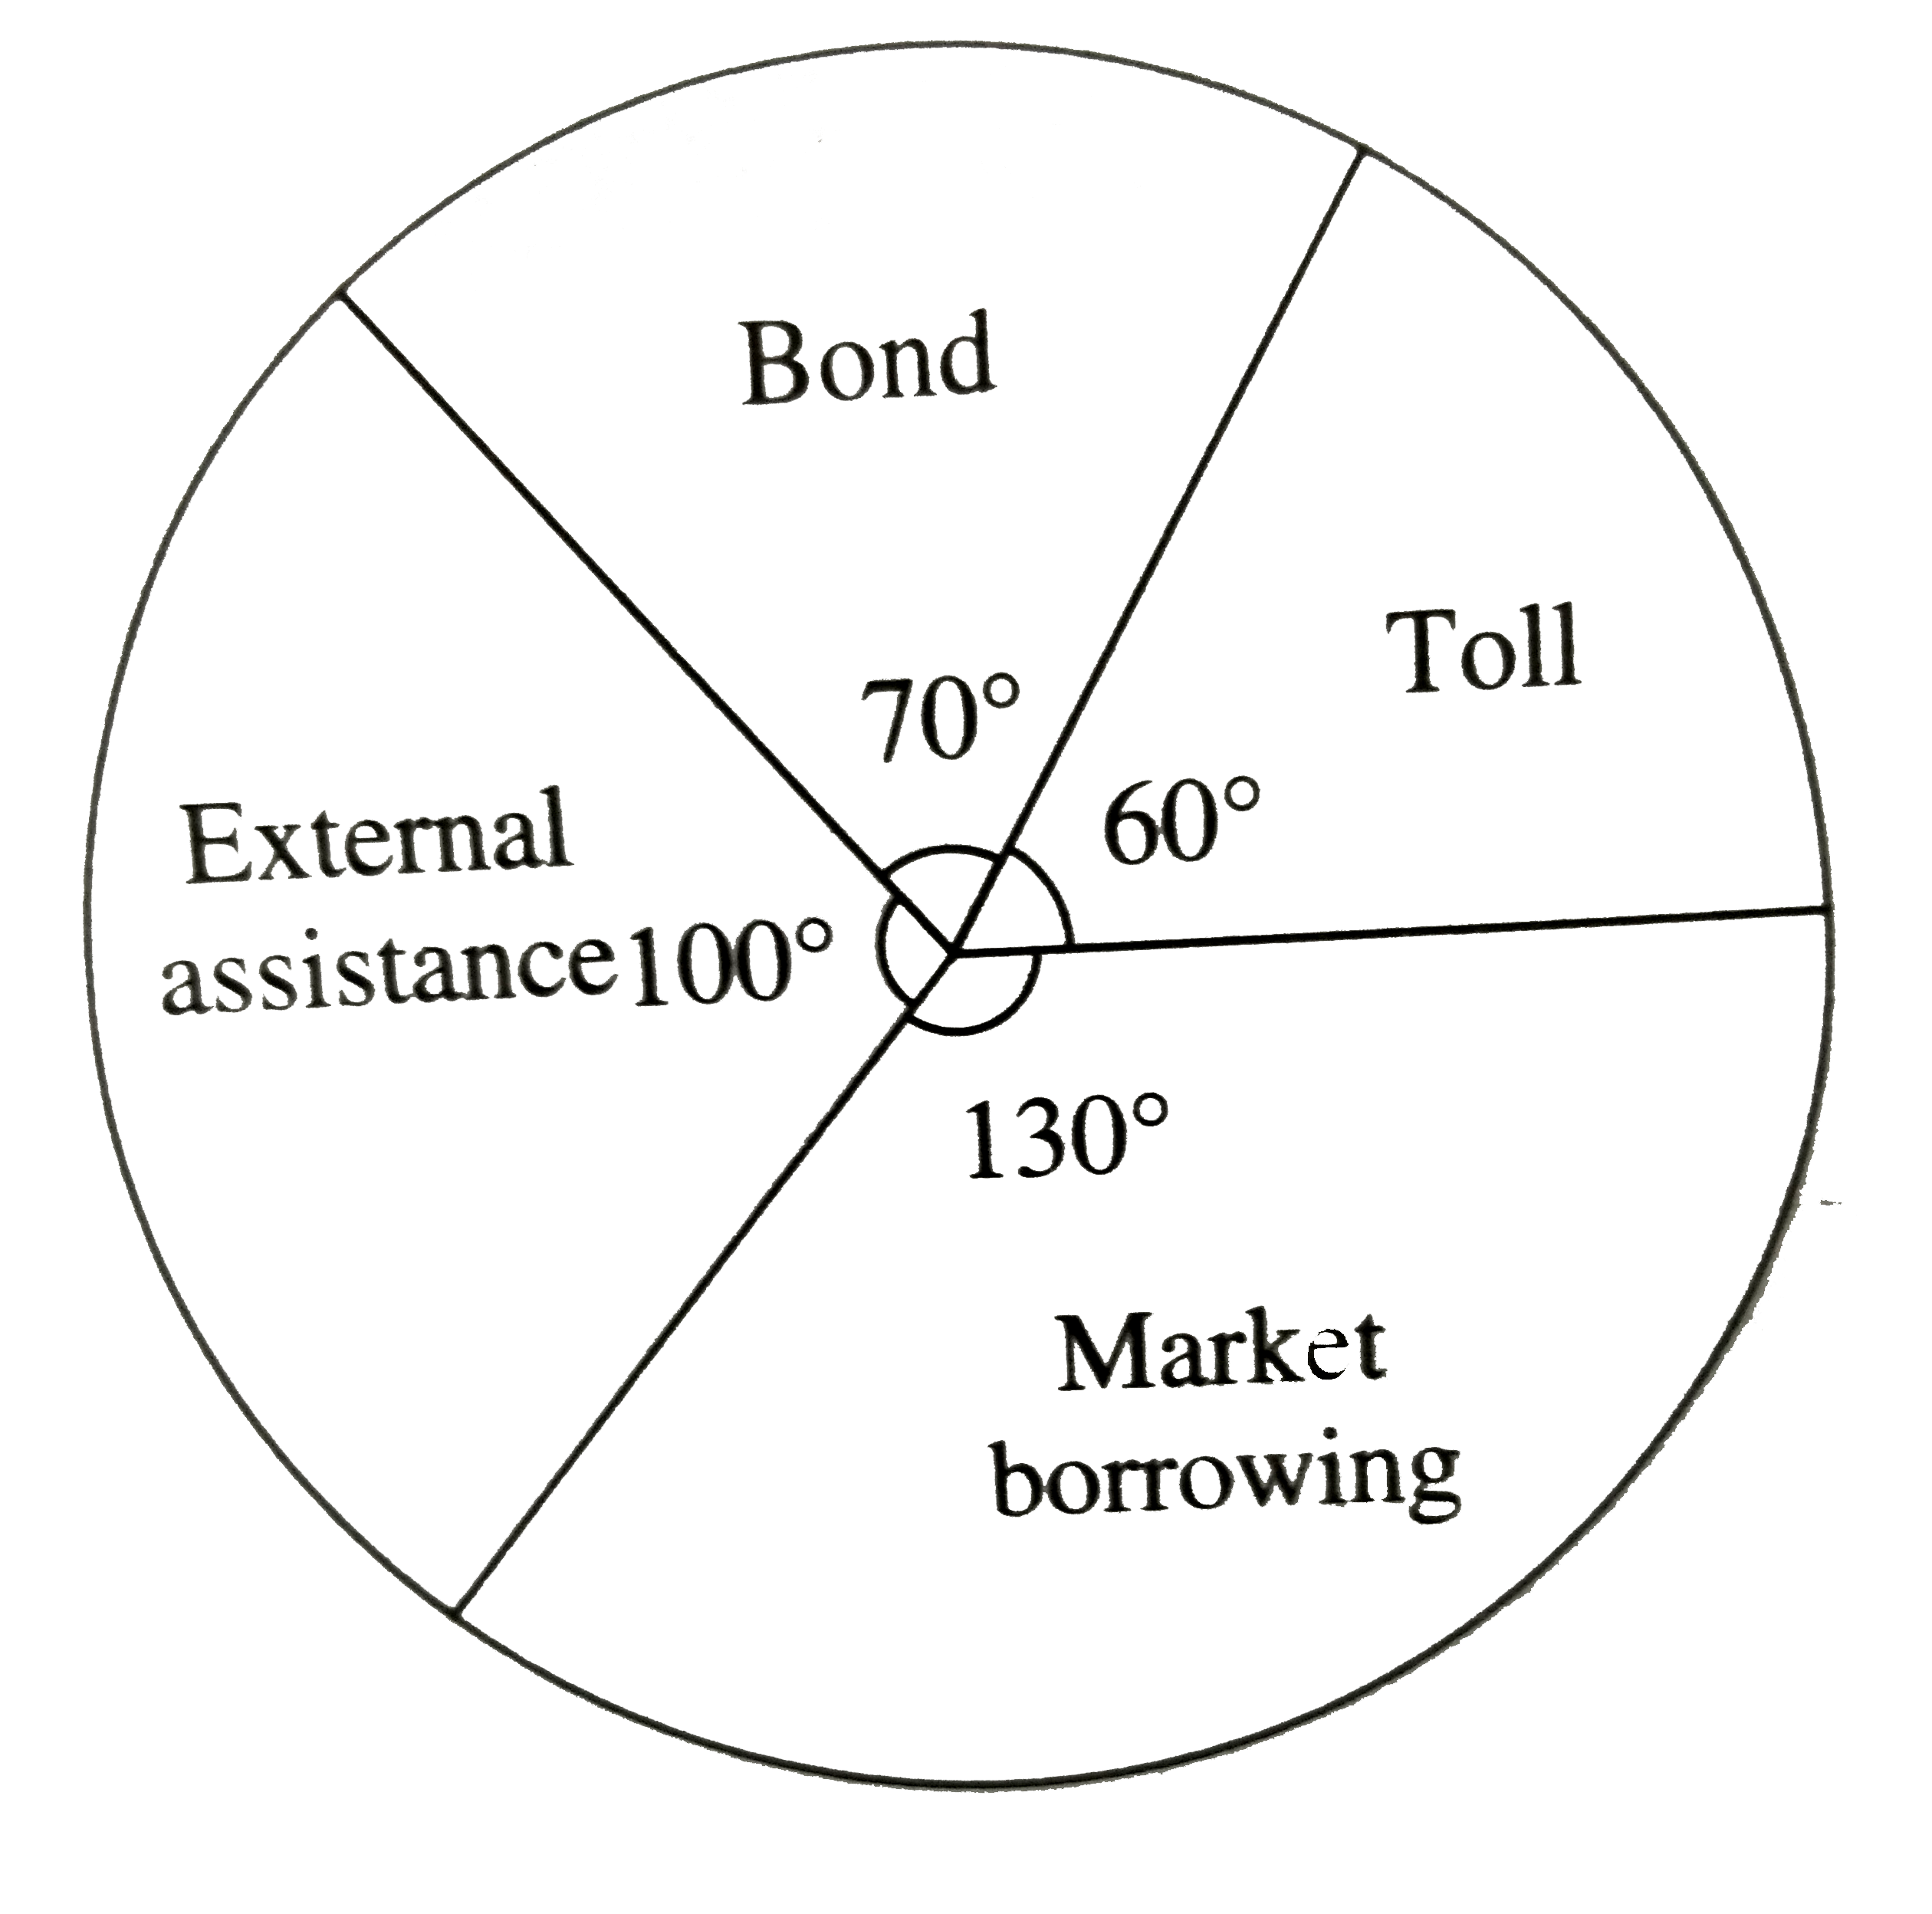
Answer the following questions :
(i) What is the total amount of the funds?
(ii) What amount is collected through 'Market borrowing'?
(iii) What amount will the project get through External assistance' ? View Solution
