EXAMPLE from RS AGGARWAL MATHS (HINGLISH) BAR GRAPH for Class 6
| Class 6 | MATHS |
| Chapter | BAR GRAPH |
| RS AGGARWAL MATHS (HINGLISH) | EXAMPLE |
| Medium | English |
| Academic Year | 2023-2024 |
Question 1
Given below is a bar graph showing the marks obtained by Tarun in few subjects in an annual examination. Read the bar graph carefully and answer the question given below : In which subject does Taun get the lowest marks ? In which subject does Tarun get the highest marks ? How many marks does he get in English ? In which subjects does Tarun get less than 50 marks ? View SolutionQuestion 2
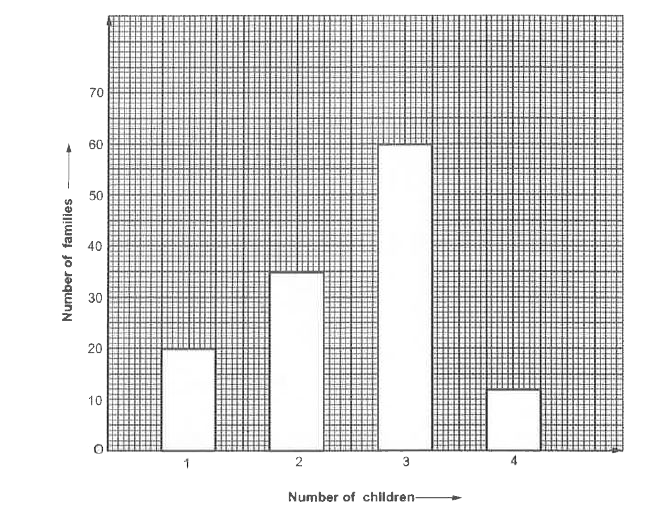
In a survey of 130 families of a colony, the number of children in each family was recorded and the data has been represented by the bar graph, given below.

Read the bar graph carefully and answer the questions given below:
(i)what information does the bar graph give?
(ii)how many families have two children ?
(iii)how many families have no children ?
(iv)what percentage of families have 4 children?View SolutionQuestion 3
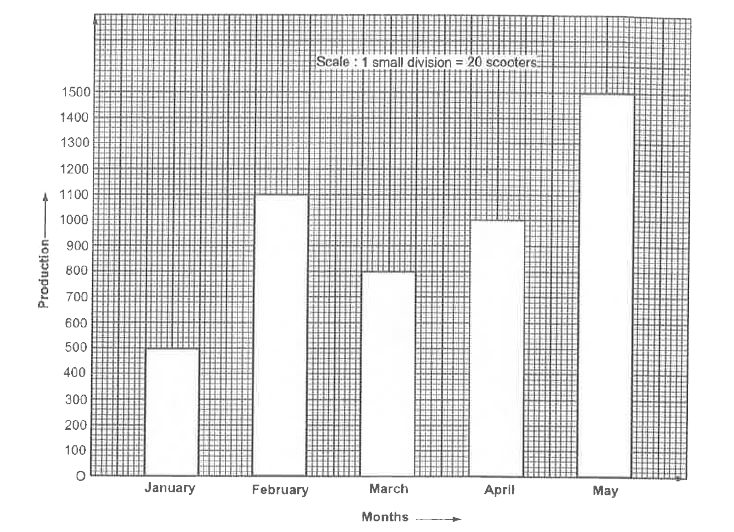
Given below is the bar graph showig the number of scooters produced in a factory during the first five months of a year.

Read the above bar graph carefully nd answer the question given below:
How many scooters were produced in the month of March?
What was the increase in proudction in Feberuary over the production in January ?
What was teh decrease in proudction in March in comparison to the production in February ?
In which month was the production minimum and what was it ? View Solution