DATA HANDLING for Class 7 MATHS
INTRODUCTION
Baccho, aapne apni previous classes m alag alag data se deal krna seekha hai ki kaise data collect krke unhe tabular form m represent krke aap bar graphs and pictograms bana skte hai. Hum humari daily life m aisi situations face krte hai where we deal with a lot of information and it gets difficult to understand all that information. Iss problem se deal krne k lie hum data collect krke use simplified form m represent krte hai taaki hume jo information chahie vo hum quickly and easily smjh ske.Iss chapter m hum data ko efficiently use krna seekhenge. We will cover different topics like collection and organisation of data, representative values like mean, median, mode, bar graphs, chance and probability, etc. So let's begin!
COLLECTING AND ORGANISING DATA

Baccho let's observe the following situation.
A study was conducted in your school and it was found out that 21 students have opted to use bus as a mode of transportation. 12 students car use krte hai as a mode of transportation. 18 bacche school paidal aate jaate hai aur 9 bacche school se aane jaane k lie bicycle use krte hai.
So basically,
Baccho, ise kehta hai data collection jisme aap ek research conduct krte hai and saari important information ko note down krlete hai. But what next?
Let's look at the following table.
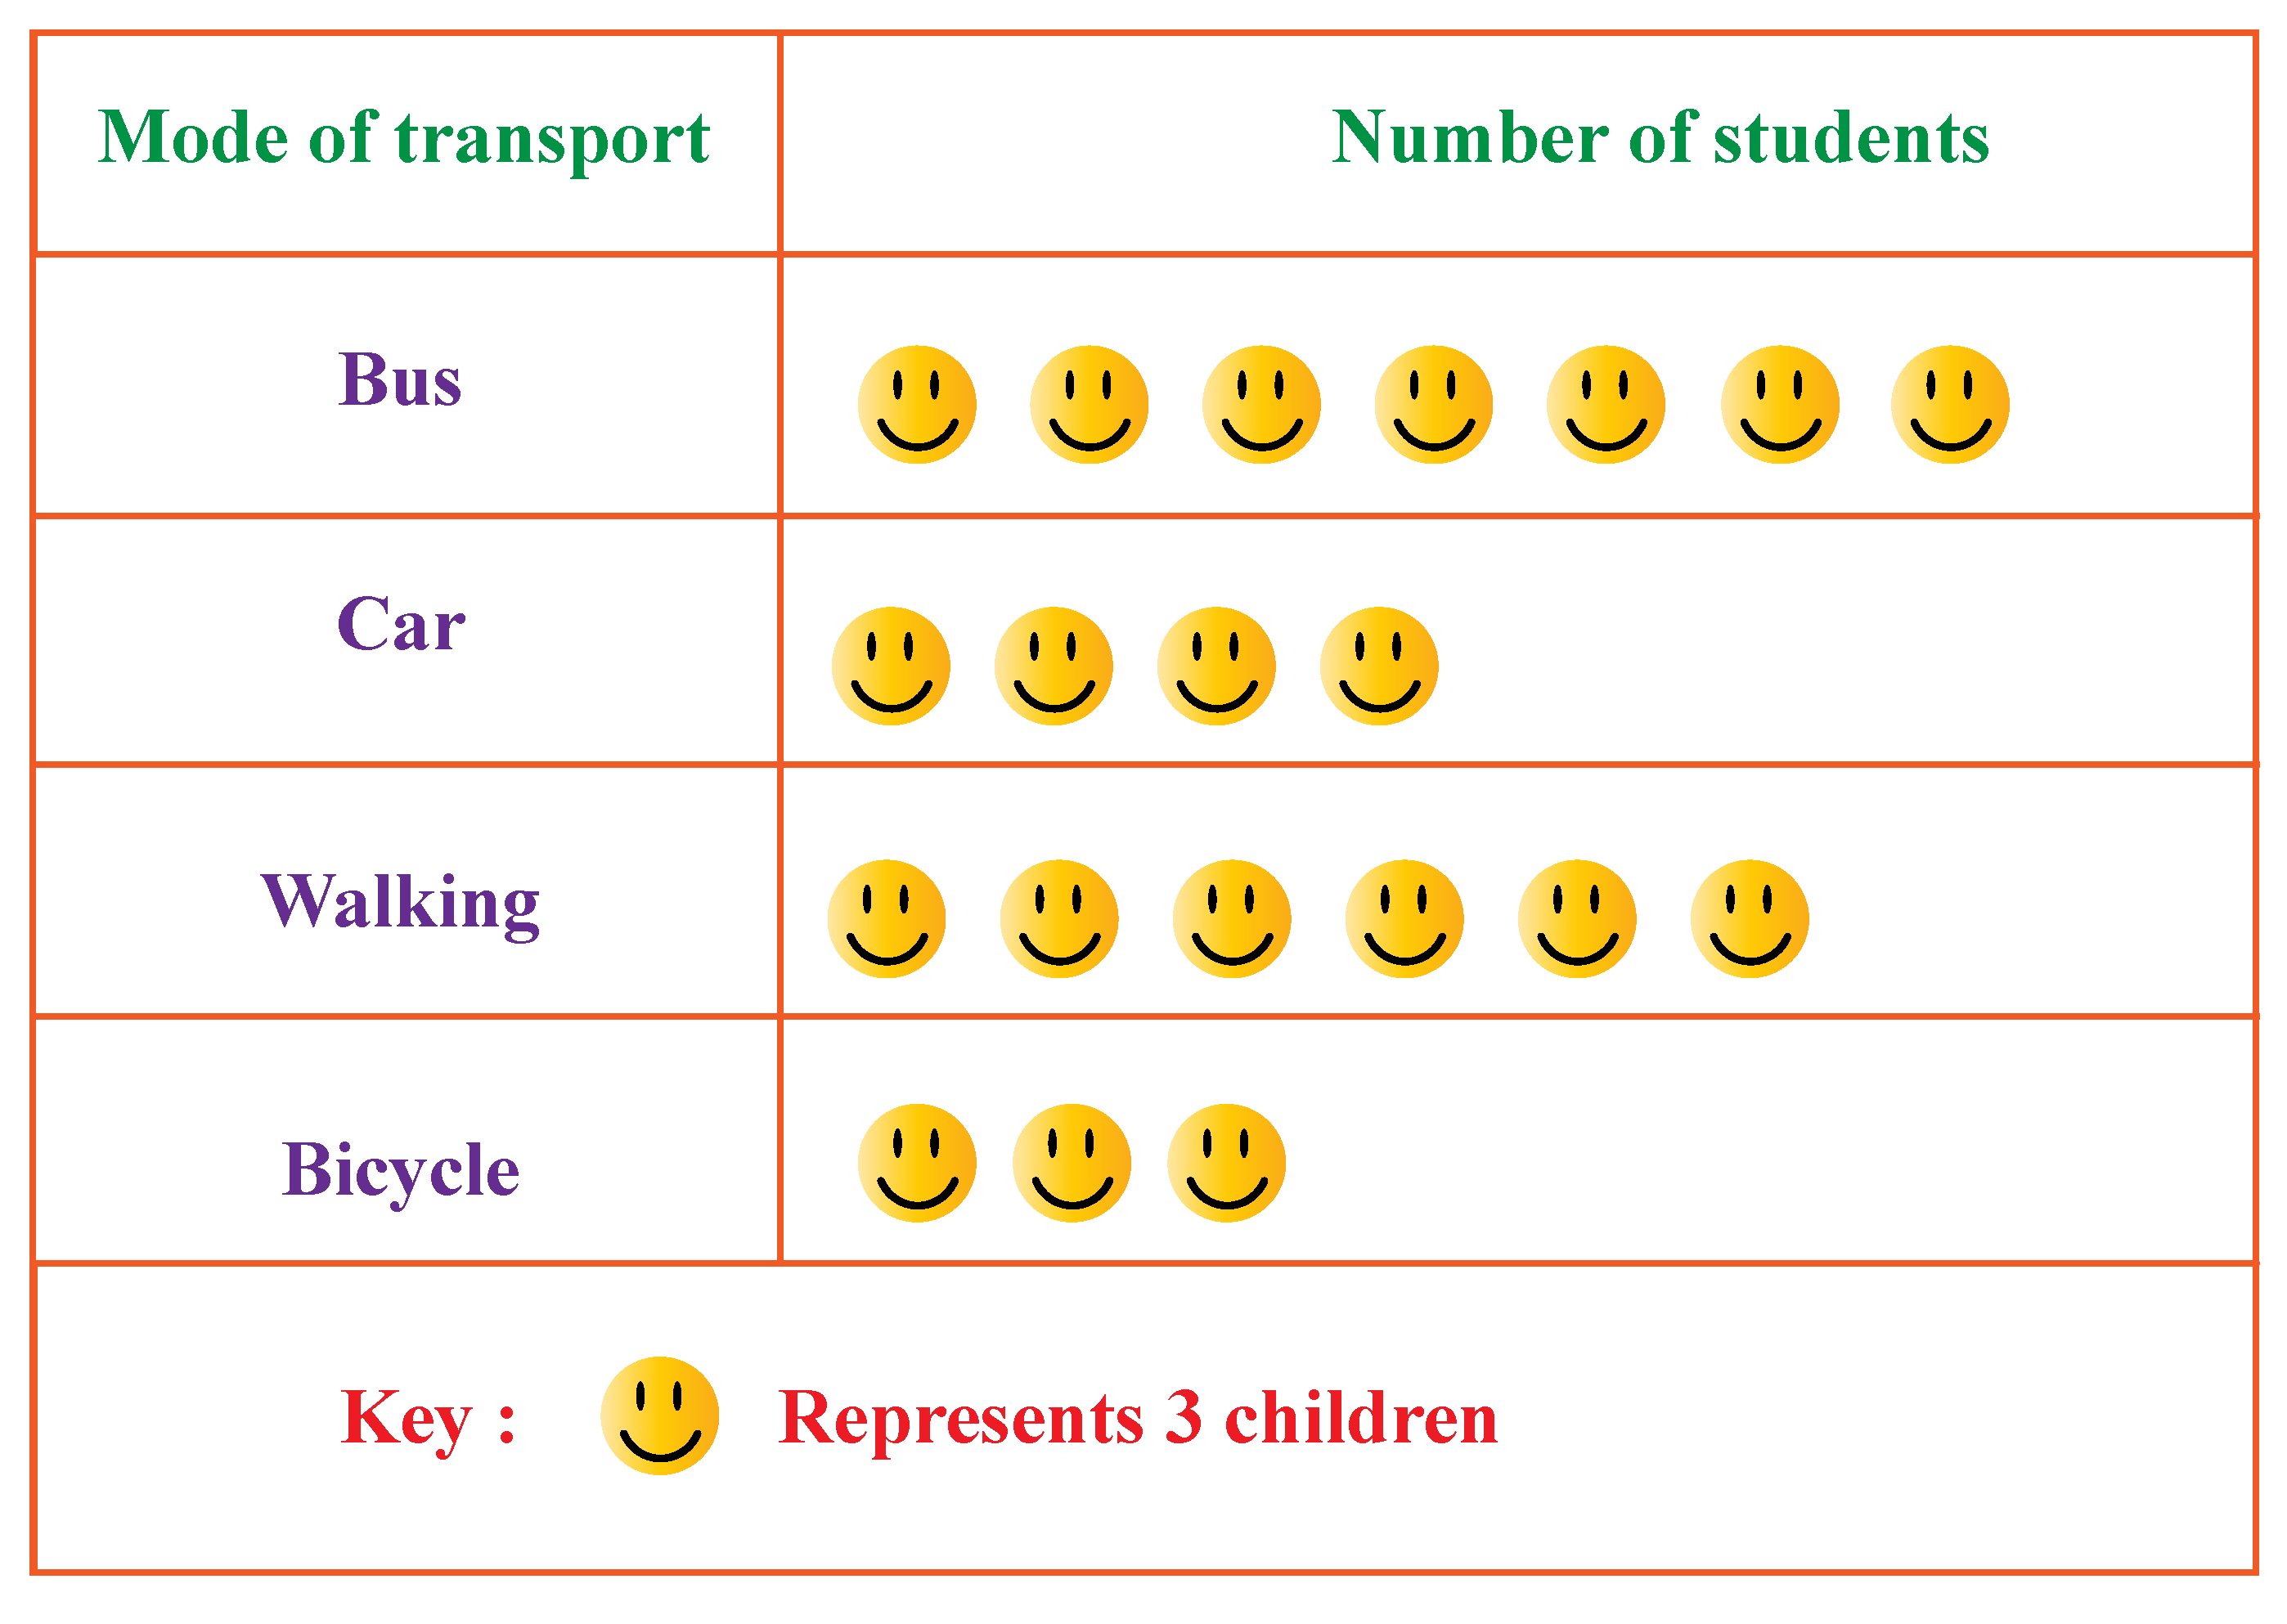
Baccho, jaisa ki aap dekh skte hai ki it's much easier to read the table and understand the information using a pictogram. This is called data organisation. Starting m information se pdhna aur compare krna was comparatively difficult and time consuming. Islie hum data collection use krte hai taaki hum saari information easily represent kr ske.
REPRESENTATIVE VALUES
Average
Baccho, aapne apni daily life m "average" k baare m suna hoga. We often come across sentences like:
Isha spends on an average of about 5 hours daily for her studies.
So basically in this sentence, "average" se hume pta chlta hai ki Isha usually 5, 5 se zyada, ya 5 se kam ghnto k lie pdhai krti hai. On some days she might study for more than 5 hours, on other days she might study for 5 or less than 5 hours. Average gives us a single value to judge the whole data. Kyunki average highest or lowest values k middle m lie krta hai, it gives us a measure of central tendency.
Measure of central tendency ka simple meaning hota hai data distribution ki ek central ya typical value jisse hume humare data k baare m ek rough idea mil ske. Hum alag alag forms of data k lie different types of central values use krte hai.
One of these representative values is the “Arithmetic mean”. Let's learn about it!
Arithmetic Mean
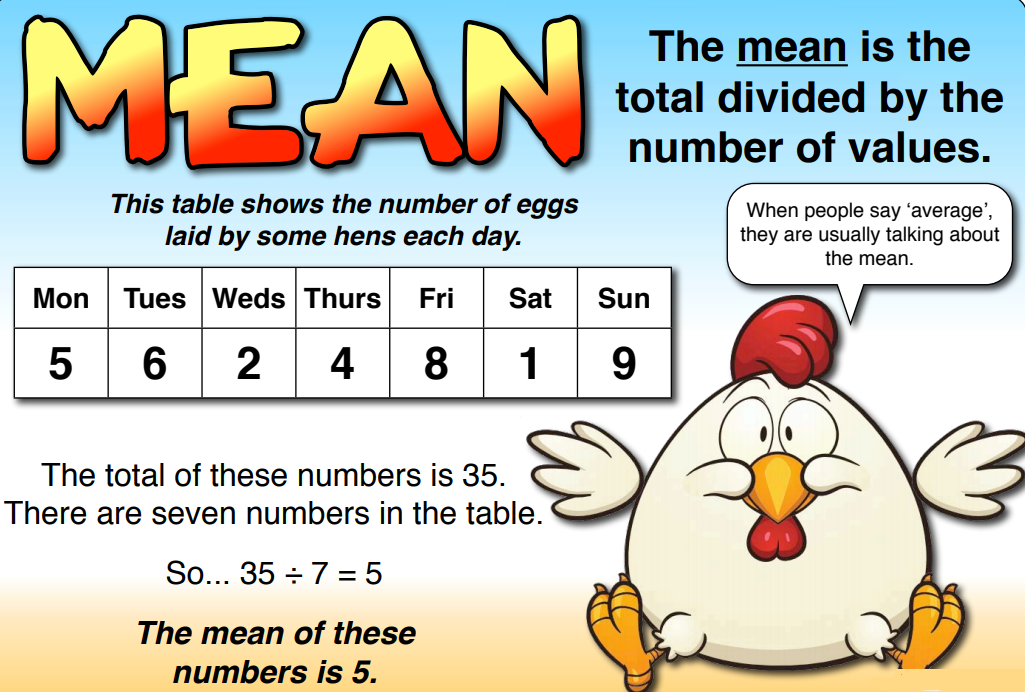
The most common representative value is the arithmetic mean or the mean.
Rule: To find the mean, we find the sum of all the observations and divide this by the number of observations.
MEAN = SUM OF ALL OBSERVATIONSNUMBER OF ALL OBSERVATIONS
Result:
(i) The mean of several observations is the value which is equally shared out among all the observations.
(ii) The mean lies in between the greatest and the smallest observation.
Example 1
Ashish studies for 4 hours, 5 hours and 3 hours respectively on threeconsecutive days. How many hours does he study daily on an average?
The average number of hours studied daily by Ashish, A = Total Number of hours studiedTotal number of days he studied
A=4+5+33=123=4
So, Ashish studies 4 hours daily on an average.
Example 2
A batsman scored the following number of runs in six innings:36,35,50,46,60,55
Calculate the mean runs scored by him in an inning.
Mean = sum of runstotal innings
Mean runs=36+35+50+46+60+556
=2826
=47 runs.
Range
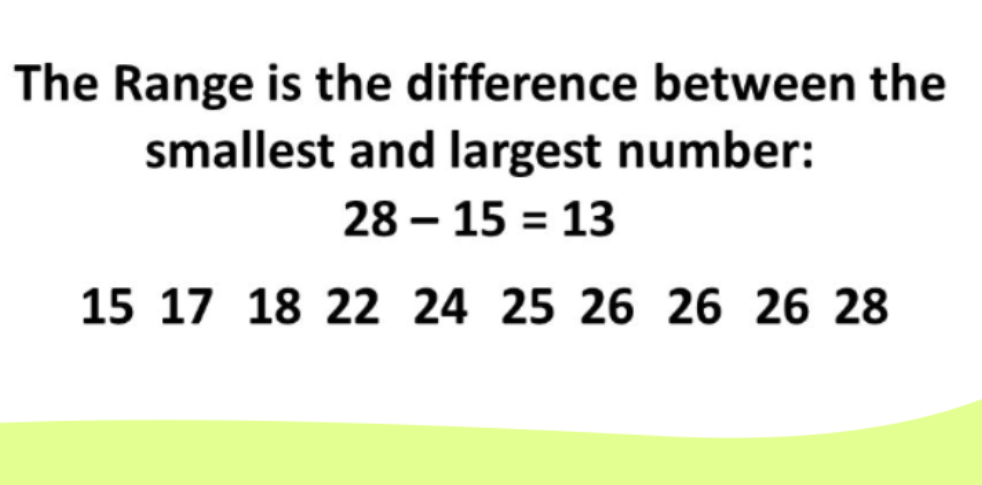
The difference between the highest and the lowest observations in a given data is called its Range.
Baccho, range vo value hoti hai jo ek data ki highest observation m se lowest observation ko subtract krne se aati hai. For example, let's have a look at the following observations.
Ages of all 10 employees in an office are : 25,43,34,55,44,60,32,29,35,40.
Range = Higest Observation – Lowest Observation =60–25=35
In order to find range, it's always better ki hum apne data ko ascending order yaani chote se badhe k order m arrange krle. Aisa krne se error k chances kam rehte hai baccho.
Example 3
The ages in years of 10 teachers of a school are: 32,41,28,54,35,26,23,33,38,40
(i) What is the age of the oldest teacher and that of the youngest teacher?
(ii) What is the range of the ages of the teachers?
(iii) What is the mean age of these teachers?
1) age of the oldest teacher =54 years
Age of the youngest teacher =23 years
2) Range =54−23=31 years
3) Mean =sum of agesnumber of people
mean =32+41+28+54+35+26+23+33+38+4010
∴ Mean =35010 =35 years.
Mode
Baccho we read about how mean is not the only measure of central tendency. Alag alag requirement k lie different measures of central tendency ka use hota hai. Mode is another such tool which tells us ki humare data m sabse highest occuring observation konsi hai.
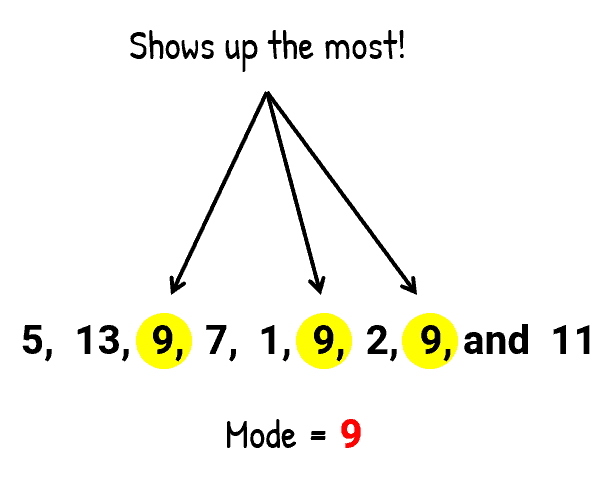
The mode of a set of observations is the observation that occurs
most often. We always arrange the data in ascending order to find mode.
Example: Given set of numbers: 5,5,7,4,3,2,5,2,5,4
Ascending Order =2,2,3,4,4,5,5,5,5,7
∴ Mode of this data is 5 because it occurs more frequently.
Note: A data can have more than 1 mode. Let's see how :
Example : Given set of numbers : 3,2,3,2,2,3,4,5,6,7
Ascending order: 2,2,2,3,3,3,4,5,6,7
Baccho, observe kro ki 2 three times appear horha hai and 3 bhi three times appear horha hai. And because all other numbers are appearing less than three times, therefore, 2 and 3 are the mode of the above data.
Example 4
Find the mode of the numbers: 2,2,2,3,3,4,5,5,5,6,6,8
Since the data is already in ascending order, we don't need to rearrange.
Mode of this data is 2 and 5 because they occur more frequently than other observations.
Mode of large data
Baccho, jab humare data m kuch hi observations hoti hai, hume asaani se use ascending order m rearrange krke mode nikaal skte hai. But what if we have a data which has 30 observations ? It would take a lot of time to rearrange them and then count ki which number is occurring the most number of times.
Aisi situation m we use tally marks to quickly and efficiently find out the mode of the data.
Let's understand this with an example :
Marks of 12 different students in a test were recorded as : 4,7,5,6,4,7,6,7,7,6,7,5,4,7,5,6,4,7,6,7,7,6,7,5,6 . Find out the mode from this data.
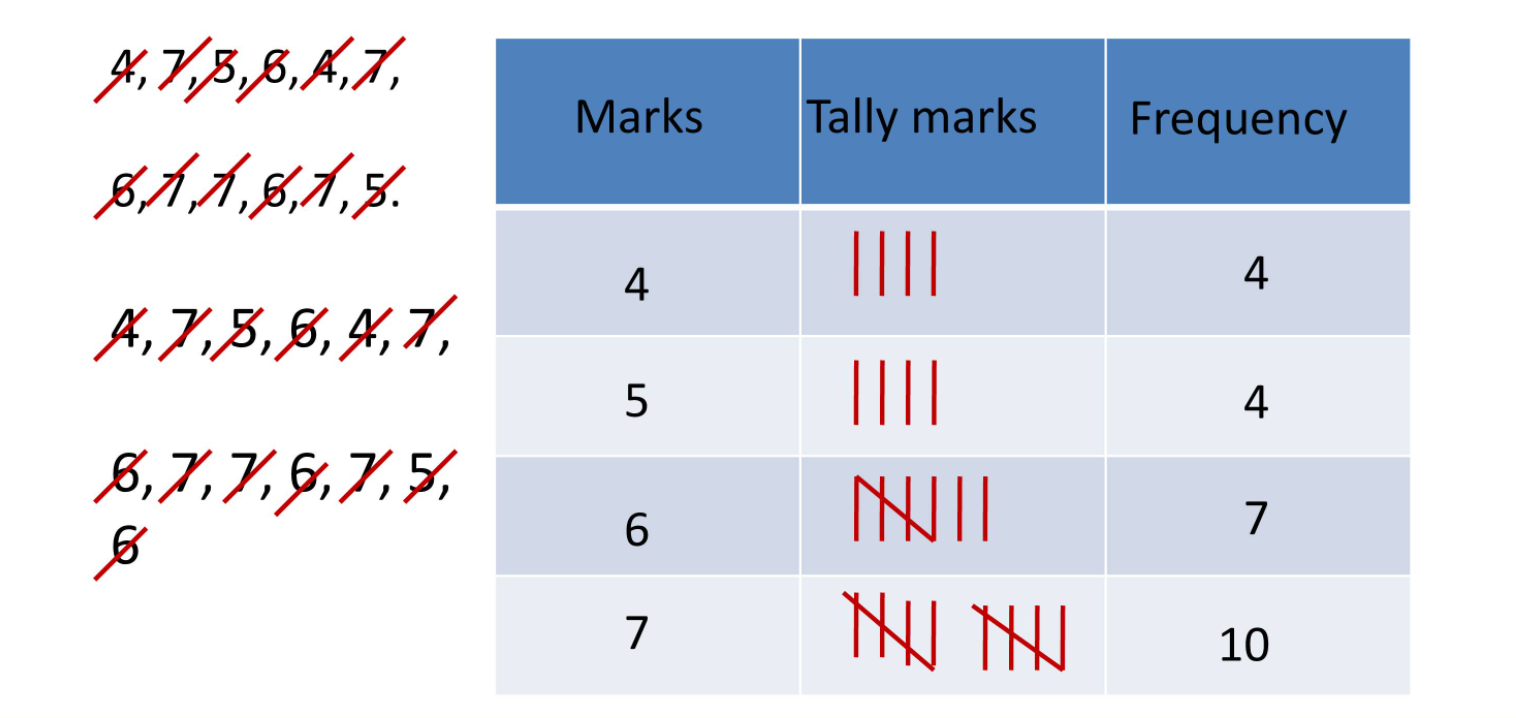
We can clearly see that the number 7 appears the most number of times in the data and hence, we can conclude that 7 is the mode.
Median
To baccho, humne dekha ki depending on the type of information that we need, we use different measures of central tendency. We learnt to use mean and mode. Now let us consider the following situation :
Ek class m 17 students hai jinki heights hai : 106,110,123,125,117,120,112,115,110,120,115,102,115,115,109,115,101
Class teacher chahti h ki vo iss class ko do groups m iss tarah divide kre taaki ek group m ek particular height se chote baccho ho aur dusre group m ek particular height se badhe bacche ho. But what exactly is the measurement of this "particular height"?
For this we use the concept of median
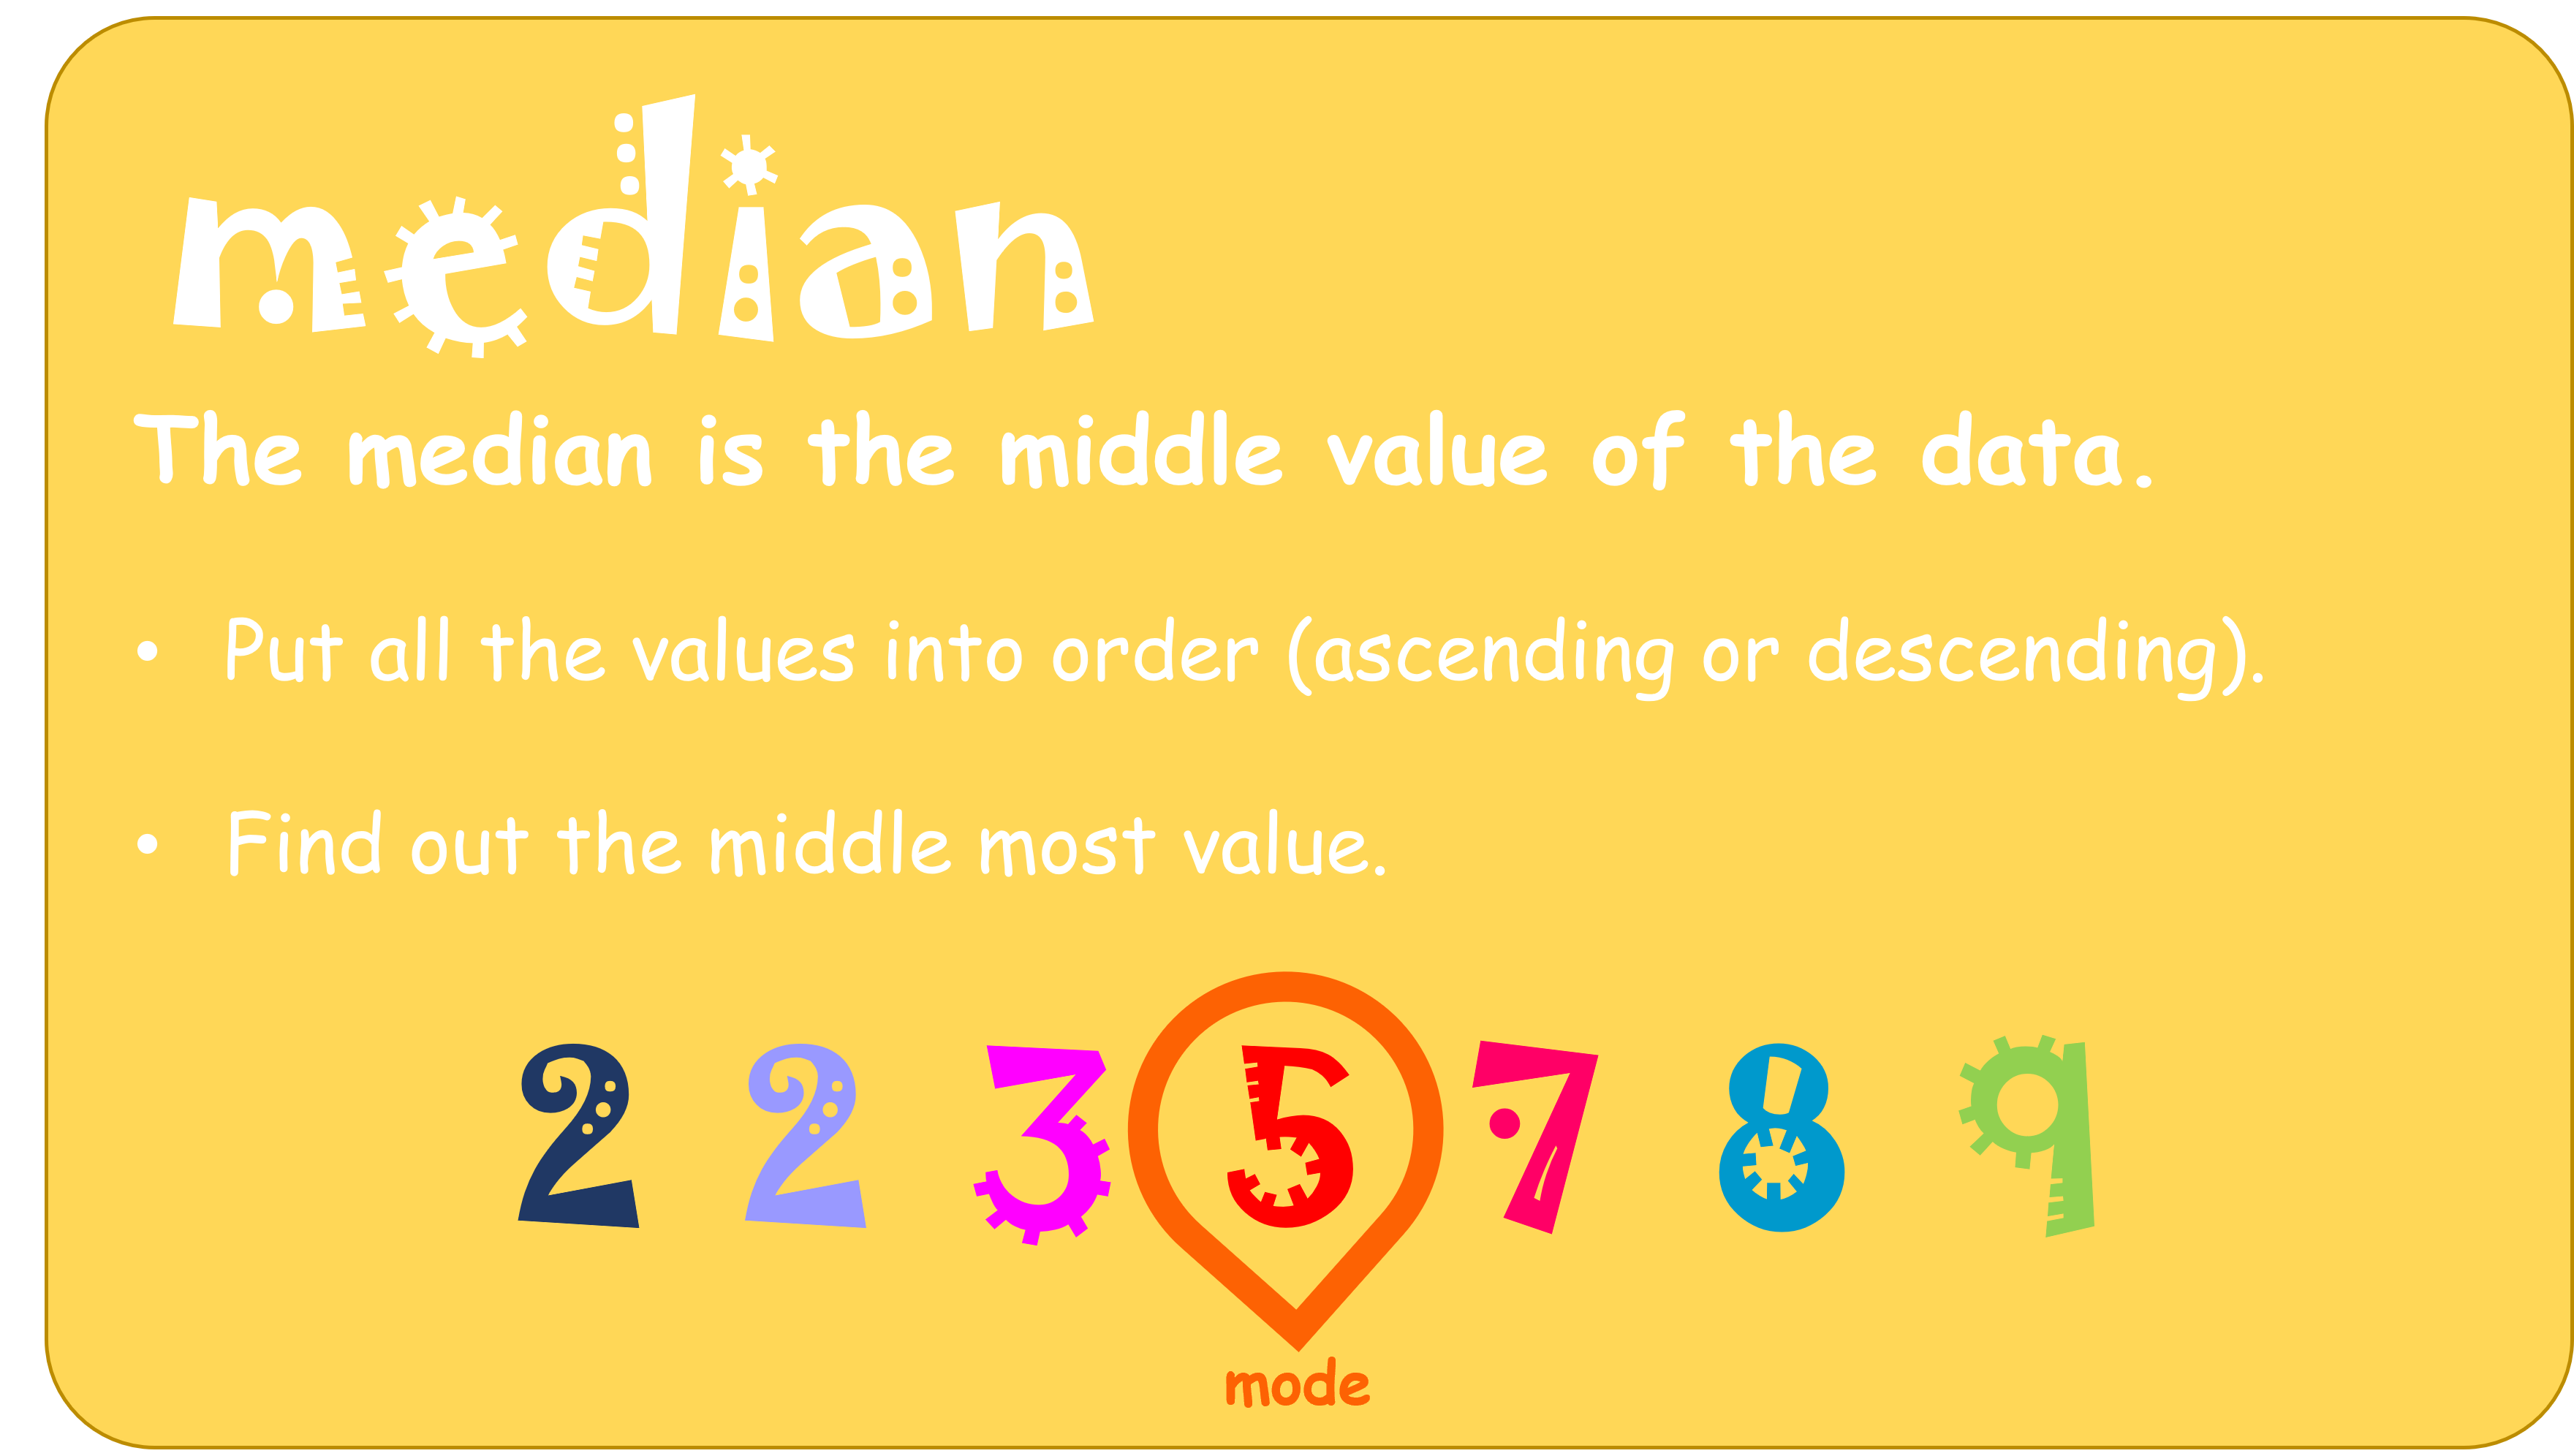
Median ek data ki middlemost value hoti hai (when data is arranged in ascending or descending order). Kyunki ye data ki ek dam middle ki value hoti hai, it means ki uski ek side ki saari values usse choti hongi aur dusri side ki saari values usse badhi hongi.
From this, we can conclude that, when a given data is arranged in ascending (or descending) order, then the middlemost observation is called the median of the data.
Example 5
Find the median of the data: 24,36,46,17,18,25,35
First arrange the data in ascending order=>17,18,24,25,35,36,46
Median of the data is 25.
Choosing a scale
Baccho, aapne apni previous classes m data ko organize krke unko frequency table, pictographs and bar graphs k through visually represent krna seekha that. Now we'll learn about double bar graphs and how to use them.
The first step to consider while making a graph is choosing a scale.
Large numbers cannot be represented in a bar graph, so the scaling factor is used to reduce or scale down large numbers. We know that a bar graph is a representation of numbers using bars of uniform width and
the lengths of the bars depend upon the frequency and the scale you have chosen.
Baccho, scale choose krne k lie we observe the values from our data and then decide how much one unit on the graph should represent. One unit length can represent 10 or 100 observations depending upon the data.
Let's understand this with an example
EXAMPLE : Following data gives total marks (out of 600) obtained by six children of
a particular class. Represent the data on a bar graph.

SOLUTION : (i) To choose an appropriate scale we make equal divisions taking increments of 100.
Thus 1 unit will represent 100 marks.
(ii) Now represent the data on the bar graph.
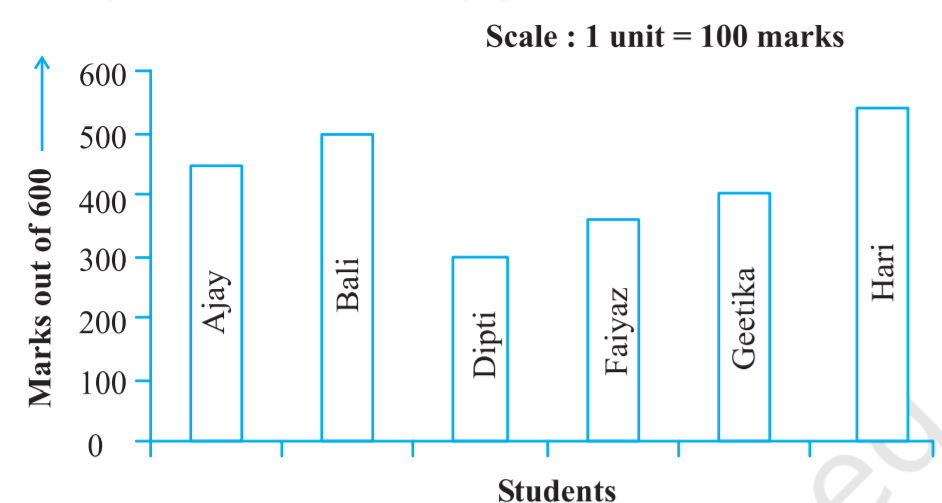
To baccho, jaisa ki aapne dekha we took 100 as our scale because humari values 100 se easily represent ho skti thi.
Double Bar Graphs
Baccho, we know that a bar graph helps us to represent values visually jisse ki hum ek data ko better aur quickly understand kr skte hai. Using a bar graph we can easily figure out the mode of the data by seeing ki konsa bar sabse lambe hai. But what exactly is a double bar graph and how is it used? Let's learn about it.
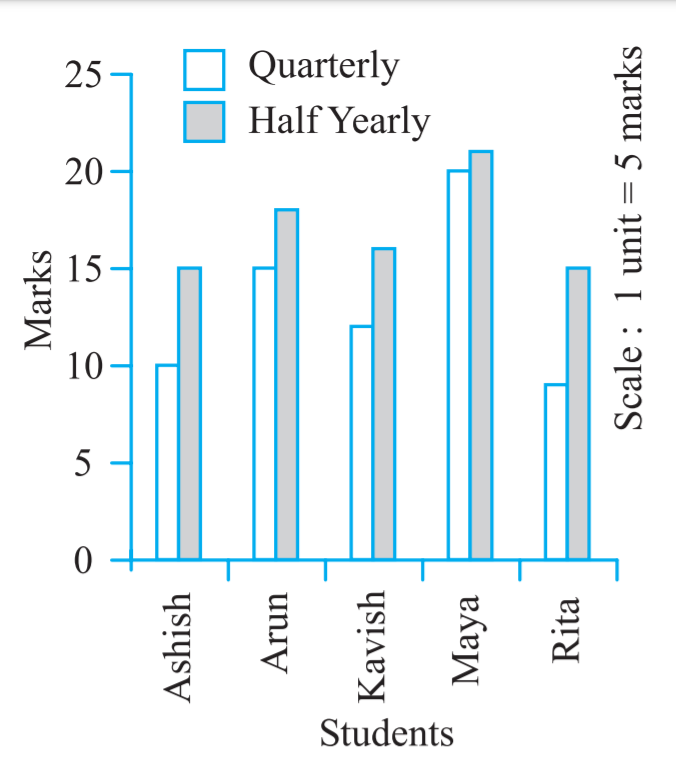
Example 6
A mathematics teacher wants to see, whether the new technique of teaching she applied after quarterly test was effective or not. She takes the scores of the 5 weakest children in the quarterly test (out of 25) and in the half yearly test (out of 25):

Chances and Probability
Baccho, aapne zaroor phle chance aur probability words ko use hote hue suna hoga. We often say things like :
OR
Let's try to understand these words better by considering the following statements.
Baccho, we all know that sun can never rise from west and that an ant can not grow upto 3m tall. But, India winning the next test series is a possibility. Let's learn about these topics more in detail.
Example 7
There are 6 marbles in a box with numbers from 1 to 6 marked on each of them.
(i) What is the probability of drawing a marble with number 2?
(ii) What is the probability of drawing a marble with number 5?
1) Total outcomes =6
Favorable outcome =1
P(2) =16
2)Total outcome =6
Favorable outcome =1
P(5) =16.
Let's Summarize
1. The collection, recording and presentation of data help us organize our experiences
and draw inferences from them.
2. Before collecting data we need to know what we would use it for.
3. The data that is collected needs to be organized in a proper table, so that it becomes
easy to understand and interpret.
4. Average is a number that represents or shows the central tendency of a group of
observations or data.
5. Arithmetic mean is one of the representative values of data.
6. Mode is another form of central tendency or representative value. The mode of a set
of observations is the observation that occurs most often.
7. Median is also a form of representative value. It refers to the value which lies in the
middle of the data with half of the observations above it and the other half below it.
8. A bar graph is a representation of numbers using bars of uniform widths.
9. Double bar graphs help to compare two collections of data at a glance.
10. There are situations in our life, that are certain to happen, some that are impossible
and some that may or may not happen. The situation that may or may not happen has
a chance of happening.
Let's Revise
1) Baccho, iss chapter m humne seekha ki hum data ko kaise collect krke organize krte hai so that it becomes easier for us to understand and use that information for other purposes.
2) In our previous classes, we learnt that hum data ko pictograms, frequency distribution tables and bar graphs k through represent krte hai.
3) Average or mean, ek aisi value hoti hai jo humare data ki central tendency represent krti hai. It helps us to make deductions from our data. Ye ek aisi value hoti hai jo hume humare data ki representation k baare m btati hai. It is calculated by dividing the sum of all observations by the total number of observations
Mean =Sum of all observationsTotal number of observations
4) Mode is another form of representative value. Mode basically vo value hoti hai jo humare data m sabse zyada baari occur krrhi hoti hai. Jab hume kisi badhe data ka mode nikaalna hota hai, we use frequency distribution table to simplify the process.
5) To know about the range of a data, we subtract the lowest observation from the highest observation.
6) Median is also another form of measure of central tendency. Baccho, median humare data ki middlemost value hoti hai. Jab hum humare data ko ascending ya descending order m arrange krte hai, uske baad jo humari middlemost value aati hai, vo median hoti hai.
7) Double bar graphs vo bar graphs hote hai jisme do alag data ko ek saath represent kia jaata hai using bars of equal width. Double bar graphs se hum do data ko asaani se compare kr skte hai.
8) Hum humari life m aisi situations face krte hai where somethings are certain to happen. Jaha p kuch cheezo k hone k chances hote h aur kuch k nahi hote hai. Isse humara probability ka concept aata hai. Probability ko calculate krne k lie, we divide our favorable outcome by the number of outcomes.
PROBABILITY OF OCCURENCE OF ANY EVENT {P(E)} = NUMBER OF FAVOURABLE OUTCOMESTOTAL NUMBER OF OUTCOMES
9) Sample space humare saare possible outcomes ka set hota hai.
10) Probability as a number lies between 0 and 1.