NCERT SECTIONS (15.1) from MTG IIT JEE FOUNDATION INTRODUCTION TO GRAPHS for Class 8
| Class 8 | MATHS |
| Chapter | INTRODUCTION TO GRAPHS |
| MTG IIT JEE FOUNDATION | NCERT SECTIONS (15.1) |
| Medium | English |
| Academic Year | 2023-2024 |
Question 1
The following graph shows the temperature of a patient in a hospital , recorded every hour.
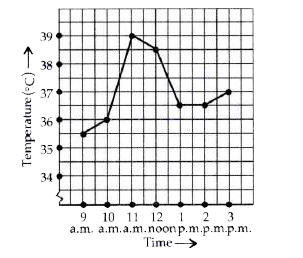
(a) What was the patient's temperature at 1 p.m. ?
(b) When was the patient's temperature 38.5∘C ?
(c ) The patient's temperature was the same two times during the period given. What were these two times?
(d) What was the temperature at 1.30 p.m.? How did you arrive at your answer?
(e) During which periods did the patient's temperature showed an upward trend?View SolutionQuestion 2
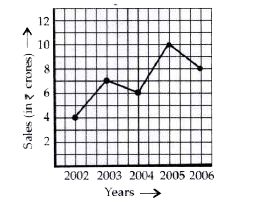
The following line graph shows the yearly sales figures for a manufacturing company. (a) What were the sales in
(i) 2002 (ii) 2006?
(b) What were the sales in
(i) 2003 (ii) 2005?
(c) Compute the difference between the sales in 2002 and 2006.
(d) In which year was there the greatest difference between the sales as compared to its previous year?
 View Solution
Question 3
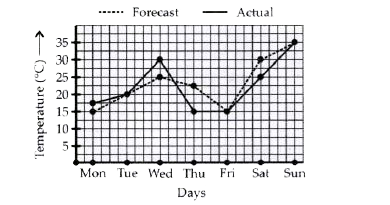
The following graph shows the temperature forecast and the actual temperature for each day of a week.
(a) On which days was the forecast temperature the same as the actual temperature?
(b) What was the maximum forecast temperature during the week?
(c) What was the minimum actual temperature during the week?
(d) On which day did the actual temperature differ the most from the forecast temperature?
 View Solution
Question 6
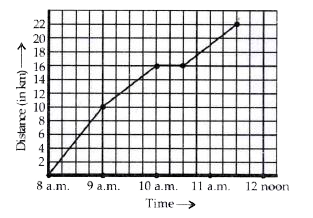
A courier- person cycles from a town to a neighbouring suburban area to deliver a parcel to a merchant. His distance from the town at different times is shown by the following graph.
(a) What is the scale taken for the time axis? (b) How much time did the person take for the travel? (c) How far is the place of the merchant from the town? (d) Did the person stop on his way? Explain. (e) During which period did he ride fastest?
 View Solution
Question 13
State whether True or False. Correct that are false.
(i) A point whose x- coordinates is zero and y-coordinates is non-zero will lie on the y - axis.
(ii) A point whose y-coordiantes is zero and x-coordinates is 5 will lie on y-axis.
(iii) The coordinates of the origin are (0,0) . View Solution
All Exercises from MTG IIT JEE FOUNDATION Class 8 MATHS INTRODUCTION TO GRAPHS
- NCERT SECTIONS (15.1)
- NCERT SECTIONS (15.2)
- NCERT SECTIONS (15.3)
- EXERCISE (ASSERTION & REASON TYPE)
- EXERCISE (INTEGER/NUMERICAL VALUE TYPE)
- EXERCISE (MATCH THE FOLLOWING
- EXERCISE (MULTIPLE CHOICE QUESTION) (LEVEL-1)
- EXERCISE (MULTIPLE CHOICE QUESTION) (LEVEL-2)
- EXERCISE (SUBJECTIVE PROBLEMS) ( VERY SHORT ANSWER TYPE)
- EXERCISE (SUBJECTIVE PROBLEMS) (LONG ANSWER TYPE)
- EXERCISE (SUBJECTIVE PROBLEMS) (SHORT ANSWER TYPE)
- EXERCISE (SUBJECTIVE PROBLEMS) (VERY SHORT ANSWER TYPE)
- OLYMPIAD/HOTS CORNER
- ILLUSTRATIONS
- SOLVED EXAMPLES


