SOLVED EXAMPLE from NCERT EXEMPLAR DATA HANDLING for Class 8
| Class 8 | MATHS |
| Chapter | DATA HANDLING |
| NCERT EXEMPLAR | SOLVED EXAMPLE |
| Medium | English |
| Academic Year | 2023-2024 |
Question 13
The weekly wages (in Rs.) of 30 workers in a factory are give: 830,835,890,810,835,836,869,845,898,890, 820,860,832,833,855,845,804,808,812,,840,885,835,835,836,878,840,868,890,806,840 Mark a frequency table with intervals as 800-810, 810-820 and so on, using tally marks. Also, draw a histogram and answer the following questions: Which group has the maximum number of workers? How many workers earn Rs. 850 and more? How many workers earn less than Rs. 850?View SolutionQuestion 17
Draw a histogram for the frequency distribution table given in Example 13 and statement of Example 13 is given by as-
The weekly wages (in Rs.) of 30 workers in a factory are 830, 835, 890, 810, 835, 836, 869, 845, 898, 890, 820, 860, 832, 833, 855, 845, 804, 808, 812, 840, 885, 835, 835, 836, 878, 840, 868, 890, 806, 840. Using tally marks, make a frequency distribution table with class intervals 800 – 810, 810 – 820 and so on. Answer the following questions
Which class interval has the maximum number of workers? View SolutionQuestion 18
Draw a histogram for the frequency distribution table given in Example 13 and statement of Example 13 is given by as-
The weekly wages (in Rs.) of 30 workers in a factory are 830, 835, 890, 810, 835, 836, 869, 845, 898, 890, 820, 860, 832, 833, 855, 845, 804, 808, 812, 840, 885, 835, 835, 836, 878, 840, 868, 890, 806, 840. Using tally marks, make a frequency distribution table with class intervals 800 – 810, 810 – 820 and so on. Answer the following questions.
How many workers earn Rs. 850 and more? View SolutionQuestion 19
Draw a histogram for the frequency distribution table given in Example 13 and statement of Example 13 is given by
The weekly wages (in Rs.) of 30 workers in a factory are 830, 835, 890, 810, 835, 836, 869, 845, 898, 890, 820, 860, 832, 833, 855, 845, 804, 808, 812, 840, 885, 835, 835, 836, 878, 840, 868, 890, 806, 840. Using tally marks, make a frequency distribution table with class intervals 800 – 810, 810 – 820 and so on
Answer the following questions.
How many workers earn less than Rs. 850? View SolutionQuestion 20
Draw a histogram for the frequency distribution table given in Example 13 as
(Data: 830, 835, 890, 810, 835, 836, 869, 845, 898, 890, 820, 860, 832, 833, 855, 845, 804, 808, 812, 840, 885, 835, 835, 836, 878, 840, 868, 890, 806, 840) and answer the following questions.
How many workers earn Rs. 820 or more but less than Rs. 880? View SolutionQuestion 26
Application on problem solving strategy
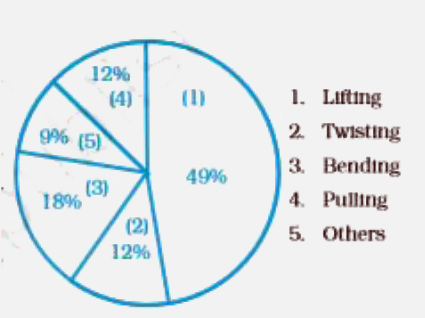
Given below is a pie chart depicting the reason given by people who had injured their lower back. Study the pie chart and find the number of people who injured their back while either bending and lifting. A total of 600 people were surveyed.
 View Solution


