STATISTICS for Class 9 MATHS
INTRODUCTION
Hello Bachcho, aaj hum statistics ke baare mai padhenge. Hume apni daily life mai bahot sari information dekhne ko milti hai. Usme kuch facts, numerical figures, tables, graphs, etc. Aur ye sab hume pta chalta hai newspaper, magazines, television, google, youtube, etc ke through. Aur ye sab kafi cheejo se related ho sakte hai jaise ki cricket batting or bowling, politics, corona news, expenditures in various sectors of a five year plan, polling results, and so on. These facts or figures, which are numerical or otherwise, collected with a definite purpose are called data .
Of course data word aapke liye new nhi hai. Aapne data or data handling ke baare mai earlier classes mai padha hoga.
Statistics ek Latin word status se derived hua hai jiska matlab a (political) state hai.
In its origin, statistics sirf simply data collection, different aspects of the life of people, inn sabhi ke liye hi use hota tha. But time ke saath iska scope bhi broad ho gya hai ab iska use interpretation and drawing of inferences from the data ke liye bhi use hota hai.
Explanation
Humara world day by day information oriented hota ja raha hai. To itne data mai se meaningful information nikalna essential ho gaya hai. This extraction of meaningful information is studied in a branch of mathematics called Statistics.
Statistics
A branch of mathematics dealing with the collection, analysis, interpretation, and presentation of masses of numerical data or quantitative data.
Collection of data
Hum 2 type se data ko collect kar sakte hai.
First is Primary data yeh wo data hota hai jo investigator personally collect karta hai with a definite objective in his or her mind.
Second is Secondary data jab data kisi source ki help se liya jo ki pehle se hi stored hai ya kisi aur ki help se collect kiya jaye.
Example 1
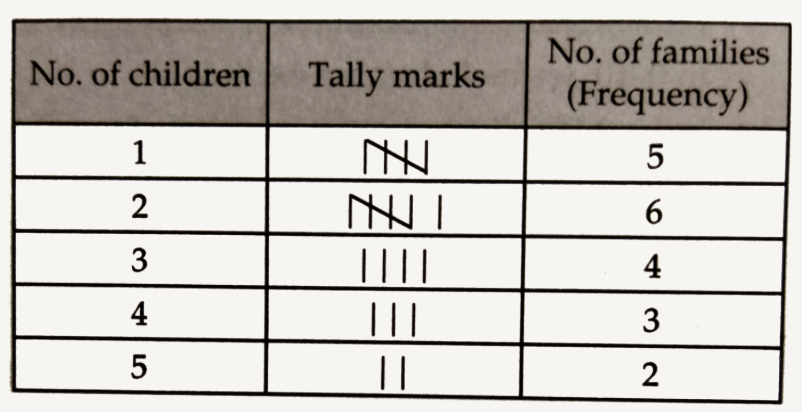
The following data gives the number of children in 20 frequency table.
4,5,2,4,2,2,1,2,2,1,5,3,2,1,1,4,3,2,1,1
Make an array of the above data and construct a frequency table.
Arranging the numerical data in ascending order of magnitude, we get the array as under:
1,1,1,1,1,2,2,2,2,2,2,3,3,3,3,4,4,4,4,5,5.
For counting, we use tally marks |,||,|||,||||, and the cancel ("||||") tally mark is entered as by crossing diagonally the four tally marks already entered.
Frequency table may now be presented as under.
Example 2
The following data gives the marks and out of 50 obtained by 30 students of a class in a test.
30,27,17,37,46,12,40,6,23,2,19,5,33,25,39,
21,19,12,17,19,17,41,8,10,12,1,9,13,21,48
Arrange them in ascending order and present it as a grouped data
(i) in exclusive form,
(ii) in inclusive form.
Arranging the marks in ascending order, we get
1,2,5,6,8,9,10,12,12,12,13,17,17,17,19,19,
19,21,21,23,25,27,30,33,37,39,40,41,16,48
We may now classify them into groups as shown below.
(i) In exclusive form:
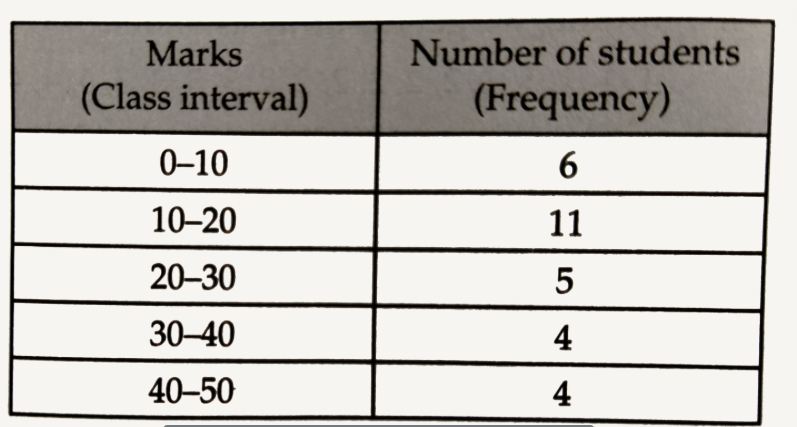
In 0-10 we inclusive 0 but exclude 10.
In 10-20, we include 10 but exclude 20, and so on.
(ii) In inclusive form:

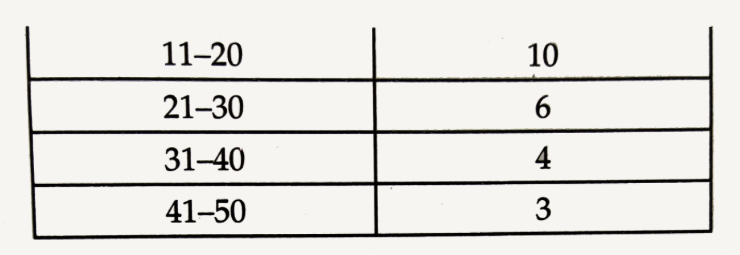
Here, in 0-10, we should both 0 and 10.
In 11-20, we include both 11 and 20.
Presentation of data
Humne data collect karne ka kaam pura kar liya hai. Abh investigator ko iss data ko ek meaningful way mai kaise present karna hai ye dekhna hai. Chalo ise ek example ke through samajhte hai.
Ek class mai 10 students ke number ko hum apna data maan lete hai.
Numbers are
27,56,58,32,12,34,24,23,78,87
Toh abh aap isme se sabse lowest marks bta sakte hai. Aapko isme se dhundne mai time laga hai, toh kyu na iss time ko short karte hai.
Hum iss data ko ascending ya descending order mai laga sakte hai jisse aapko dhundne mai zyada time nhi lagega.
Toh hum isko ascending order mai present karenge.
12,23,24,27,32,34,56,58,78,87
Toh abh aap easily bta sakte hai ki lowest marks 12 hai aur highest marks 87 hai.
The difference of the highest and the lowest values in the data is called the range of the data.
So, the range in this case is 87−12=65 .
Agar hum iss data ko ascending ya descending order mai table mai present karte hai to ye ungrouped frequency distribution table kehlayega.
Large amount data ko represent karne ke liye hum aise groups banate hai
20−29,30−39,40−49
Inhe class ya class - interval kehte hai.
In 20−29, 20 is lower class limit and 29 is upper class limit<b>.<br>Aisetab≤kogroupedequencydistributionkehtehai.<br>Agarervalcont∈uousnahihaijaiseki31 - 35and36 - 40.<br>Tohaaiyeisecont∈uousbanatehai.<br>Thelowerlimitof36 - 40=36<br>Theupperlimitof31 - 35=35<br>Thed⇔erence=36 – 35=1<br>So,halfthed⇔erence=1/2=0.5<br>Sothe≠wervalformedom31 - 35 is(31 – 0.5) - (35 + 0.5),i.e.,30.5 - 35.5.<br>Similarly,the≠wormedomthe36 - 40is(36 – 0.5) - (40 + 0.5),i.e.,35.5 - 40.5.
Example 3
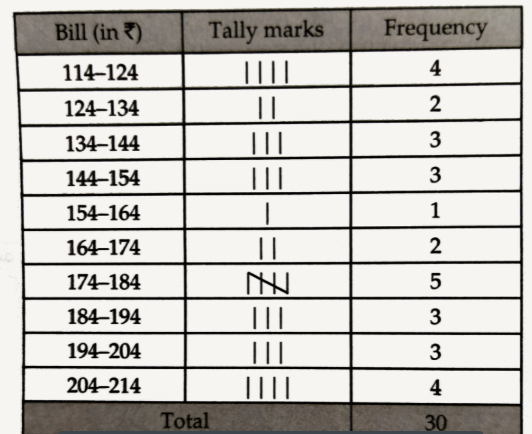
The water-tax bills (in rupee) of 30 houses in a locality are given below:
144,184,130,195,132,134,196,114,212,174,
188,210,202,145,175,154,174,178,166,146,
135,115,120,114,140,188,179,166,210,208.
Construct a frequency distribution table with class size 10.
The minimum observation is 114 and the maximum observation is 212.
∴range=(212−114)=98
Class size =
10.
Since 9810 = 9.8, we should have 10 classes, each of size 10.
The class of equal size, converging the above data are:
114-124, 124-134, 134-144, 144-154, 154-164, 164-174, 174-184, 184-194, 194-204 and 204-214
The frequency distribution table may be presented as shown below:
Example 4
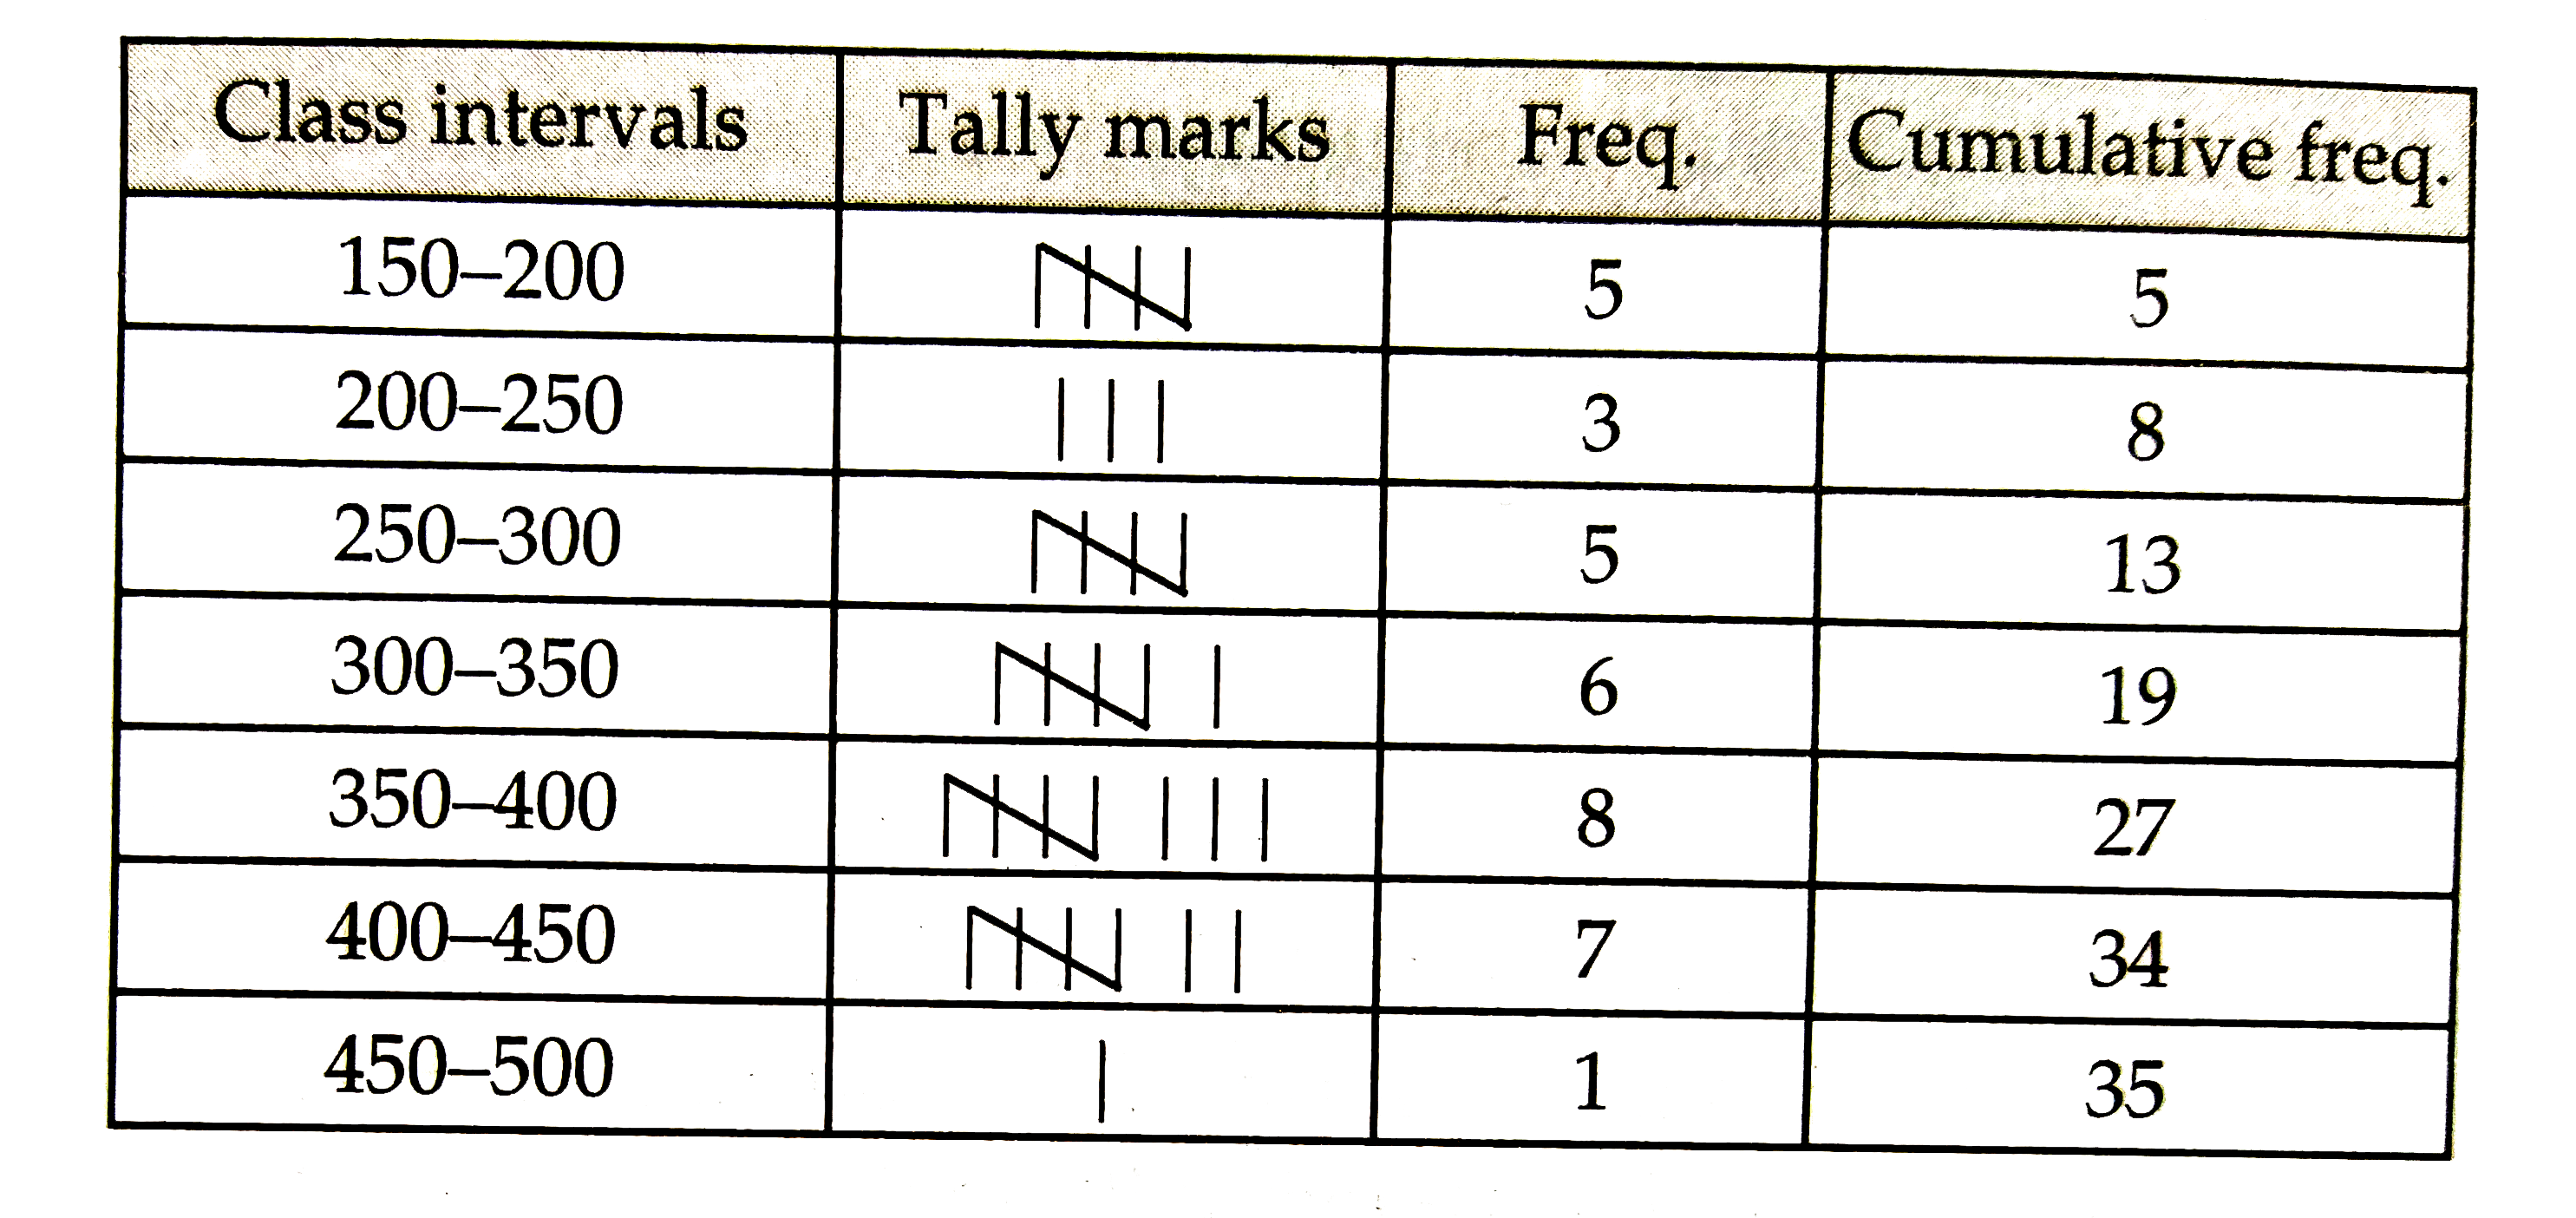
The marks obtained by 35 students in an examination are given below:
370,290,318,175,170,410,378,
405,380,375,315,305,325,275,
241,288,261,355,402,380,178,
253,428,240,210,175,154,405,
380,370,306,460,328,440,425
Form a cumulative frequency table with class intervals of length 50.
The minimum marks are 154 and the maximum marks are 460. So, we take the class intervals of length 50 as 150-200, 200-250, 250-300,…450-500. Thus, we may form the cumulative frequency table as under.
Graphical representation of data
Humne previous section mai table par present karna sikha tha. Abh hum graph par present karna sikhenge.
There are following ways to represent on graph.
(A) Bar Graph, (B)Histograms, (C)Frequency polygons
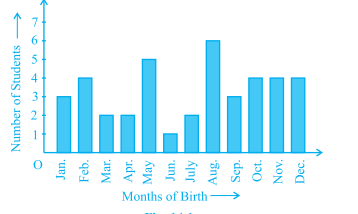
(A) Bar Graph : A bar graph is a chart that plots data using rectangular bars or columns.
Aapne earlier classes mai bhi bar graphs ke construction ke bare mai padha hai. Toh bas ushe hi aur formal way mai hum aage padhenge.
Hum uniform width ke bars draw karenge axes par ( say, x - axis), inn bars ke beech equal distance hona chahiye.
Aur ye variable ko depict karte hai.
The values of the variable are shown on the other axis (say, the y-axis) and the heights of the bars depend on the values of the variable.
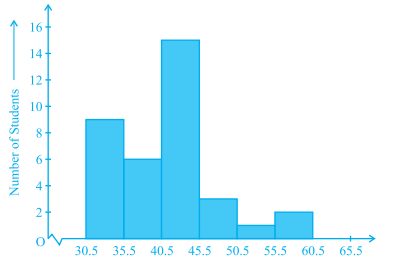
(B) Histograms : This is a form of representation like the bar graph, but it is used for continuous class intervals.
Histogram mai bars ke beech mai distance nhi hota. Par bars ki width equal honi chahiye.
Histogram ka use grouped frequency distribution ko represent karne ke liye hota hai.
Aur class intervals continuous hone chahiye.
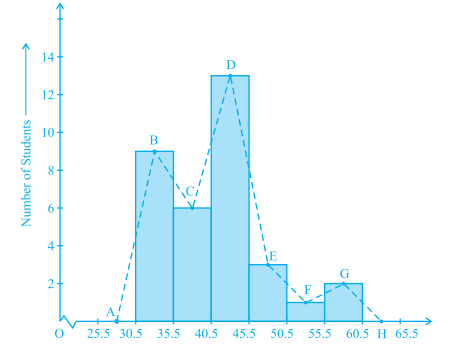
(C) Frequency polygon : A frequency polygon is constructed by connecting all midpoints of the top of the bars in a histogram by a straight line without displaying the bars.
Frequency polygon ke liye sabse pehle histogram ke bars par mid point mark lijiye. Abh hum mid point ko ek dusre se jod lenge.
Frequency polygons can also be drawn independently without drawing histograms.
Iske liye hume class interval chahiye class marks nikalne ke liye, jaise 140−150,
upper limit = 150
lower limit = 140
So, for class marks = upper limit + lower limit2
= 150+1402
= 145.
Aise hi hum puri table ki class marks nikalenge aur un class marks ko draw kar lenge aur frequency polygon banane ke liye jod denge.
Frequency polygons are used when the data is continuous and very large.
Example 5
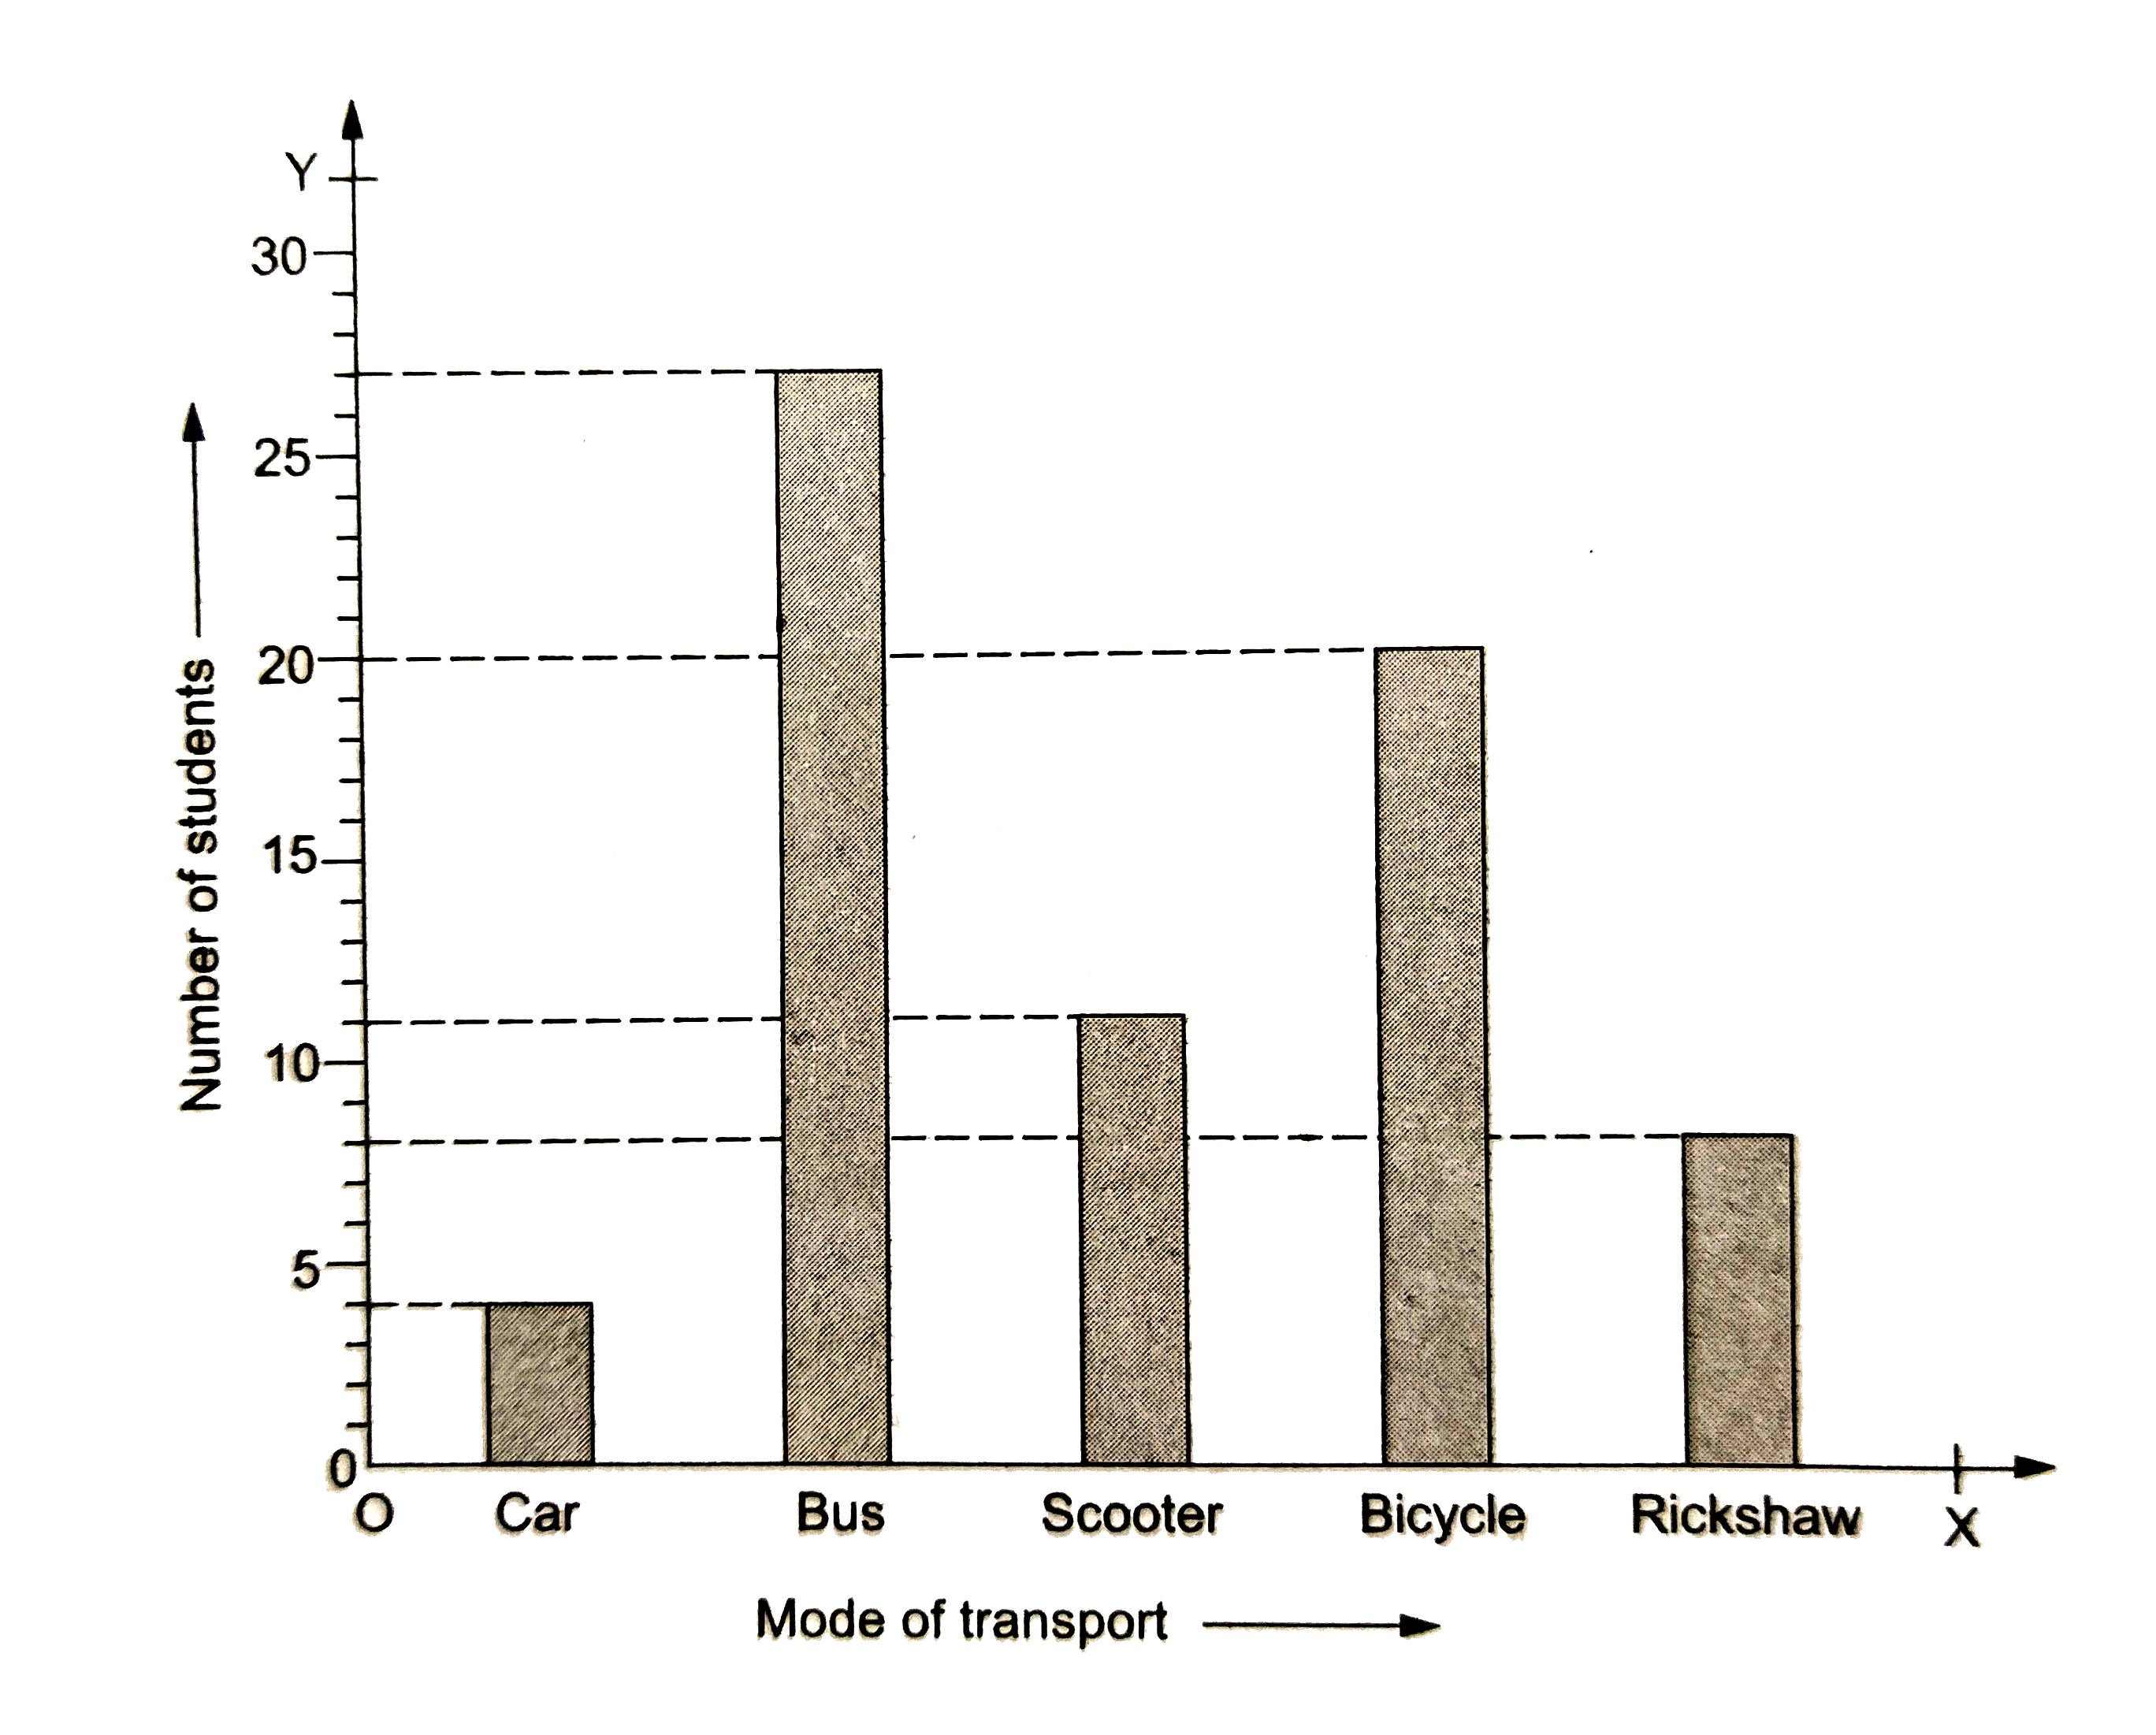
70 students from a locality use different modes of transport to go to school as given below:

Draw the bar graph representing the above data.
Take the mode of transport along the x-axis and the number of students along the y-axis. All the bars should be of the same width and same space should be left between the consecutive bars. These bars may be drawn as shown below:
Example 6
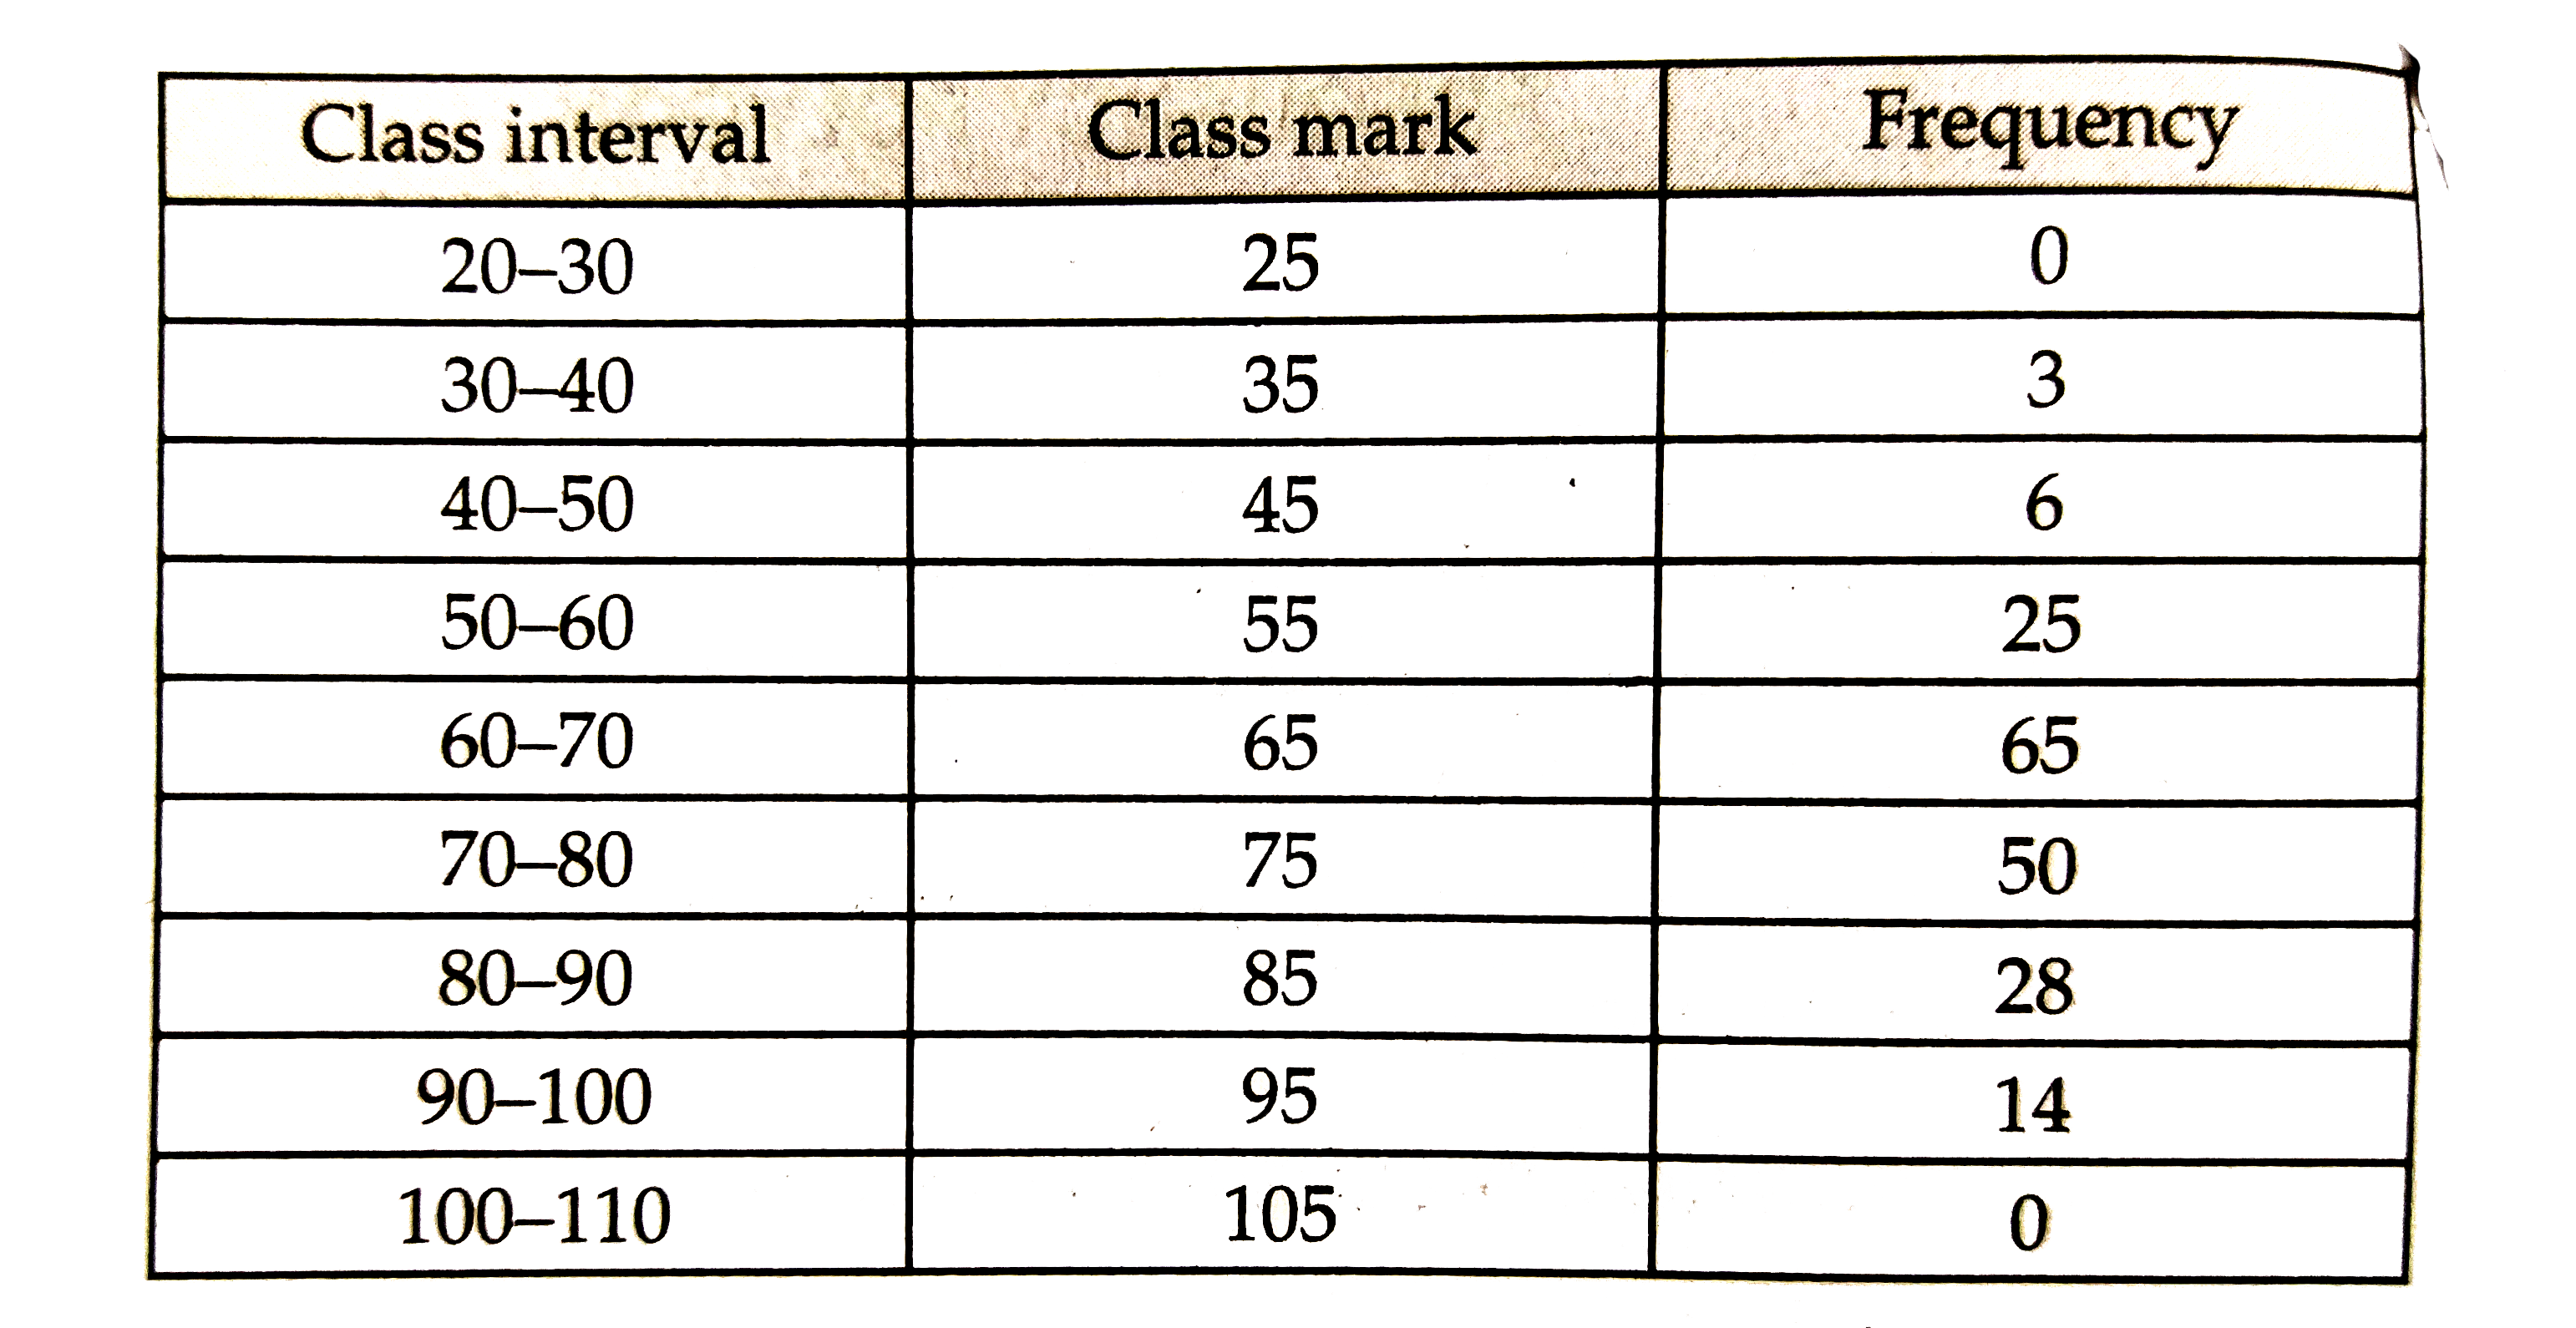
Following table shows a frequency distribution for the speeds of cars passing througha particular spot on a highway:

Draw a histogram and frequency polygon representing the above data.
Adding two more class intervals, namely 20-30 and 100-110, each with frequency 0, we have the frequency distribution table as under:
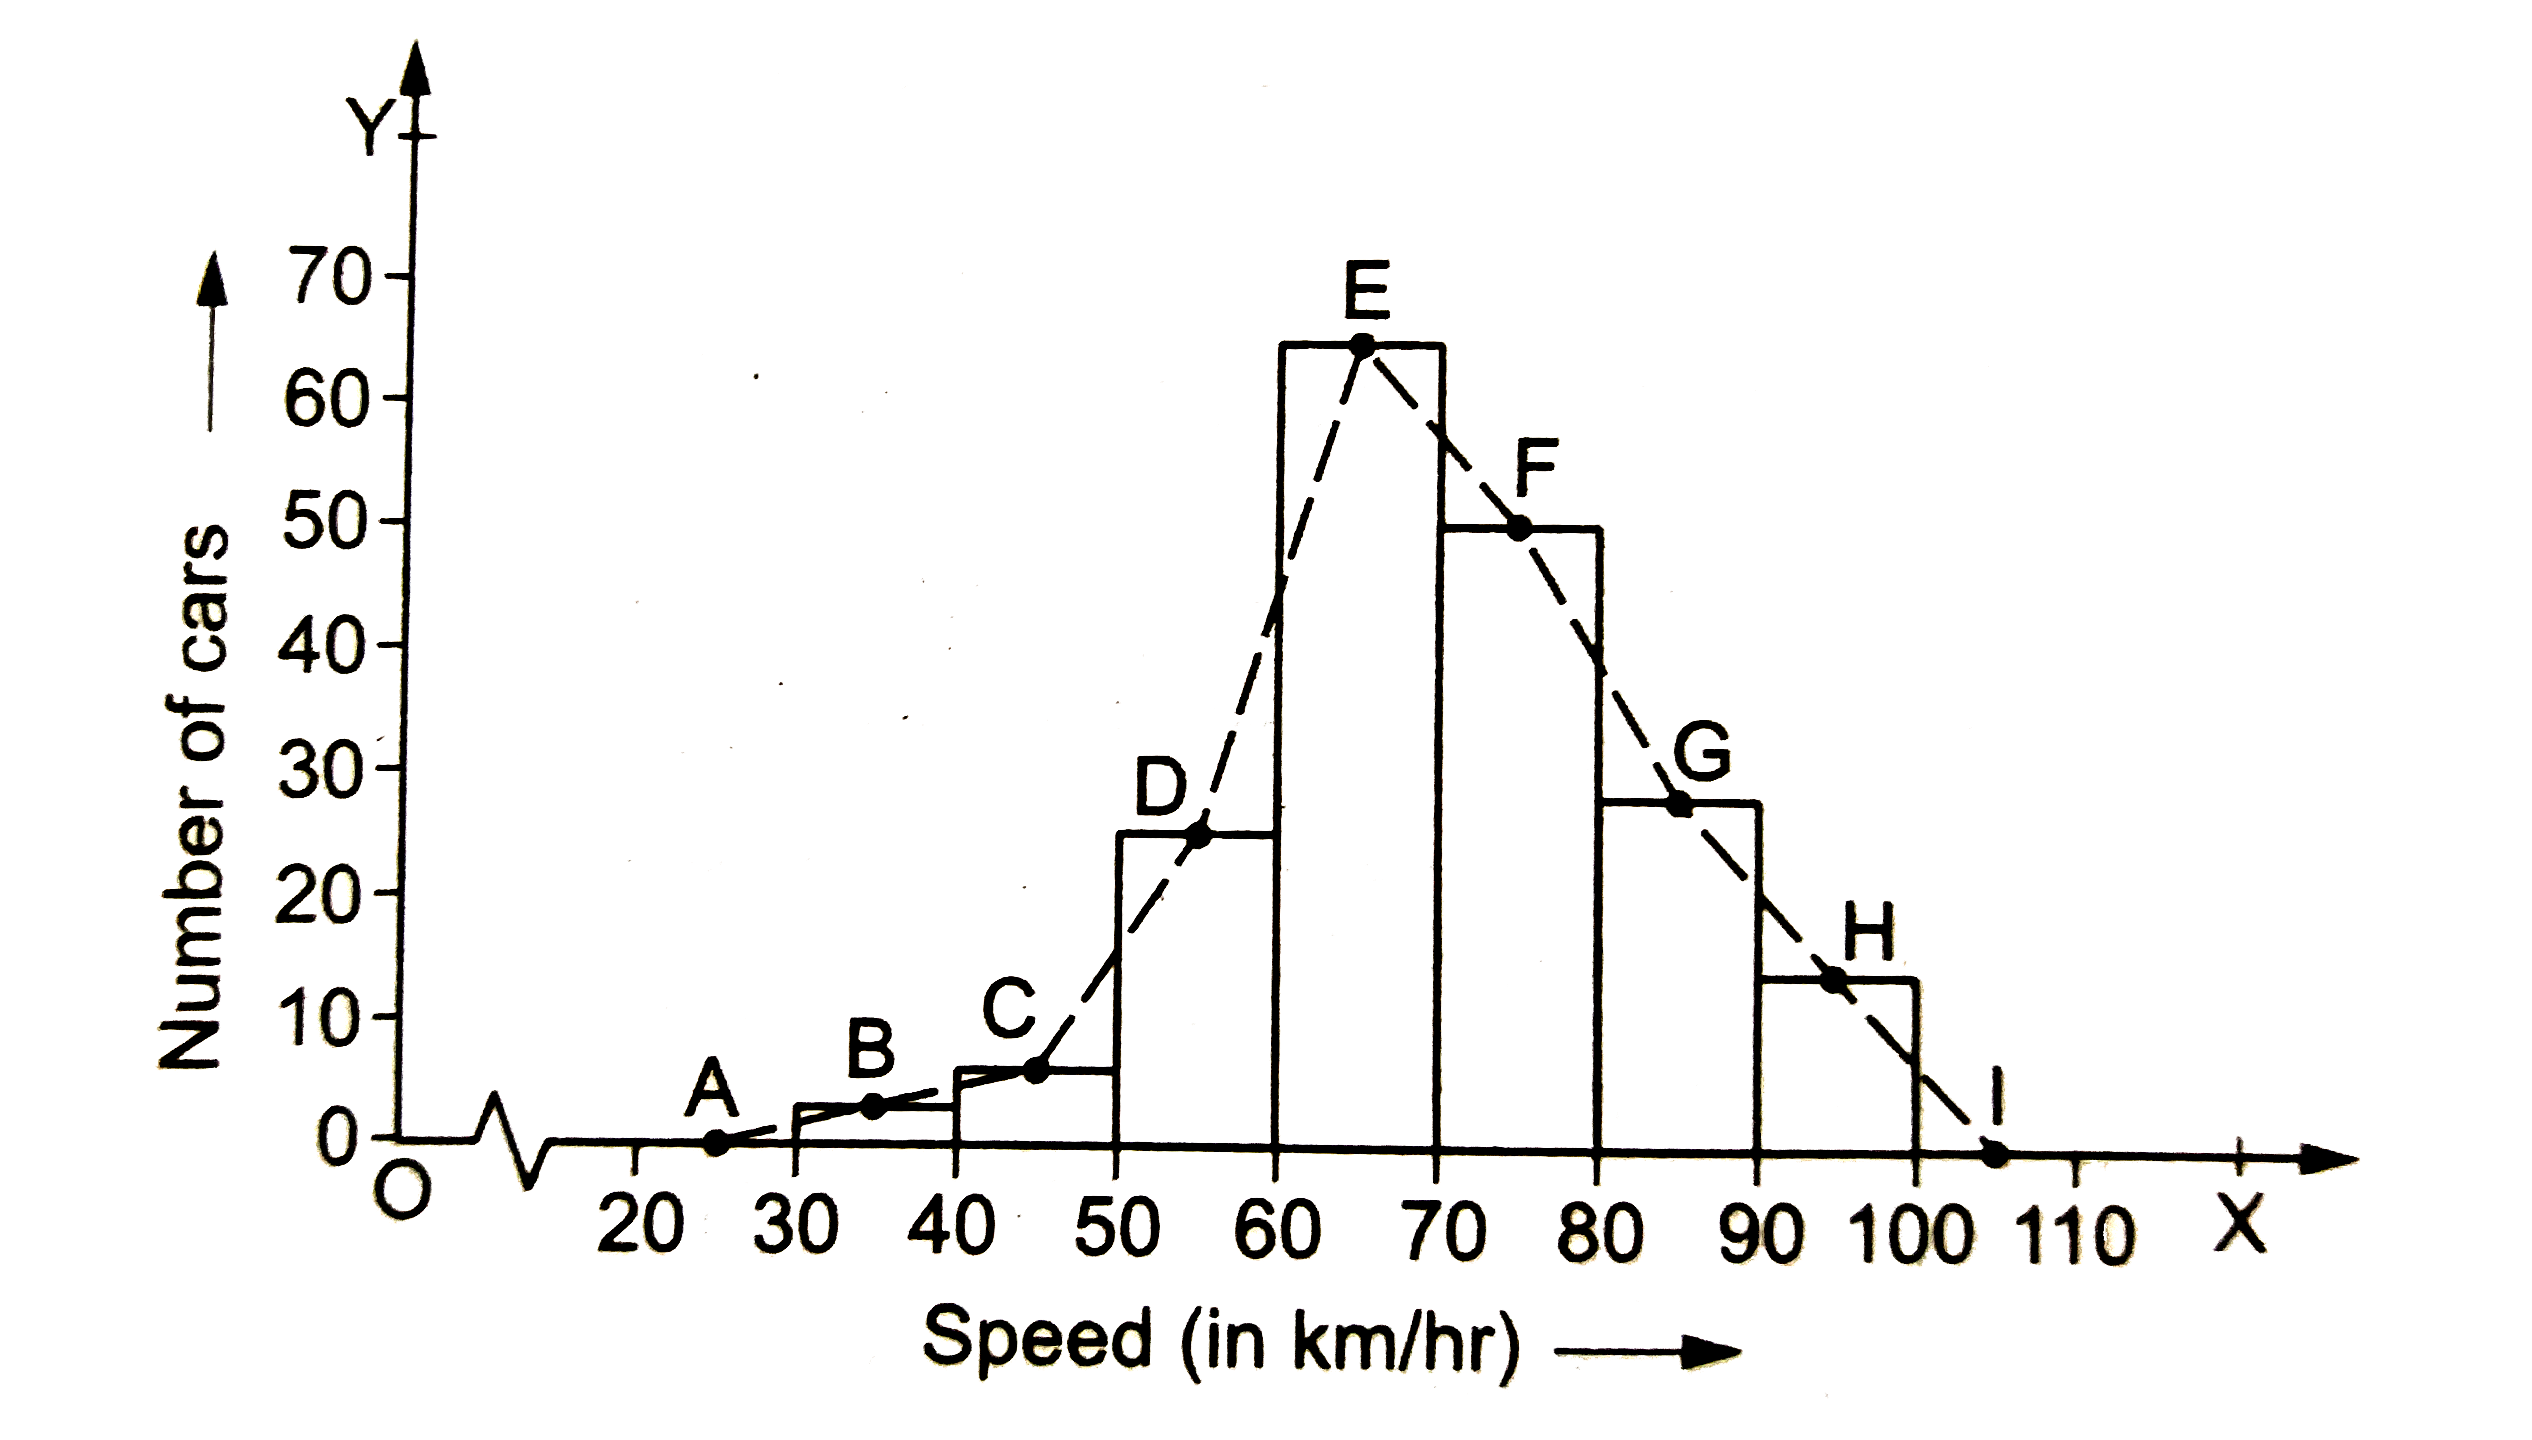
We represent the class intervals along the x-axis on a suitable scale and the corresponding frequencies along the y-axis on another suitable scale. We construct rectangles with class intervals as the bases and the respective frequencies as the heights.
Thus, we obtain the histogram, shown below. We take the imagined classes 20-30 and 100 110, each with frequency 0.
Now, we plot the points A(25, 0), B(35, 3), C(45, 6), D(55, 25), E(65, 65), F(75, 50), G(85, 28), H(95, 14) and I(105, 0). Joining these points in pairs successively, we obtain the required frequency polygon ABCDEFGHI, as shown below.
Measures of Central Tendency
Humne pehle padha hai ki kaise data ko various forms mai represent kar sakte hai. Abh hum dekhenge ki hum kuch aur important features se bhi isko represent kar sakte hai.
(i) Mean : The mean is the average or the most common value in a collection of numbers.
It is denoted by the symbol ¯x.
Formula,
= Sum of all the observationsTotal number of observations
Hum mean ko example ke through dekhenge.
Humne 5 students ke test marks ka data liya h.
10, 7, 13, 15, 20
x1=10,x2=7,x3=13,x4=20andx5=15
According to the formula
=Sum of all the observationsTotal number of observations
= x1+x2+x3+x4+x55
= 10+7+13+20+155
= 13
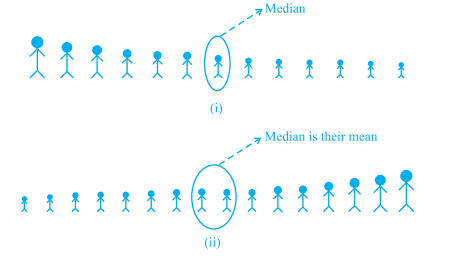
(ii) Median : The median is the middle number in a sorted, ascending or descending.
(i) When the number of observations (n) is odd, the median is the value of the (n+12)th observation. For example, if n=13, the value of the (13+12)th, i.e., the 7th observation will be the median.
(ii) When the number of observations (n) is even, the median is the mean of the (n2)th and ((n2)+1)th observations. For example, if n=16, the mean of the values of the (162)th and ((162)+1)th observations, i.e., the mean of the values of the 8th and 9th observations will be the median.
(iii) Mode : The mode is the value that appears most frequently in a data set. A set of data may have one mode, more than one mode, or no mode at all.
Find the mode of the following marks (out of 10) obtained by 20 students:
4, 6, 5, 9, 3, 2, 7, 7, 6, 5 ,
4, 9, 10, 10, 3, 4, 7, 6, 9, 9
We arrange this data in the following form :
2, 3, 3, 4, 4, 4, 5, 5, 6, 6,
6, 7, 7, 7, 9, 9, 9, 9, 10, 10
Here 9 occurs most frequently, i.e., four times. So, the mode is 9.
Example 7
The mean of 25 observation is 36. Out of these observations, if the mean of first 13 observations is 32 and that of the last 13 observations is 40, the 13th observation is
Mean of 25 observations =(36×25)
=900
Sum of 25 observations =(36×25)
=900
Mean of first 13 observations = 32.
Sum of first 13 observations =(32×13)
=416
Mean of last 13 observations = 40
Sum of last 13 observations =(40×13)
=520
13th observation
= ( sum of first 13 observations) + ( sum of last 13 observations) - ( sum of 25 observations )
=(416+520)−(900)
=936−900
=36
Example 8
The mean of 16 numbers is 8. If 2 is added to every number, what will be the new mean?
Let the given numbers be x1,x2,x3,….,x16
Then , the mean of these numbers = x1+x2+x3+….+x1616
= x1+x2+x3+….+x1616=8
⇒(x1+x2+x3+….+x16)=128
The new numbers are (x1+2),(x2+2),(x3+2),.....,(x16+2)
mean of the new numbers
(x1+2)+(x2+2)+(x3+2)+.....+(x16+2)16
(x1+x2+x3+....+x16)+3216=(128+32)16
16016=10
Hence, the new mean is 10.
Summary
In this chapter, you have studied the following points:
- Facts or figures, collected with a definite purpose, are called data.
- Statistics is the area of study dealing with the presentation, analysis and interpretation of data.
- How data can be presented graphically in the form of bar graphs, histograms and frequency polygons.
- The three measures of central tendency for ungrouped data are:
(i) Mean : It is found by adding all the values of the observations and dividing it by the total number of observations. It is denoted by ¯x
So, ¯x= ∑ni=1xin .For an ungrouped frequency distribution, it is ¯x = ∑ni=1fixi∑ni=1fi
(ii) Median : It is the value of the middle -most observation (s).
If n is an odd number, the median = value of the (n+12)th observation.
If n is an even number, median = Mean of the values of the (n2)th and (n2+1)th observations.
(iii) Mode : The mode is the most frequently occurring observation.
