Find the diagram that show right relation between CAR WOOD and Mouse?
1 A
2 B
3 C
4 D
Answer : 2. "B"
Related Solutions
The data related to the production of type D cars is represented by a circular diagram, then the central angle of the segment showing the production of cars in 2015 will be
View SolutionIdentify the diagram that best represents the relationship between the given classes.
car Wood, Rat
View SolutionDraw diagram to show the difference between right lung and left lung.
View Solutionनीचे दिए गए विकल्पों में से संबंधित अक्षर ज्ञात कीजिए ।
MOUSE : KPSTC : : LIGHT : ?
View Solutionतालिका में विभिन्न प्रकार की कारों के उत्पादन को (हजारों में ) दर्शाया गया है।
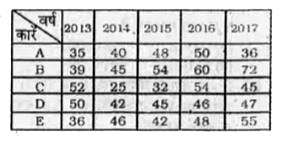
यदि B प्रकार की कारों के उत्पादन से संबंधित आँकड़ो को वृत्त आरेख (पाई चार्ट ) के द्वारा दर्शाया जाता है तो में कारों के उत्पादन को दर्शाने वाले आँकड़े का त्रिज्यखंड (सेक्टर ) का केन्द्रीय कोण होगा :
View SolutionThe diagrams given below represent the relationship between a mouse and a physiological process that occurs in green plants. Study the diagrams and answer the questions that follow
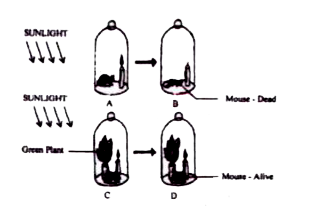
Why did the mouse die in bell jar B?
View SolutionThe diagrams given below represent the relationship between a mouse and a physiological process that occurs in green plants. Study the diagrams and answer the questions that follow Name the physiological process occurning in the green plant that has kept the mouse alive
View SolutionObserve the following diagram and find the relation between compound R S
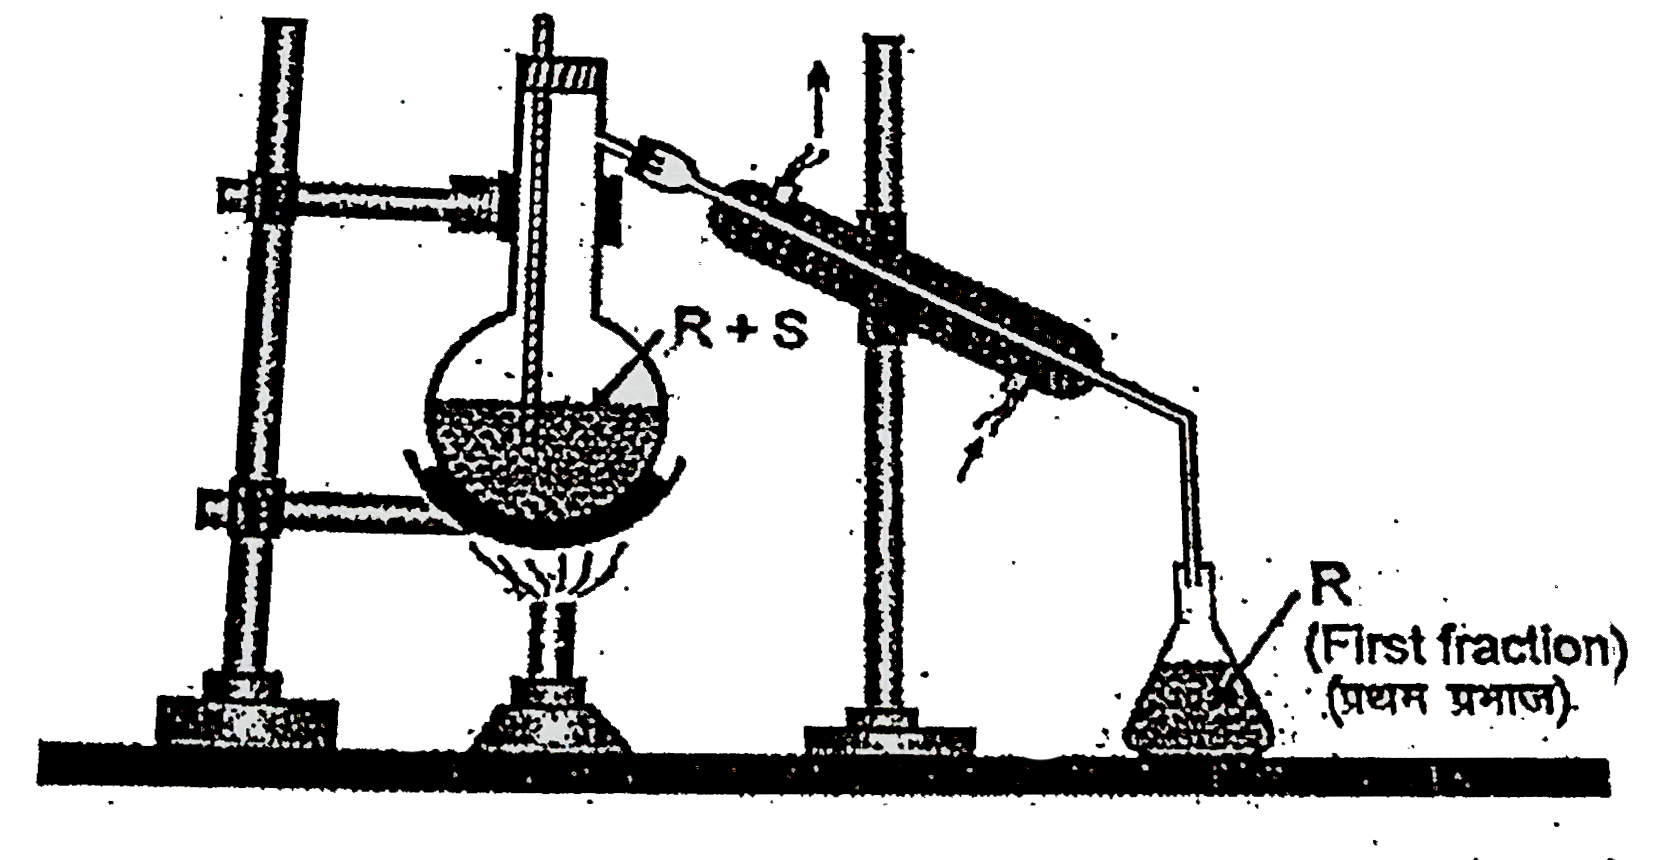
View SolutionObserve the following diagram and find the relation between compound R & S
View SolutionThe adjoining diagram shows a relation between the set A and B. Write this relation
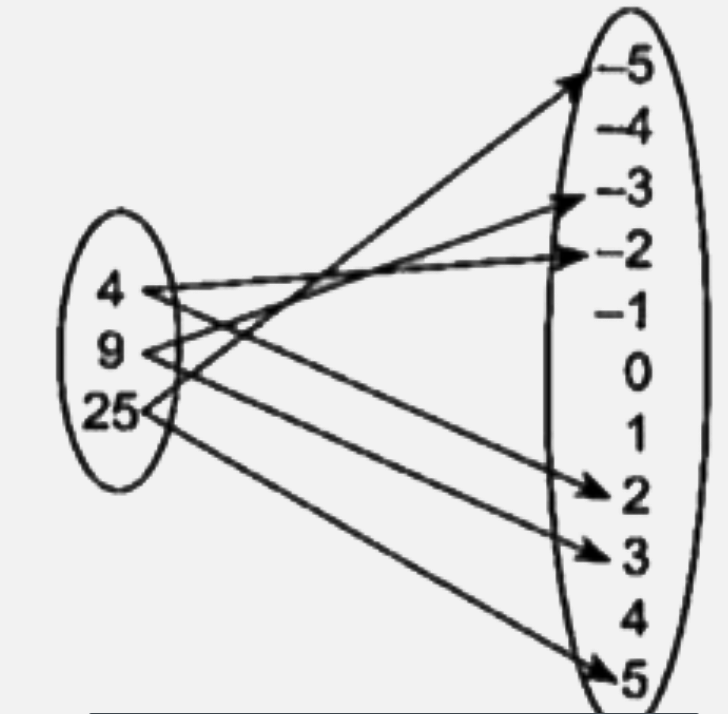
(i) In roster form
(ii) In set builder form
View SolutionWood, car, clock, chair
View SolutionGive the uses of right and left button of mouse.
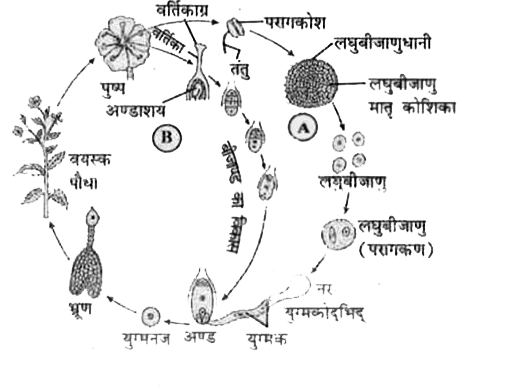
View Solutionदिए गए चित्र में एक प्रारूपिक आवृत्तबीजी के जीवन चक्र की दो प्रावस्थाओं A व B को दर्शाया गया है। इससे संबंधित सही विकल्प का चुनाव करो।
View Solutionनीचे दिया गया दंड आरेख किसी पार्किंग क्षेत्र में अलग -अलग दिनों में खड़ी कारों की संख्या को दर्शाता है।
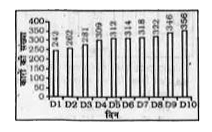
तथा में खड़ी कारों की संख्या का अंतर कितना है ?
View SolutionThe table shows the production (in thousands) of different types of cars. If the data relating to the production of type D cars is represented by a circle diagram (pie chart), then 2017 The central angle of the sector representing the production of cars in
View SolutionThe table shows the production (in thousands) of different types of cars. If the data relating to the production of type D cars is represented by a circle diagram (pie chart), then 2017 The central angle of the sector representing the production of cars in
View SolutionPhotoshop' is related to 'Software in the same way as 'Optical Mouse' is related to_______.
View Solution‘Photoshop’ is related to ‘Software’ in the same way as ‘Optical Mouse’ is related to ‘______’
View SolutionSelect the Venn diagram that best illustrates the relationship between the three given classes. Keyboard, Monitor, Mouse
View SolutionWhich of the following shows the correct relation between the spped (v) of a car and the time (t) taken by it to conver a particular distance?
View Solution