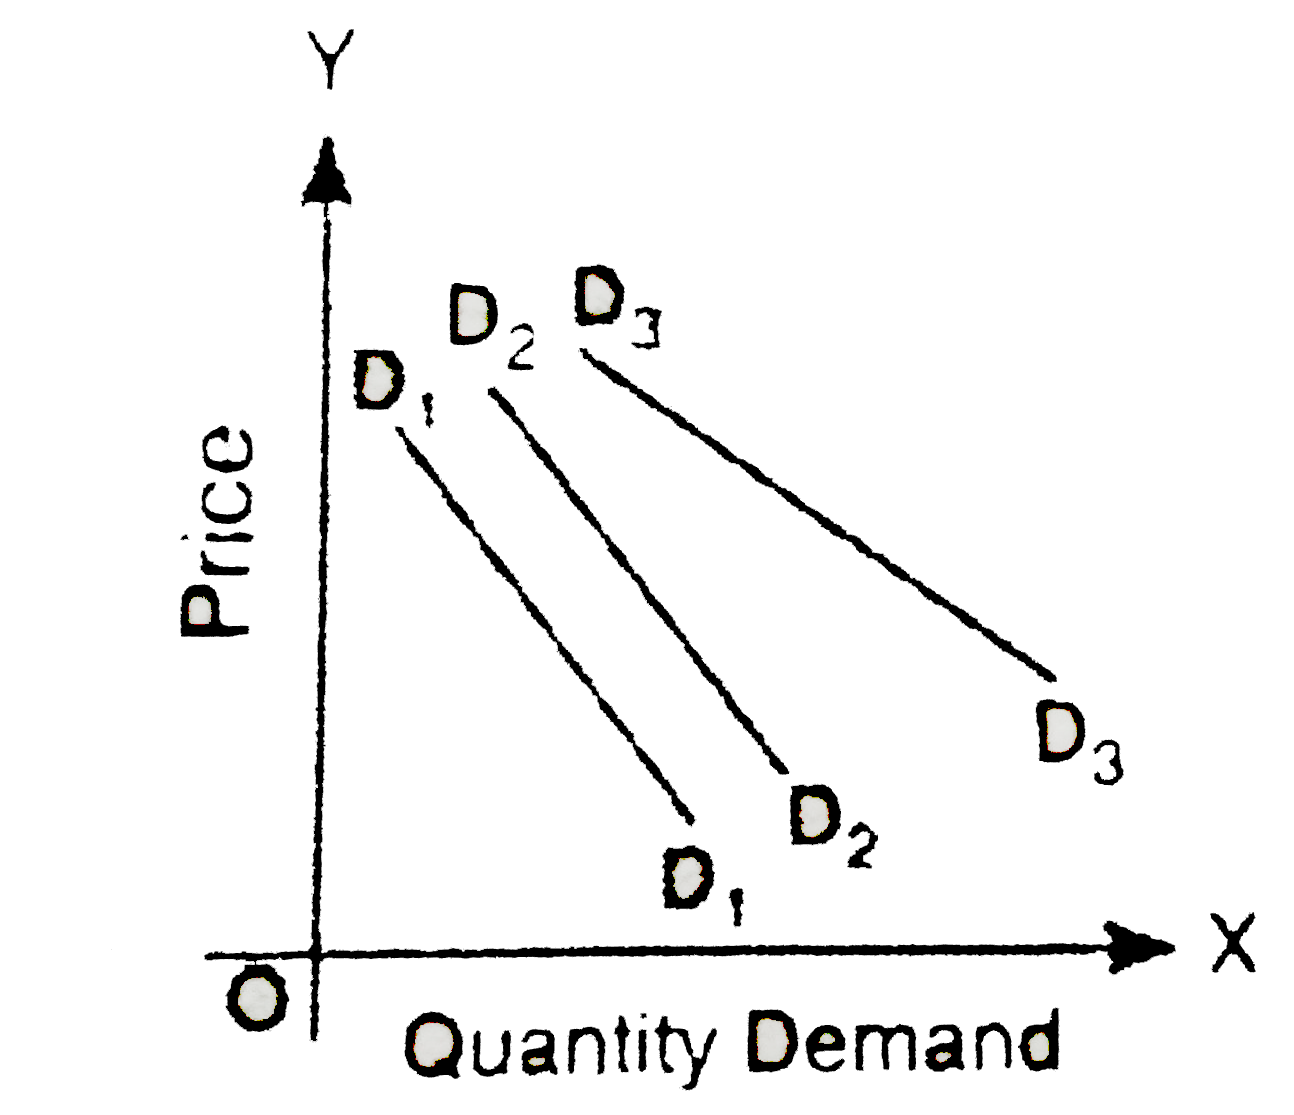
Graphically the market demand curve is
1 greater than the sum of the individual demand cu
2 the horizontal sum of individual demand curves
3 steeper than any individual demand curve that is
4 the vertical sum of individual demand curves
Answer : 2. "the horizontal sum of individual demand curves" Explanation :Answer: B) the horiz
Related Solutions
Market demand curve is a graphical presentation of market …..............
View SolutionIn which market structure the demand curve of the market is reflected by the demand curve of the firm?
View SolutionWhat is Market Demand curve?
View SolutionFind market demand from the following schedule and draw market demand curves:
View SolutionMarket demand curves is flatter than individual demand curves.
View SolutionMarket demand curve is obtained by ______ summation of the individual demand curves.
View SolutionMarket demand curve is obtained by vertical summation of individual demand curves.
View SolutionWhy market demand curve is flatter than individual demand curve ?
View SolutionMarket Demand Curve Is The Average Revenue Curve
View SolutionWhy market demand curve is flatter?
View SolutionWhich of the following represents market demand curve ?

View SolutionUnder which market form, the demand curve is steeper as compared to monopolistic com
View SolutionIn which market form does a firm face a perfectly elastic demand curve?
View SolutionIdentify the market form which has indeterminate demand curve:
View SolutionDiscuss the primary reason for'indeterminateness of demand curve' under the oligopoly form of market
View SolutionDraw a demand curve in different market situation and also compare its elasticity of demand.
View SolutionShow the construction of individual and market demand schedule and curve when there are two households in the market.
View SolutionWhat is market demand for a good? Name the factors determining market demand.
View SolutionWhat is 'market' demand ? State four factors causing 'increase' in market demand.
View SolutionExplain the chain effects on demand, supply and price of a commodity caused by a leftward shift of a demand curve. Use diagram. OR A product market is in equilibrium. Suppose the demand for the product decreases. What changes will take place in the market? Use diagram.
View Solution