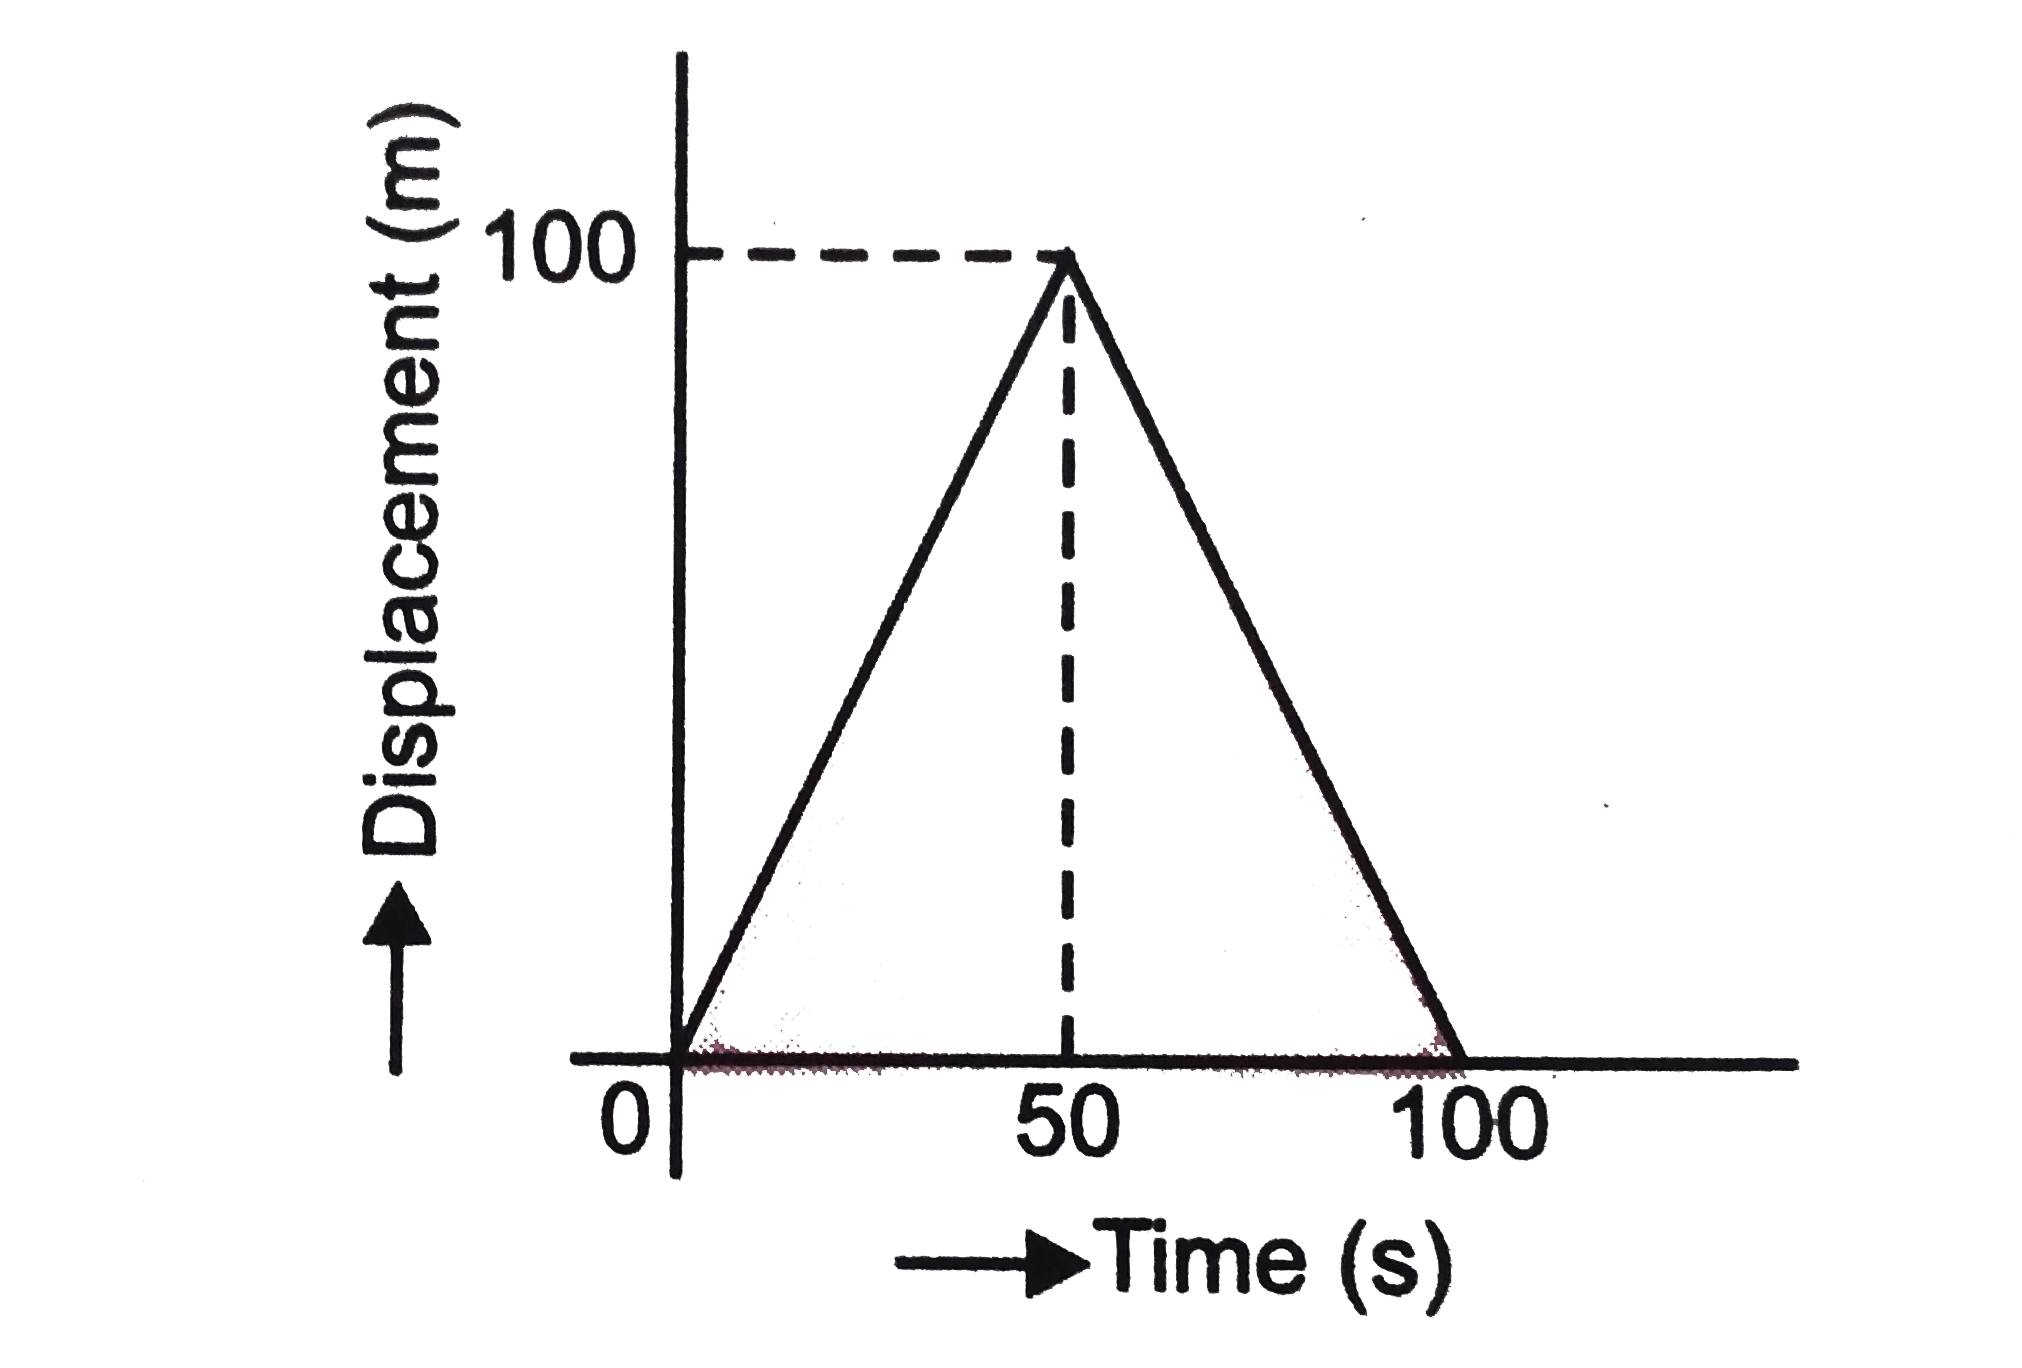
A girl walks along a straight path to drop a letter in the letterbox and comes back to her initial position. Her displacement–time graph is shown in Fig.8.4. Plot a velocity–time graph for the same.
Related Solutions
A girl walks along a straight path to drop a letter in the letterbox and comes back to her initial position. Her displacement-time graph is shown in Figure. Plot a velocity-time graph for the same.
View SolutionA girl walks along a straight path to drop a letter in the letterbox and comes back to her initial position. Her displacement-time graph is shown in Figure. Plot a velocity-time graph for the same.
 View Solution
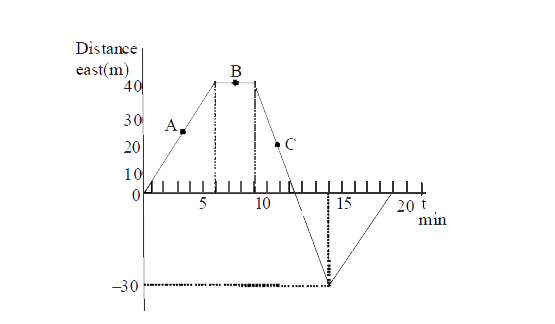
A girl walks along an east-west street, and a graph of her displacement from home is as shown in figure. Her average velocity for the whole time interval is-
 View Solution
A girl walks from her house on a straight path to drop a letter in the letter-box. Then she returns to the origin point. Her displacementtime graph is shown in the figure, draw its velocity-time graph.
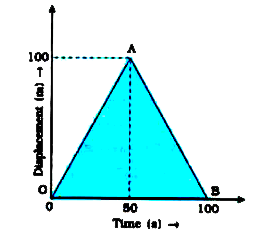
Slope of the graph OA = Velocity
Slope of the graph AB = Velocity
It is clear from the given displacement-time graph that the girl moves with constant positive velocity v from O to A. At point A for a moment her velocity becomes zero and moves back to origin (her house) at constant negative velocity by changing theView SolutionA girl walks from her house on a straight path to drop a letter in the letter-box. Then she returns to the origin point. Her displacementtime graph is shown in the figure, draw its velocity-time graph. to Slope of the graph OA = Velocity =(100-0)/(50-0)=+2ms^(-1) Slope of the graph AB = Velocity = (0- 100)/(100 - 50) =- 2ms ^(-1) to It is clear from the given displacement-time graph that the girl moves with constant positive velocity v from O to A. At point A for a moment her velocity becomes zero and moves back to origin (her house) at constant negative velocity by changing the
View SolutionThe graph of displacement vs time for a particle moving along a straight line is as shown. The best option for the corresponding velocity - time graph will be:
 View Solution
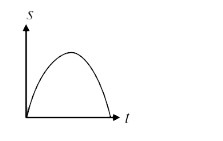
The graph of displacement vs time for a particle moving along a straight line is as shown. The best option for the corresponding velocity - time graph will be:
 View Solution
The velocity-time graph of a particle moving along a straight line is shown in Fig. The displacement of the body in 5 second is :
View Solutionचित्र में विस्थापन-समय ग्राफ प्रदर्शित किये गये हैं। इन ग्राफों की विवेचना कीजिए ।
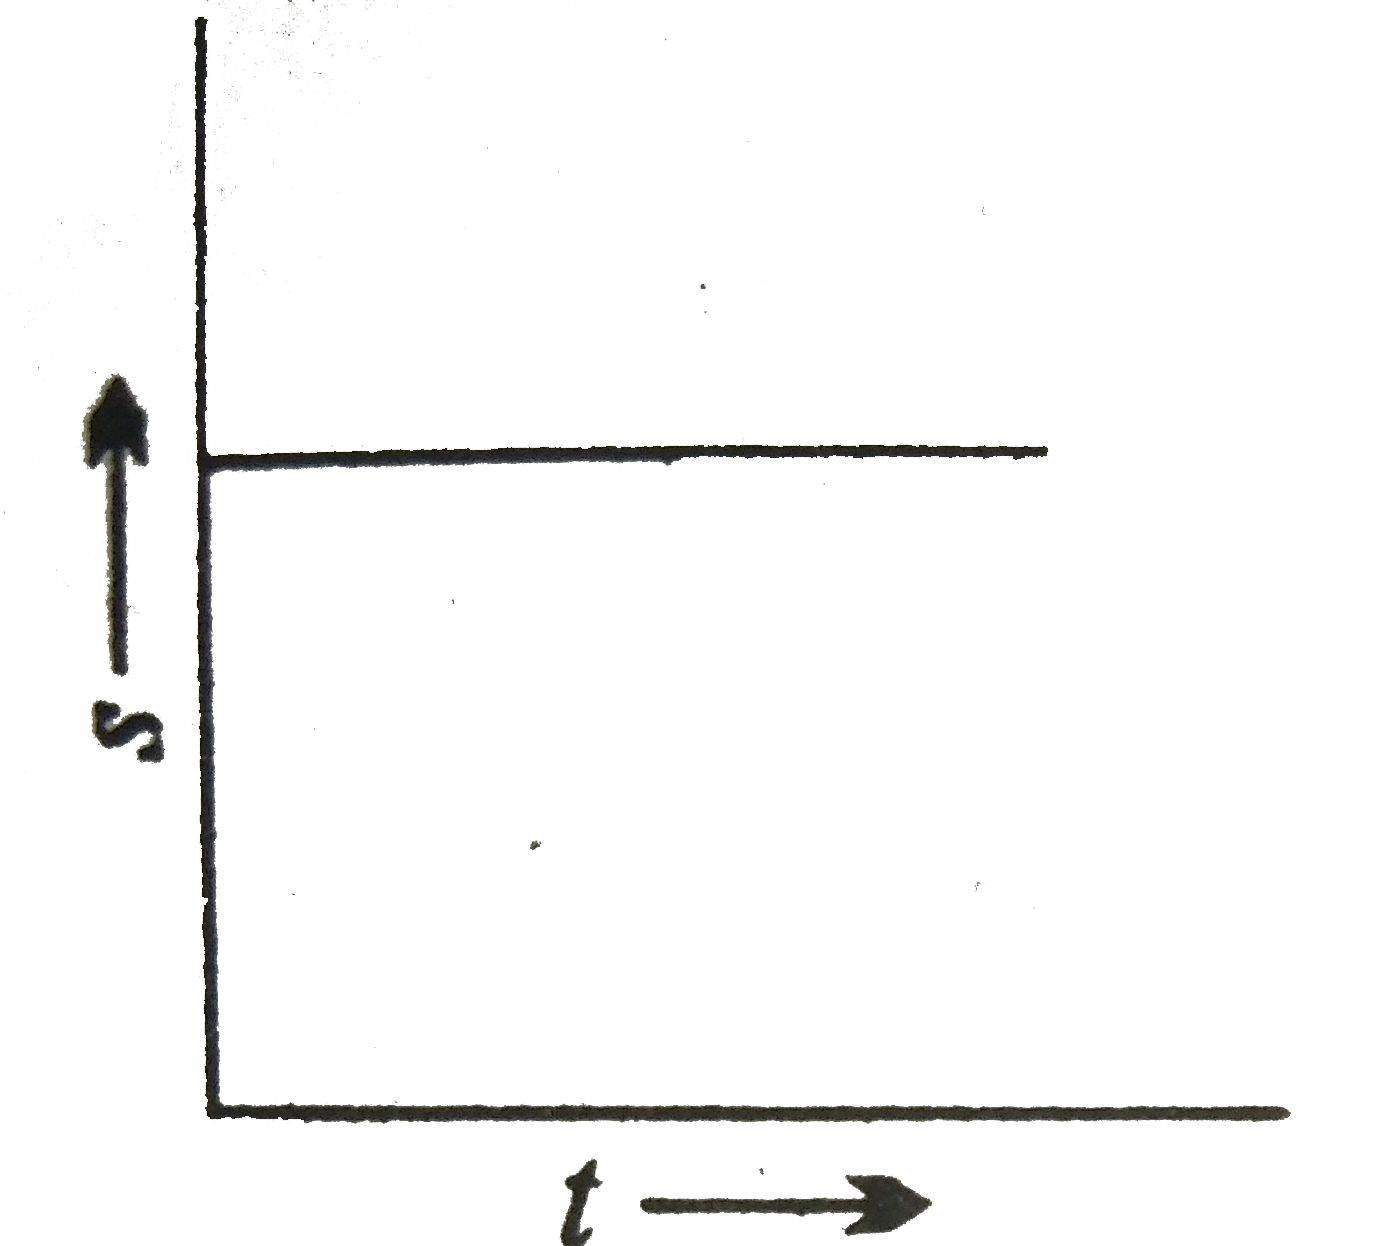 View Solution
चित्र में विस्थापन-समय ग्राफ प्रदर्शित किये गये हैं। इन ग्राफों की विवेचना कीजिए ।
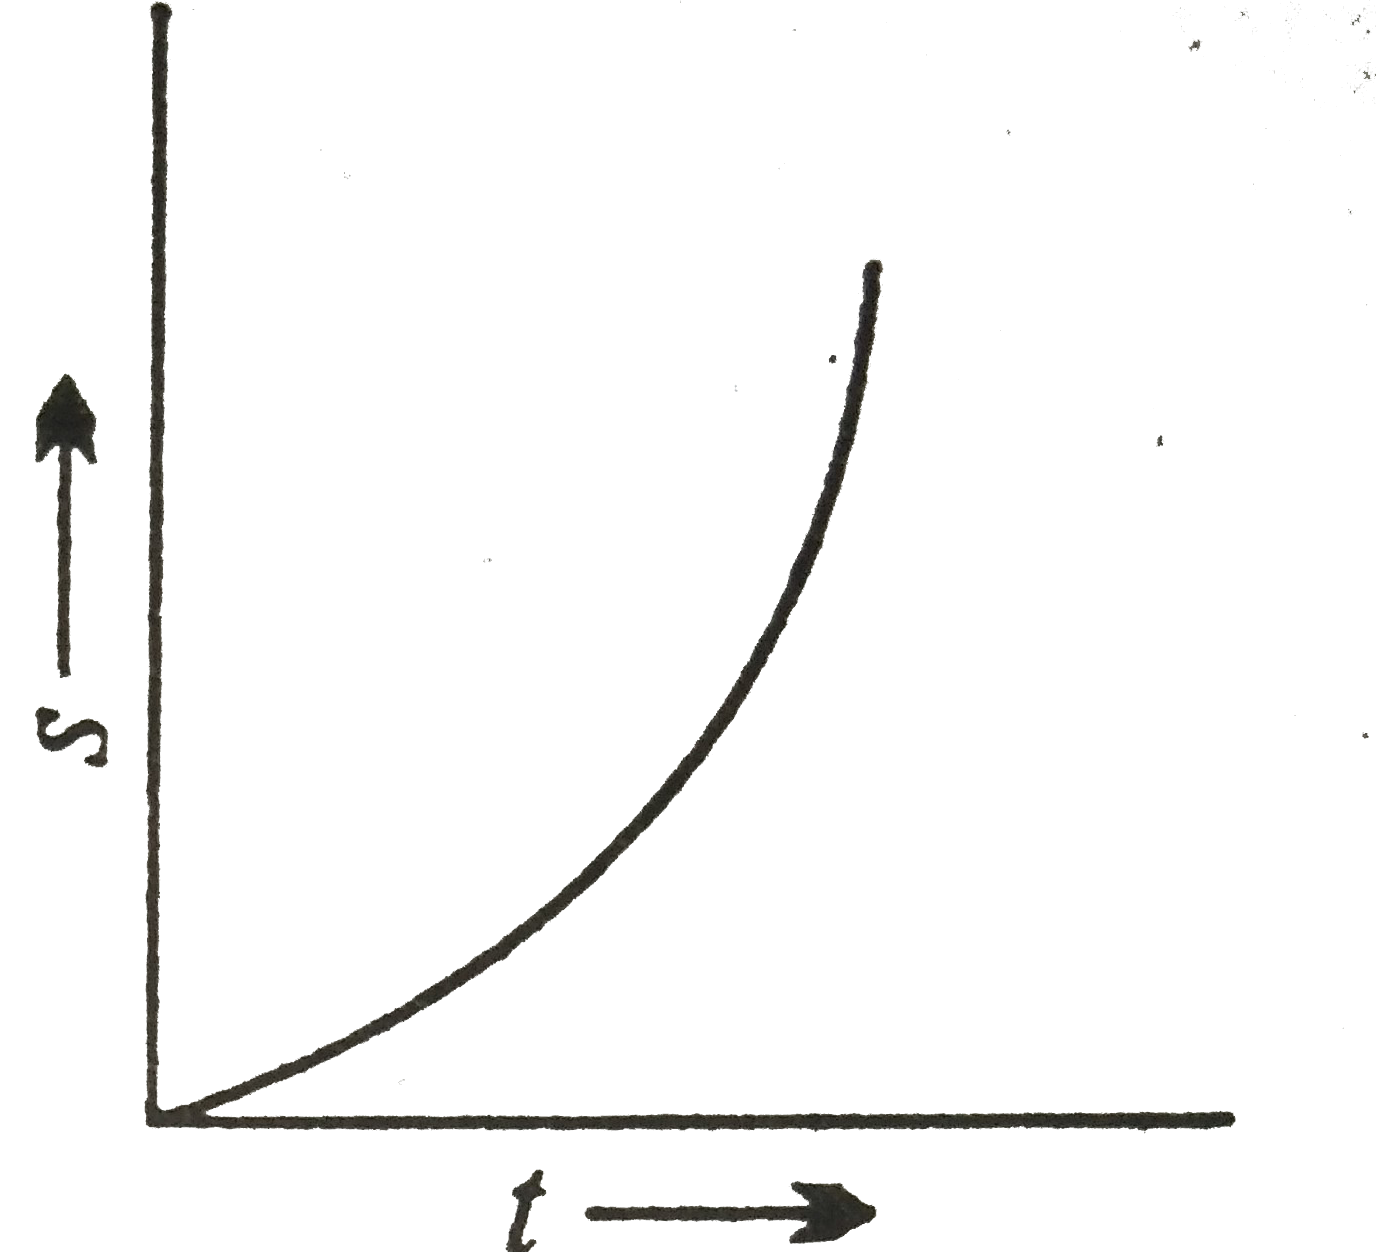 View Solution
चित्र में विस्थापन-समय ग्राफ प्रदर्शित किये गये हैं। इन ग्राफों की विवेचना कीजिए ।
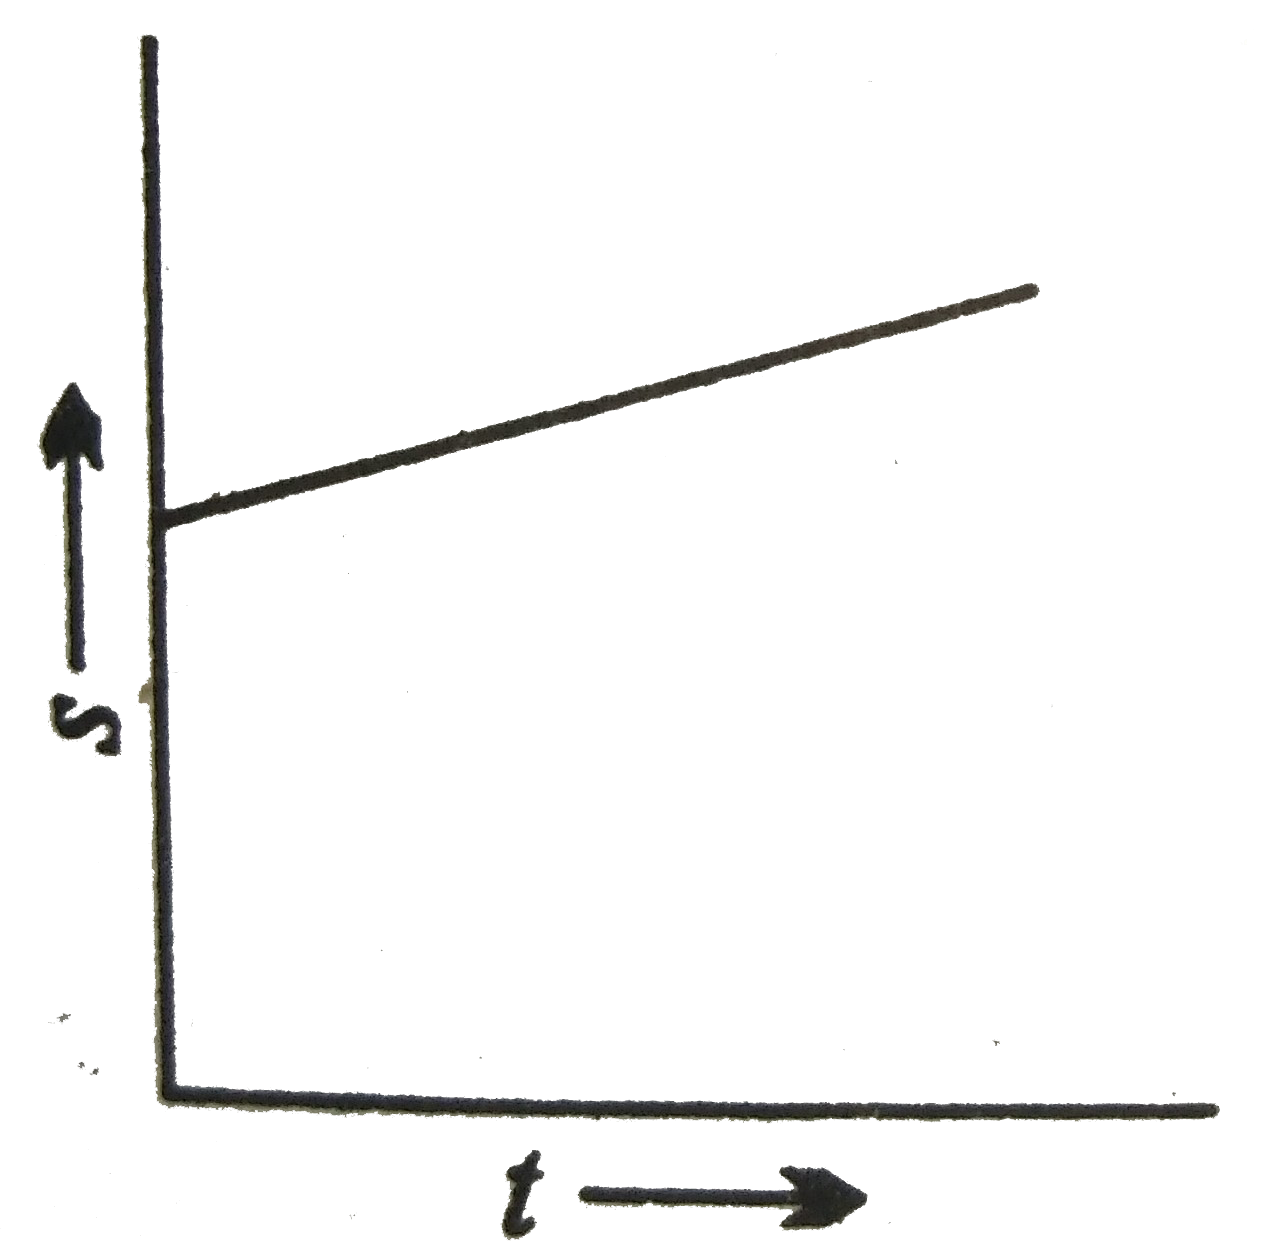 View Solution
चित्र में विस्थापन-समय ग्राफ प्रदर्शित किये गये हैं। इन ग्राफों की विवेचना कीजिए ।
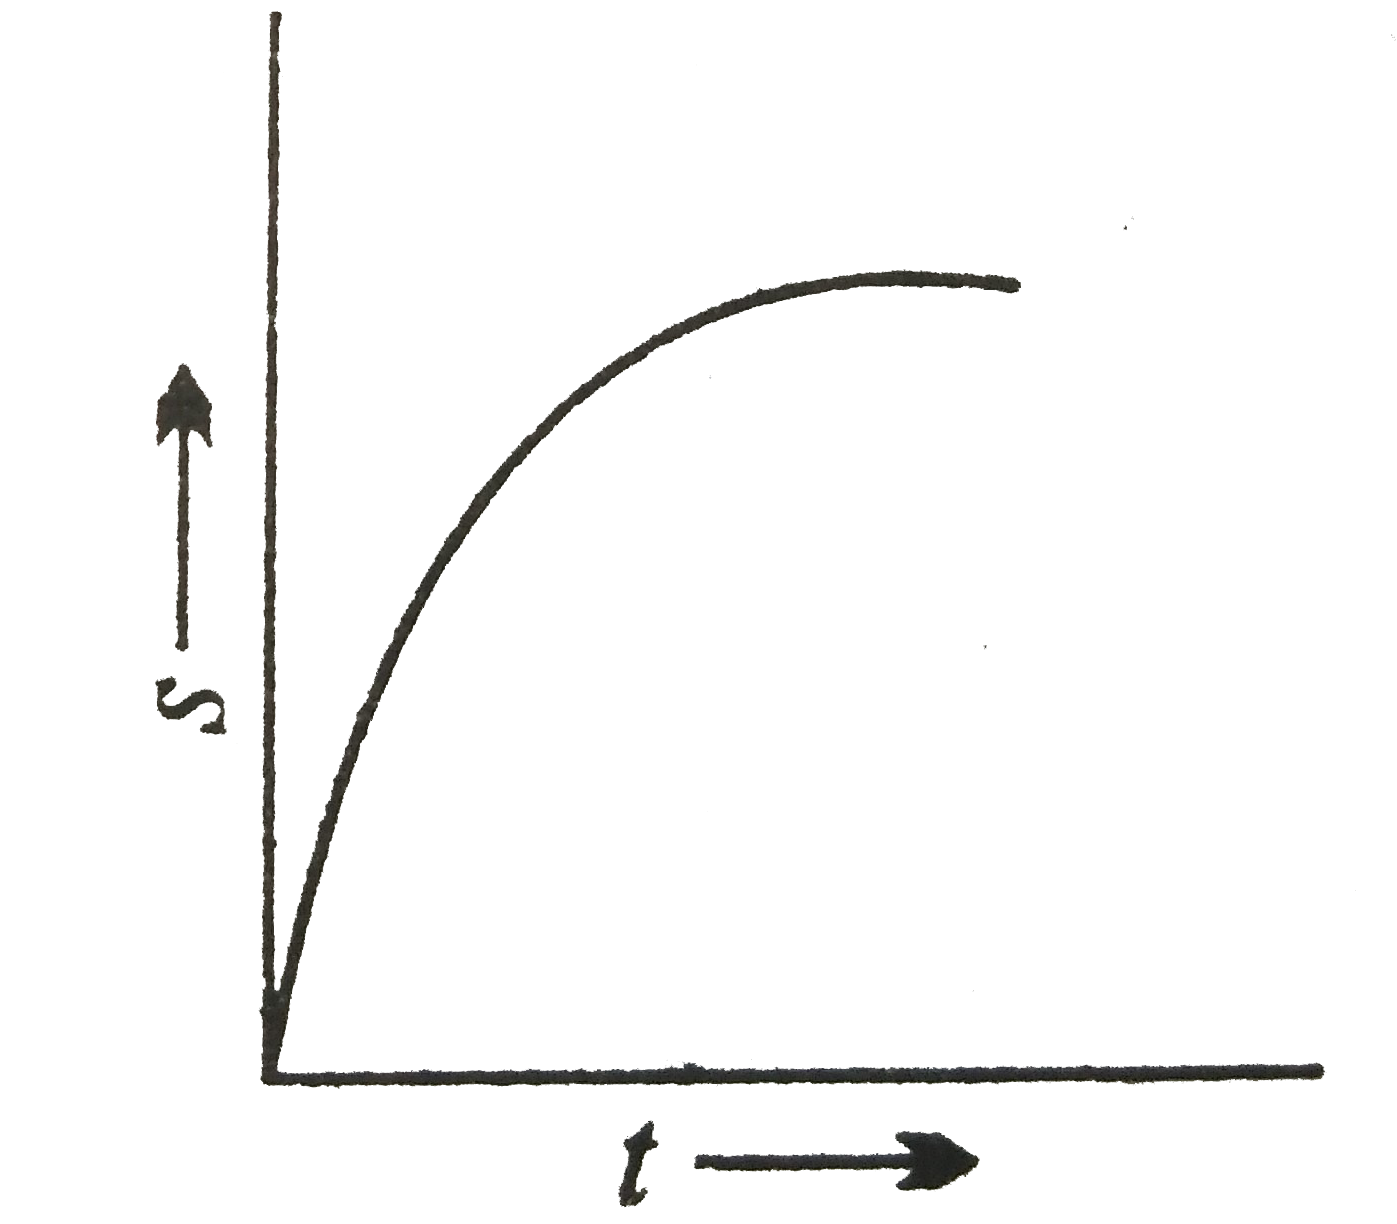 View Solution
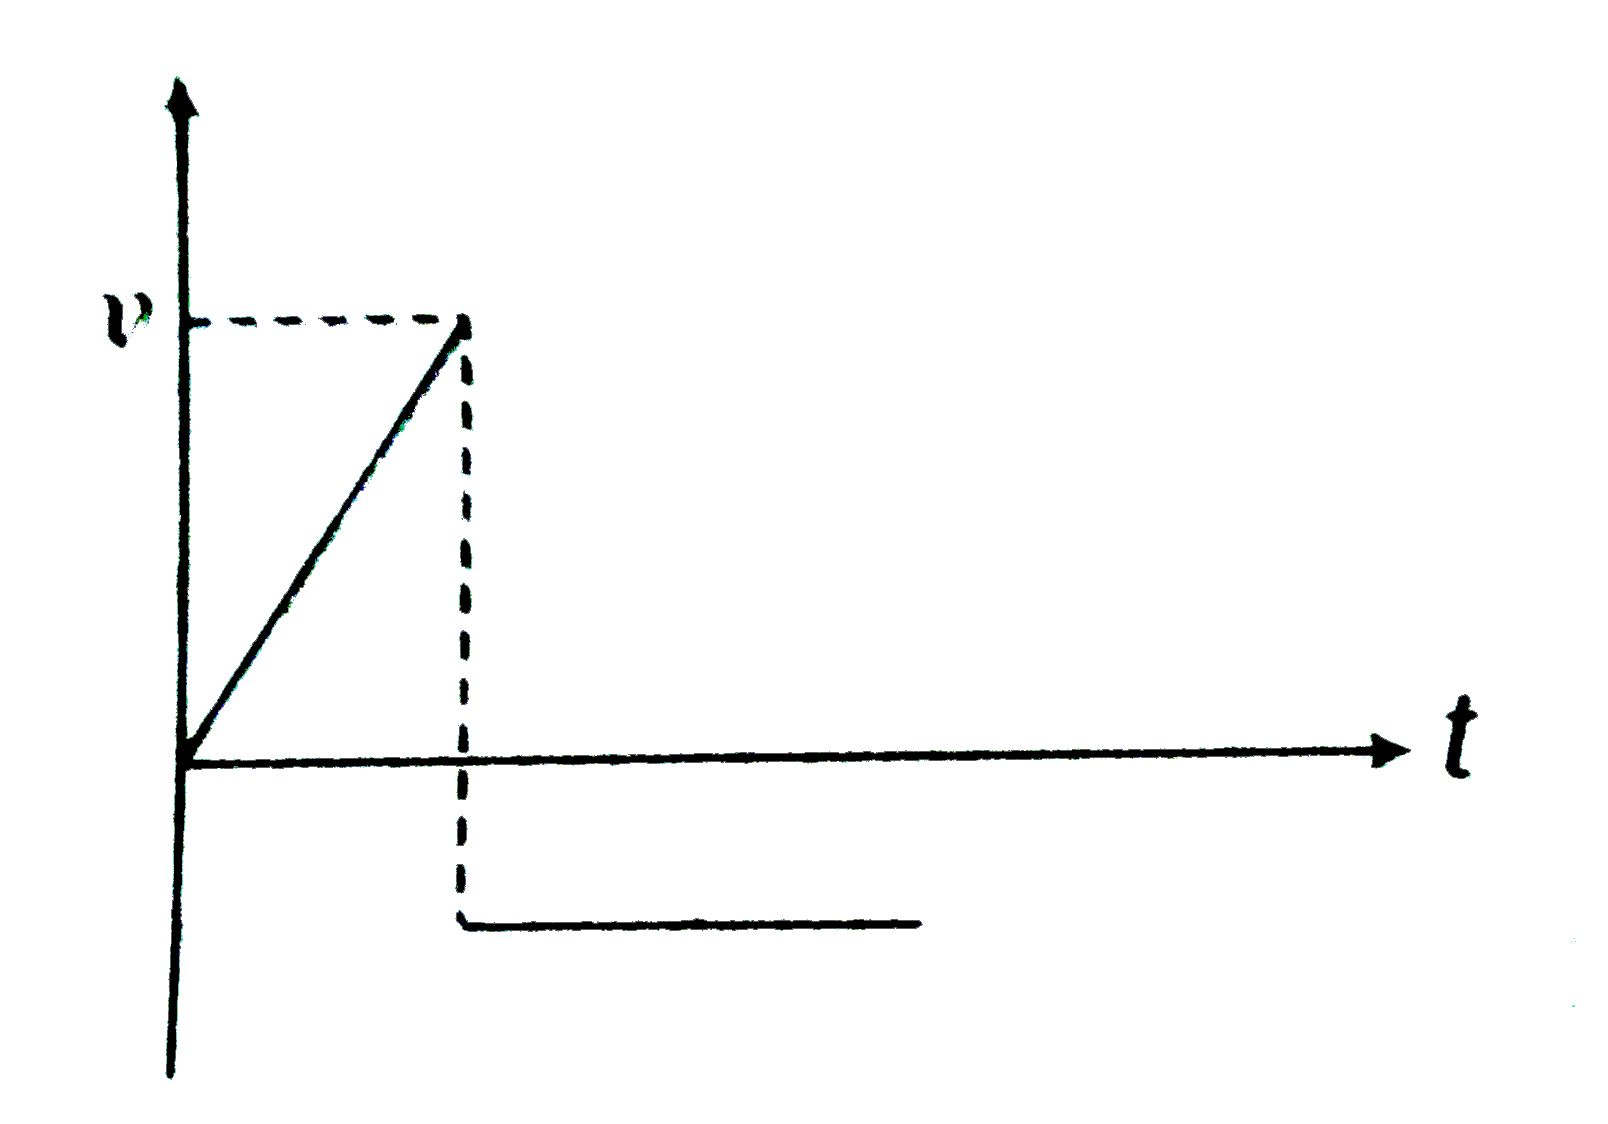
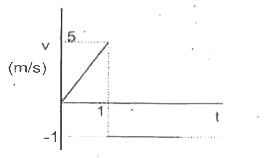
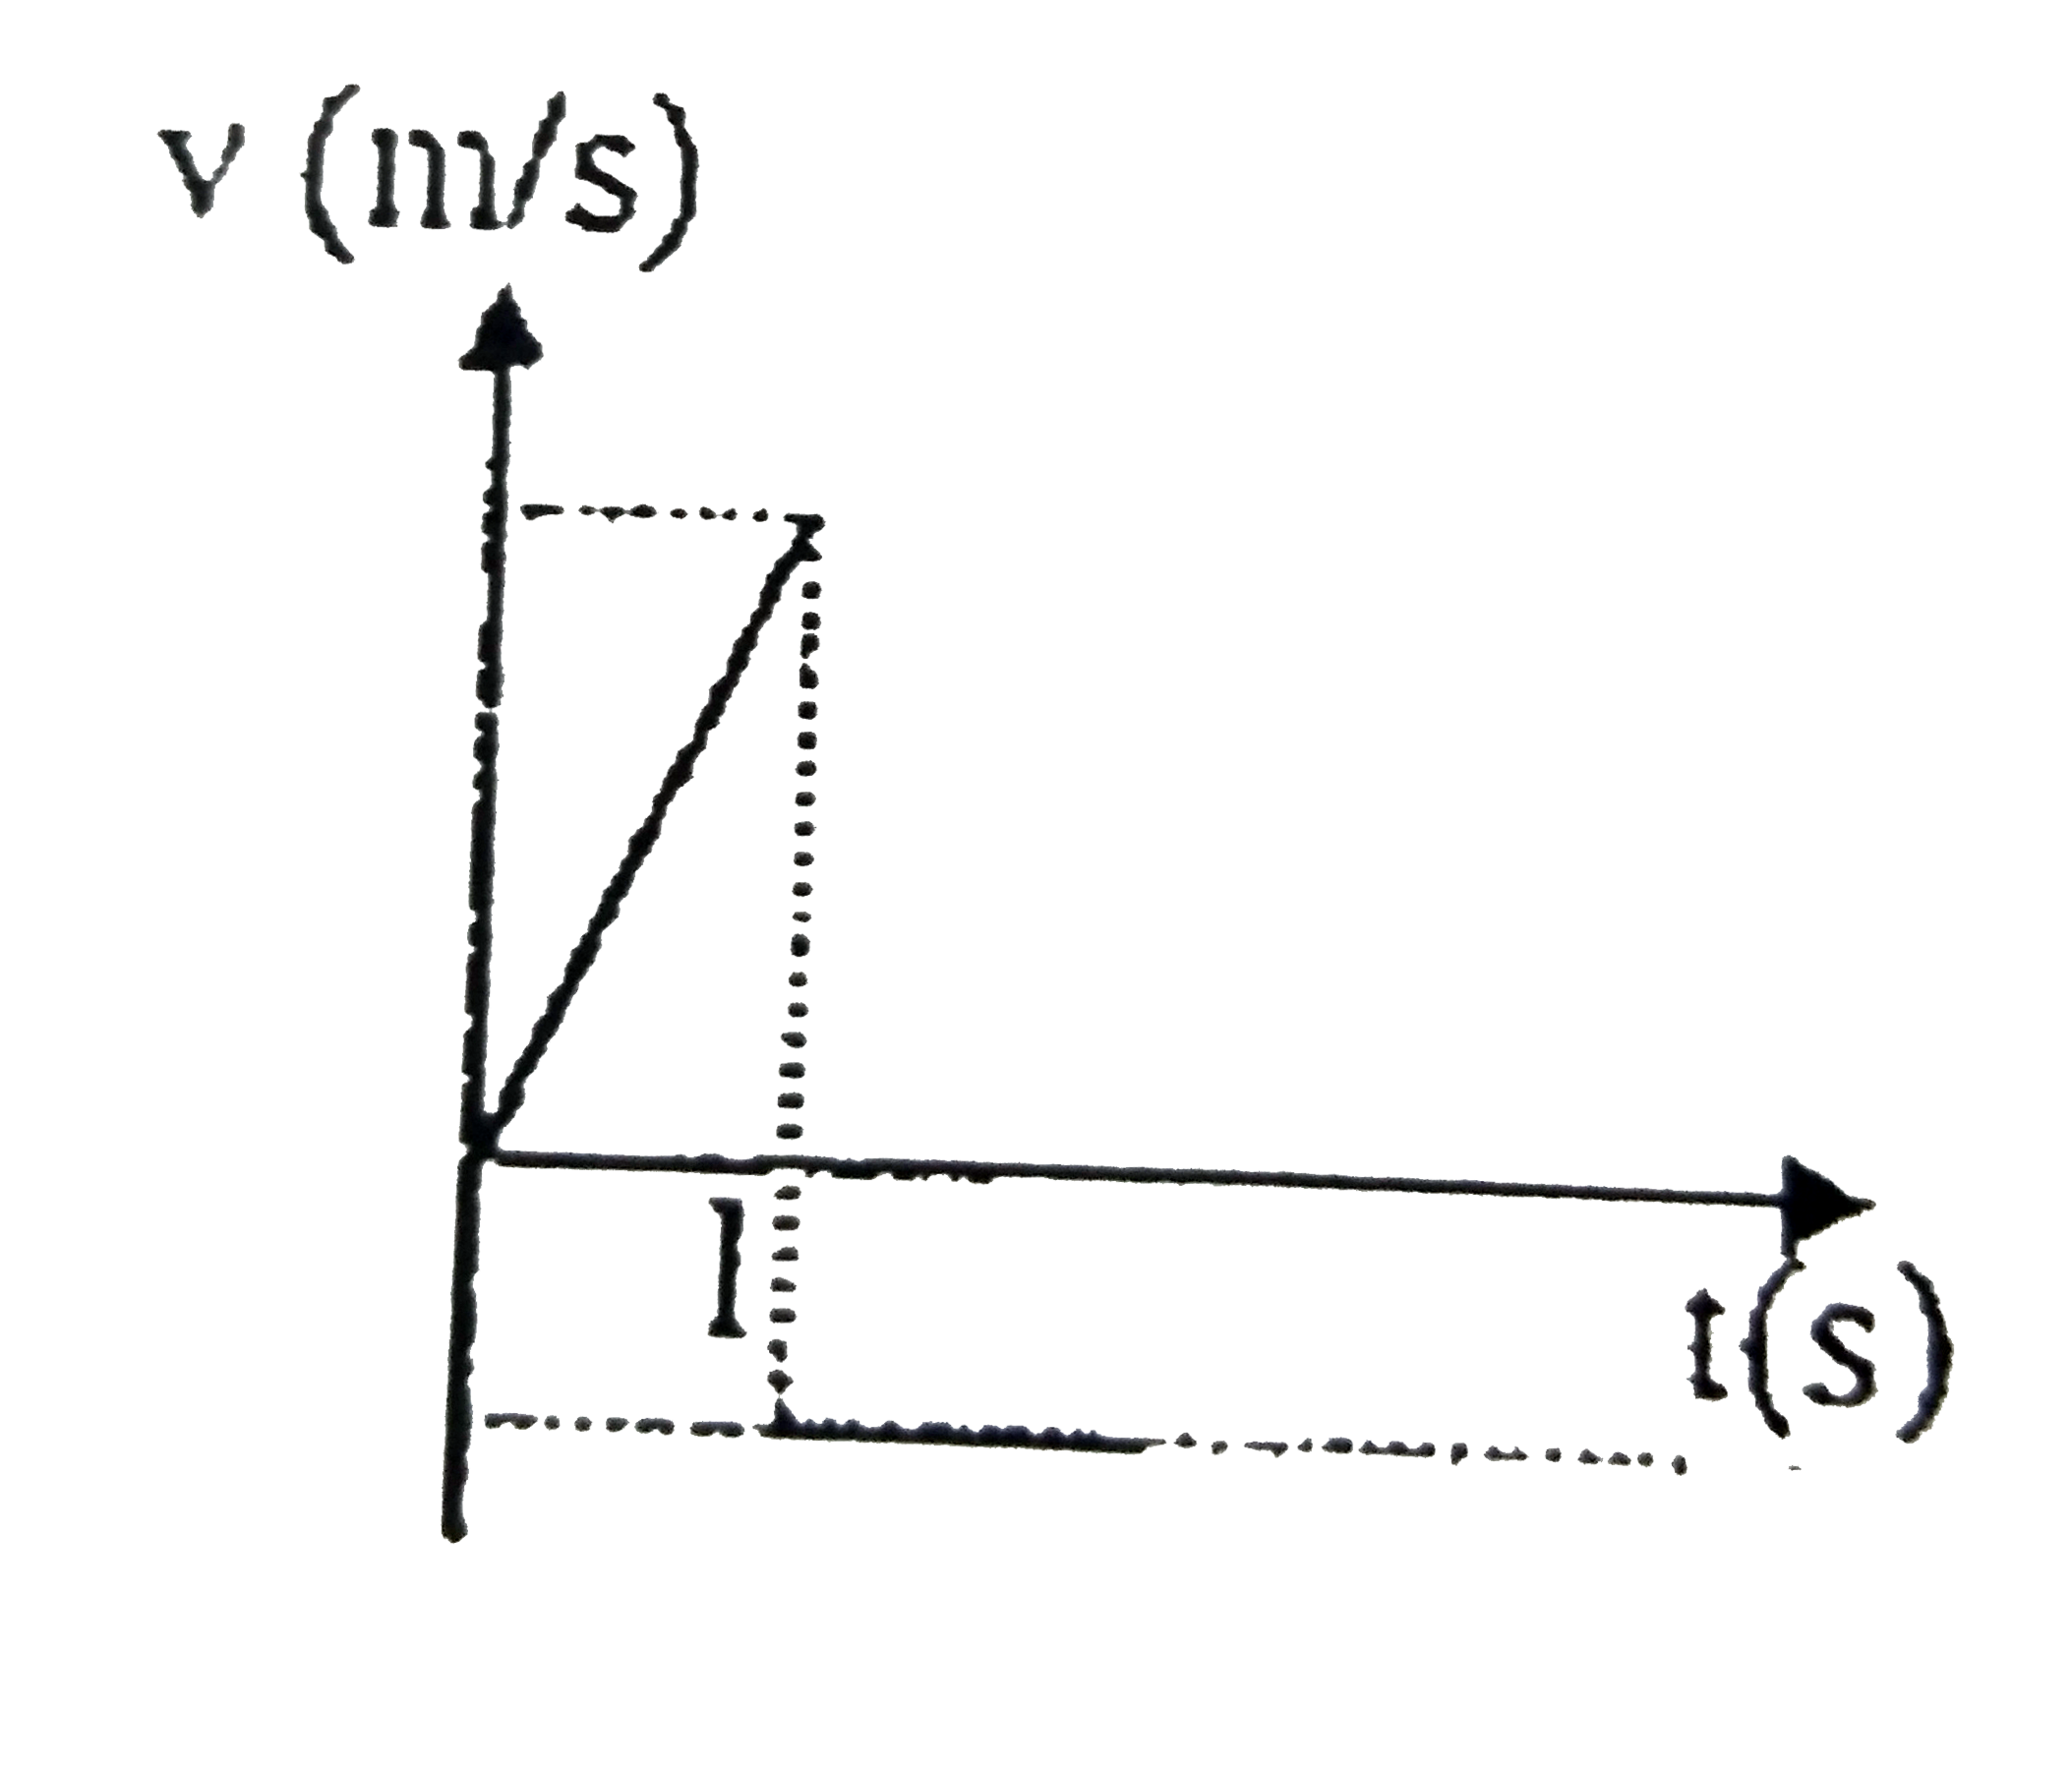
The velocity-time graph for a particle moving along X-axis is shown in the figure. The corresponding displacement-time graph is correctly shown by
 View Solution
The velocity time graph for a particle moving along X-axis is shown in the figure. The corresponding displacement time graph is correctly shown by
 View Solution
The velocity time graph for a particle moving along x-axis is shown in the figure. The corresponding displacement time graph is correctly shown by
 View Solution
The velocity-time graph for a particle moving along X-axis is shown in the figure. The corresponding displacement-time graph is correctly shown by
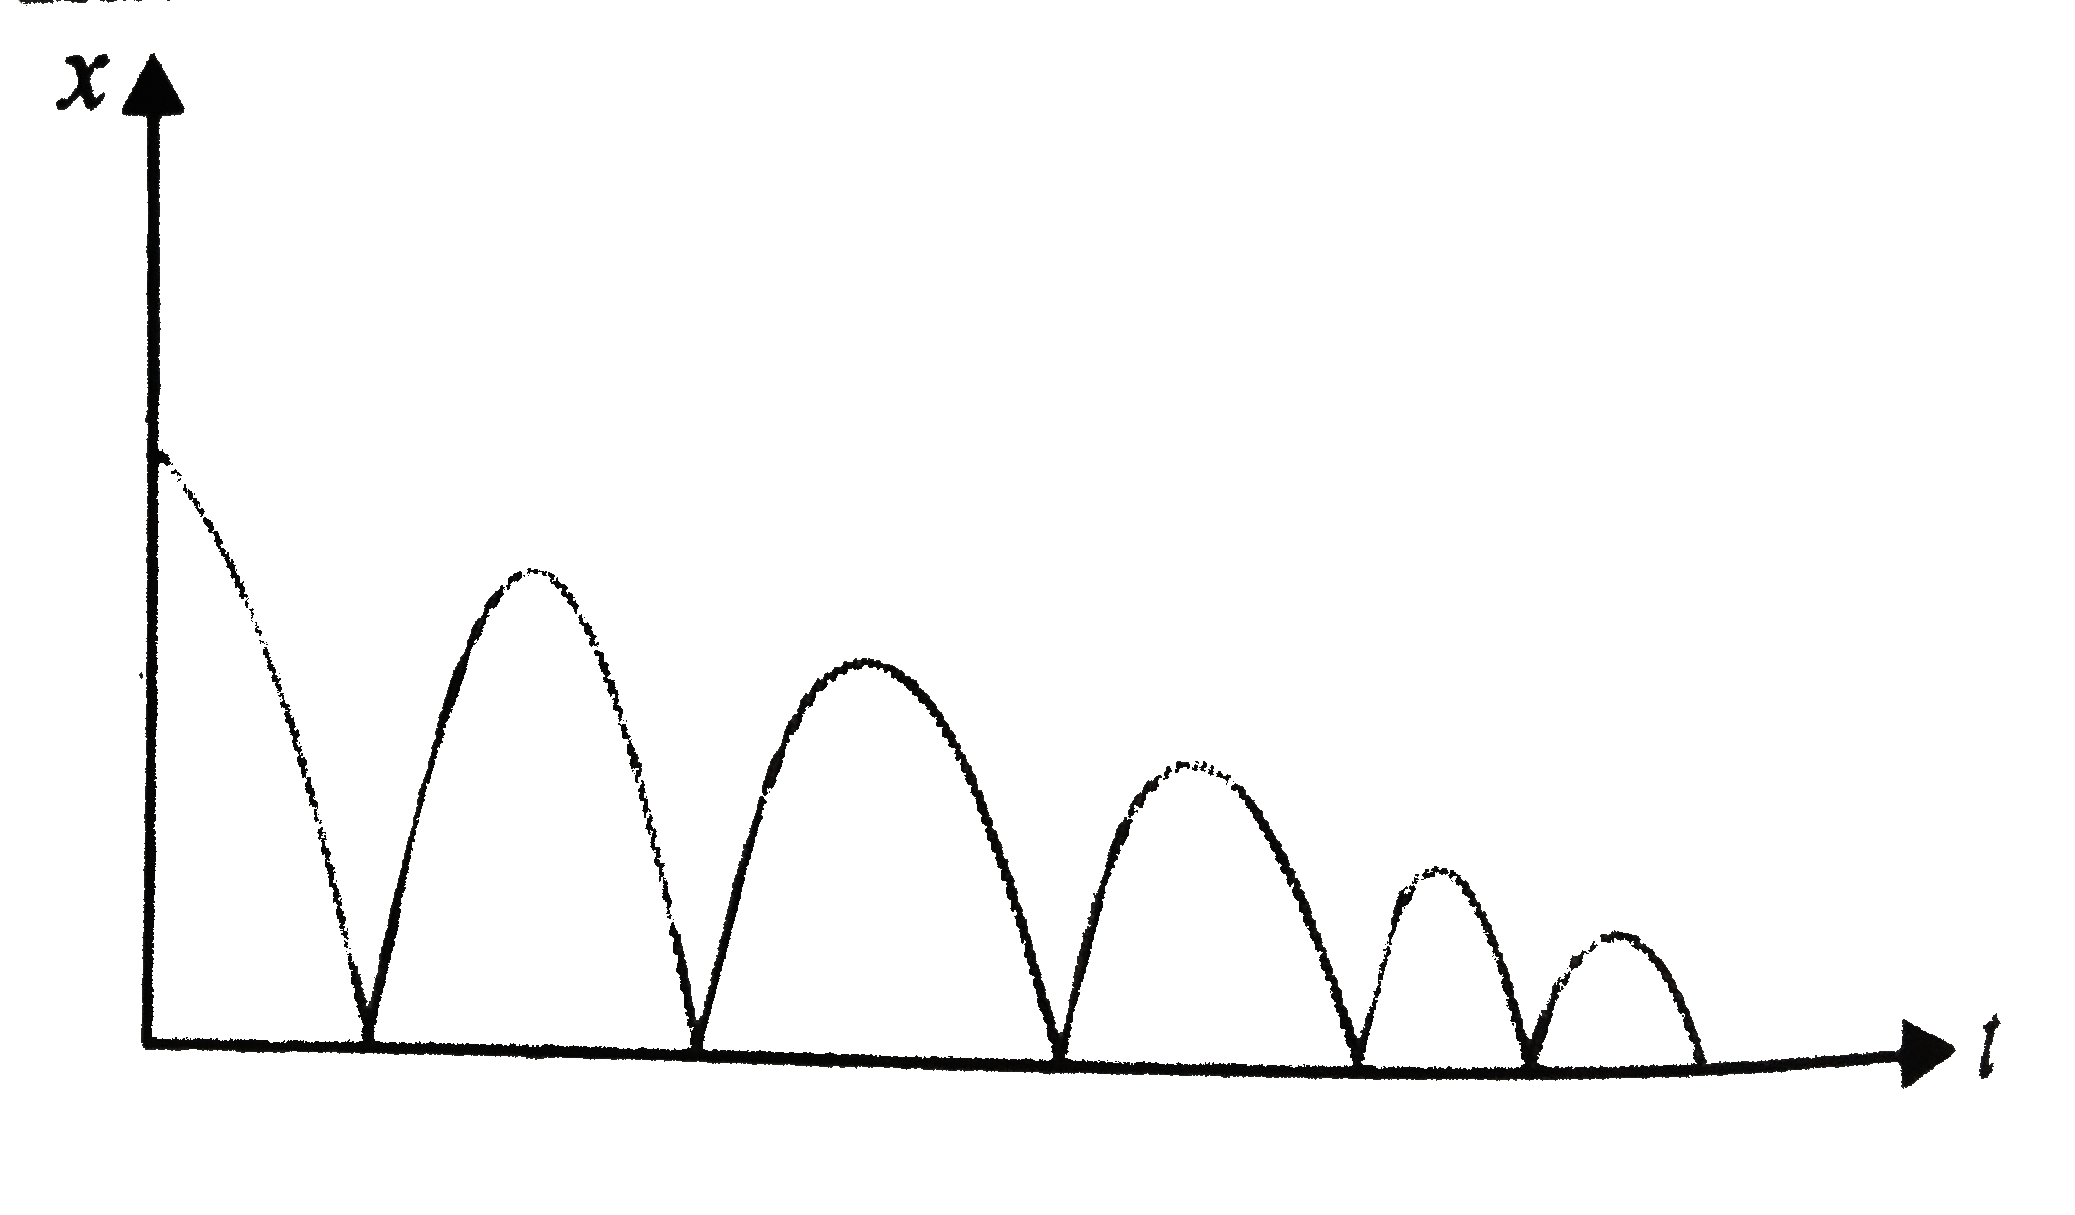
View SolutionA ball is dropped and its displacement vs time graph is as shown in Fig. 2 (EP) .7 displacement (x) is from ground and all quantities are +ve upwards. (a) Plot qualitatively velocity vs time graph. (b) plot qualitatively acceleration vs time graph .
 View Solution
A ball is dropped and its displacement vs time graph is as shown in Fig. 2 (EP) .7 (displacement (x) is grom ground and all quantities are +ve upwards). (a) Plot qualitvely velocity vs time graph). (b) plot qualitatively acceleration vs time graph .
 View Solution
The acceleration time graph of a particle moving along a straight line is as shown. The time at which the particle will have the velocity same as initial velocity (in s) is?
View SolutionFor an object projected upward with a velocity which comes back to the same point after some time, draw
(i) Acceleration-time graph
(ii) Position-time graph
(iii) Velocity-time graph
View Solution
