Mr. Harry wants to draw a line chart using a list of elements named LIST. Complete the code to perform the following operations: i To plot a line chart using the given LIST ii To give a y-axis label to the line chart named “Sample Numbers”.import matplotlib.pyplot as PLINELIST=[10 20 30 40 50 60].........................Statement 1...................Statement 2PLINE.show
i PLINE.plotLISTii PLINE.ylabel“Sample Numbers”
Related Solutions
Match List-I (reaction) with List-II (name of the reaction) and select the correct answer using the codes given below the lists:
 View Solution
Match list-I (structural) with list-II (name) and select the correct answer using the codes given below the lists.
 View Solution
Match list-I (structural) with list-II (name) and select the correct answer using the codes given below the lists.
 View Solution
Match List- I (Important Regions of Plantation) with List II (Names of Plantation) and select the correct answer by using the code given below the lists -
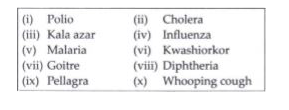
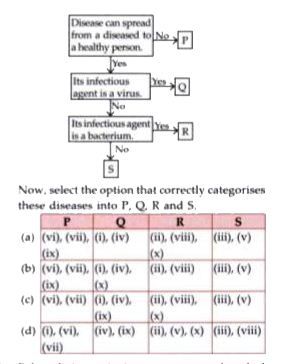
View SolutionRefer to the given flow chart and the following list of diseases.

 View Solution
Match the missiles (List-I) with the given names (List-II) and select the correct answer using the codes given below
View SolutionMatch List-I (name of the plant) with List II (seed dispersal) and select the correct answer using the codes given below
 View Solution
Match List-I (name of the shipyard) with List-II (location) and select the correct answer using the codes given below
 View Solution
Match List - I (Element) with List - II (Process) and select the correct answer using the codes given below the lists
 View Solution
Match List - I (Element) with List - II (Process) and select the correct answer using the codes given below the lists
 View Solution
Match List - I (Element) with List - II (Process) and select the correct answer using the codes given below the lists
View SolutionMatch List - I (Element) with List - II (Process) and select the correct answer using the codes given below the lists
View SolutionMatch List - I (Element) with List - II (Process) and select the correct answer using the codes given below the lists
View SolutionMatch List - I (Element) with List - II (Process) and select the correct answer using the codes given below the lists
 View Solution
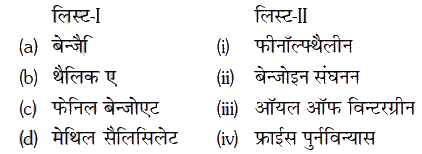
कूट का उपयोग करते हुए लिस्ट-I में दिए गए यौगिकों का सुमेल लिस्ट –II से कीजिएः<>
 View Solution
Match the List-I and List-II correctly using the code given below.
View SolutionMatch List-I (Country) with List II (Names of shifting cultivation, the country is associated with) and select the correct answer using the code given below the lists
 View Solution
Match List-I (Types of minerals) with List-II (Name of the minerals) and select the correct answer using the codes given below the lists:
 View Solution
Match the compounds of List I with the appropriate subtituent (prefix ) name is List II and select the correct answer using the code given below the lists :
 View Solution
Match list I and II and select the correct answer using the code given below the list.
View Solution
