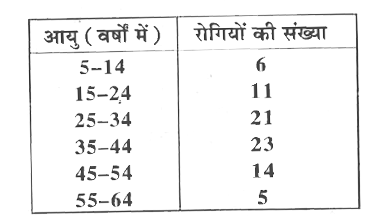
The following table shows the age distribution of cases of a certain disease admitted during a year in a particular hospital:Class5 -1415-2425 -3435-4445 -5455-64Frequency6112123145i Find the average age for which maximum cases occurred.ii Which mathematical concept is used in this problem ?iii What is its value ?
i Here class intervals are not in inclusive form. So we first convert them in inclusive form by subtracting 0.5 from the lower limit and adding 0.5 to the upper limit of each cases where h is the difference between the lower limit of a class and the upper limit of the preceding class. The given frequency distribution in inclusive form is as follows:Since highest frequency is 23 so the modal class is 34.5 - 44.5.ii Mode of grouped dataiii If we practice habit of cleanliness we will be able to put disease at an arms length
Related Solutions
Find the mean age in years from the frequency distribution given belw Age in years 25-2930-3435-3940-4445-4950-5455-59No: of persons 4142216653
View SolutionThe following table shows the age distribution of cases of a certain disease admitted during a year in a particular hospital. Age (in years): 5-14 15-24 25-34 35-44 45-54 55-64 No. of cases: 6 11 21 23 14 5. Find the average age for which maximum cases occurred.
View Solutionनिम्नांकित सारणी किसी अस्पताल में एक विशेष वर्ष में भर्ती हुए रोगियों की आयु को दर्शाती

उपर्युक्त आंकड़ों का माध्य ज्ञात करेView Solutionनिम्नलिखित सारणी अस्पताल में एक विशेष वर्ग में एक भाति हुए रोगियों को दर्शाता है

वह औसत आयु ज्ञात कीजिए जिसके अधिकतर केस आते है ।View Solutionअग्रलिखित सारणी में एक शहर में एक विशेष वर्ष में एक रोग से पीड़ित रोगियों का आयु बंटन दिया गया है। प्रति रोगी औसत आयु ( वर्षो में ) ज्ञात कीजिए।
 View Solution
निम्नलिखित सारणी किसी अस्पताल में एक विशेष वर्ष में भर्ती हुए रोगियों की आयु को दर्शाती हैं :

उपरोक्त आँकड़ों से बहुलक ज्ञात कीजिए।View SolutionThe following table shows the ages of the students during a year are :

Find the mode.View Solutionनिम्नलिखित सारणी अस्पताल में एक विशेष वर्ष में भर्ती हुए रोगियों की आयु को दर्शाती है :

उपर्युक्त आंकड़ों का माध्य एवं बहुलक ज्ञात करे । दोनों केंद्रीय प्रवत्ति की मापो की तुलना करे और उनकी व्याख्या करे ।View SolutionCOVID-19 Pandemic
The COVID-19 pandemic, also known as coronavirus pandemic, is an ongoing pandemic of coronavirus disease caused by the transmission of severe acute respiratory syndrome coronavirus 2 (SARS-CoV-2) among humans.

The following tables shows the age distribution of case admitted during a day in two different hospitals .

Refer to table 1.
The average age for which maximum cases occurred isView SolutionThe following table shows age distribution of persons in a particular region.Find the: (i) mean age ( i) modal age (ii) median age Age?
View SolutionThe following table shows the ages of the patients admitted in a hospital :
Find the mode and the mean of the data given above. Compare and interpret the two measures of central tendency.View SolutionThe average of the ages of 15 students in a class is 19 years. When 5 new students are admitted to the class, the average age of the class becomes 18.5 years. What is the average age of the 5 newly admitted students ?
View SolutionThe average age of 15 students of a class is 19 years. When 5 new students are admitted in the class, the average age of the class becomes 18.5 years. What is the average age of 5 newly admitted students?
View SolutionThe following table shows the ages of the patients admitted in a hospital during a year:Find the mode and the mean of the data given above. Compare and interpret the two measures of central tendency.
View SolutionThe following table shows the number of patients of differents age groups admitted to a hospital for treatement on a day. Find the median age of the patients.
 View Solution
The following table shows the average age of the individuals of a country: Find the average age by direct method.
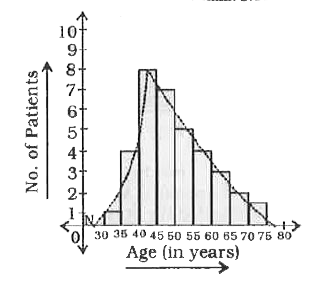
View SolutionThe diagram shows the age-distribution of the patients admitted to a hospital on a particular day. Study the diagram and particularly day. Study the diagram and answer the questions.

Total number of patients of age more than 55 years, who got admitted to the hospital isView SolutionThe following table shows ages of patients (in years) and the number of patients getting medical tretment on a particular day in a hospital in a day.

Find the median age of a patient.View SolutionAverage age of 5 students of a school Is 14 years. The average age of students and their mathematics and science teachers is 30 years. If the age of science teacher is 6 years more than the age of mathematics teacher, then what is the age (in years) of mathematics teacher?
View SolutionThe digram shows the age distribution of the patients admitted to a hospital on a particular day Study the diagram and answer the questions

उस दिन अस्पताल में भर्ती होने वाले 55 वर्ष से 60 वर्ष के बीच की उम्र के मरीज़ो की संख्या कितनी थी ।View Solution
