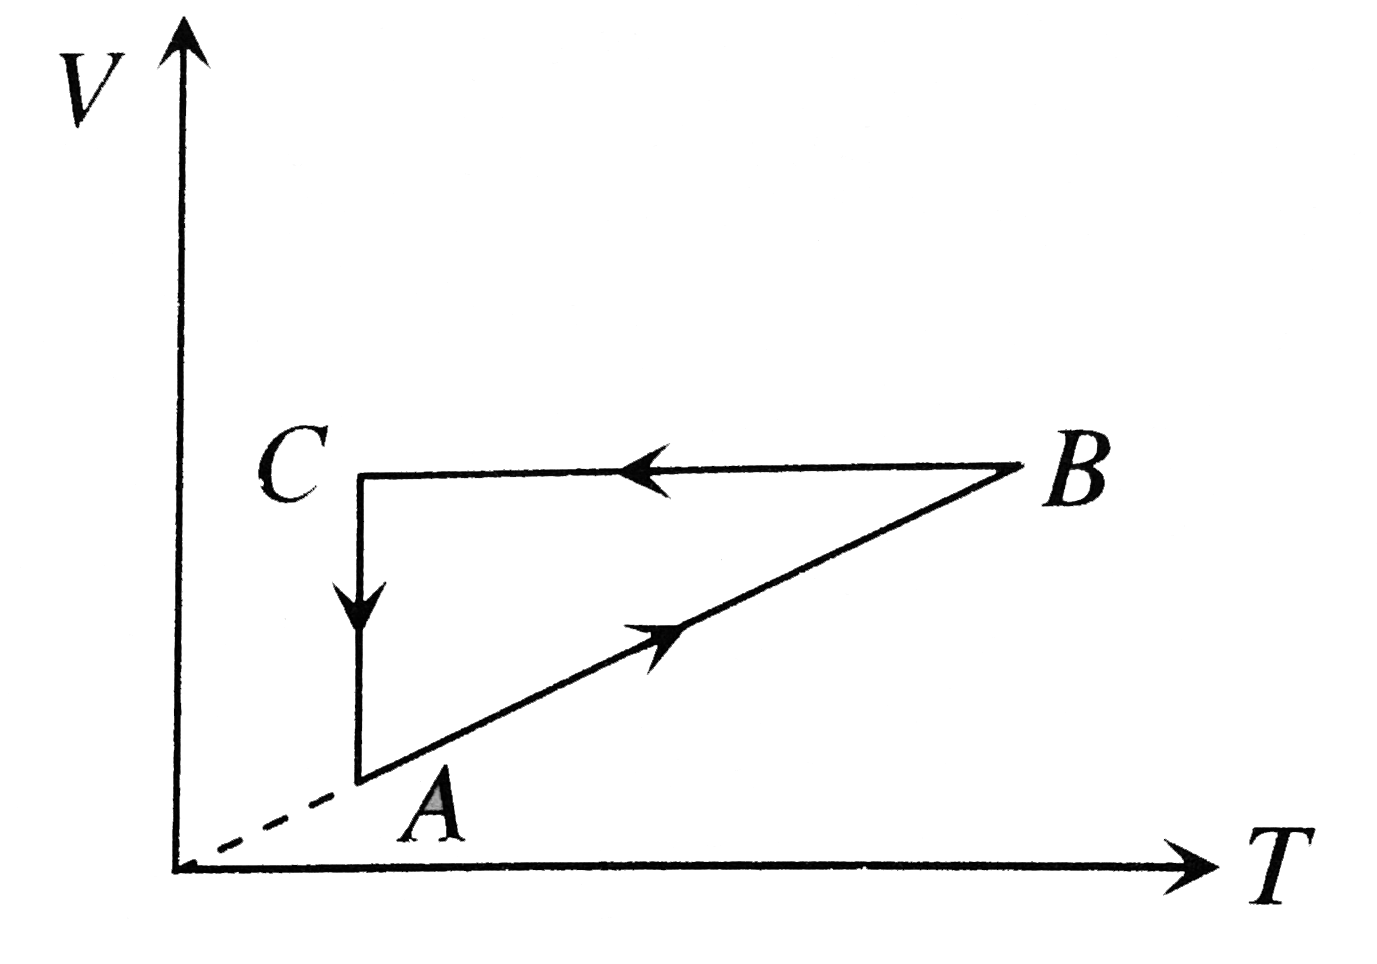
A cyclic process ABCA shown in V-T diagram is performed with a constant mass of an ideal gas. Which of the following graphs in figure represents the corresponding process on a P-V diagram?
Correct option aExplanation:
Related Solutions
A cyclic process ABCA shown in the V-T diagram is performed with a constant mass of an ideal gas. Show the same process on a p-V diagram, In the figure, CA is parallel to the V-axis and BC is parallel to the T-axis.
View SolutionV-T The cyclic process shown in the diagram ABCA An ideal gas with a fixed mass is represented. P- V The diagram has the same process:
View SolutionA cyclic process ABCA shown in the V-T diagram is performed with a constant mass of an ideal gas. Show the same process on a p-V diagram, In the figure, CA is parrallel to the B-sxis and BC is parallel to the T-axis.
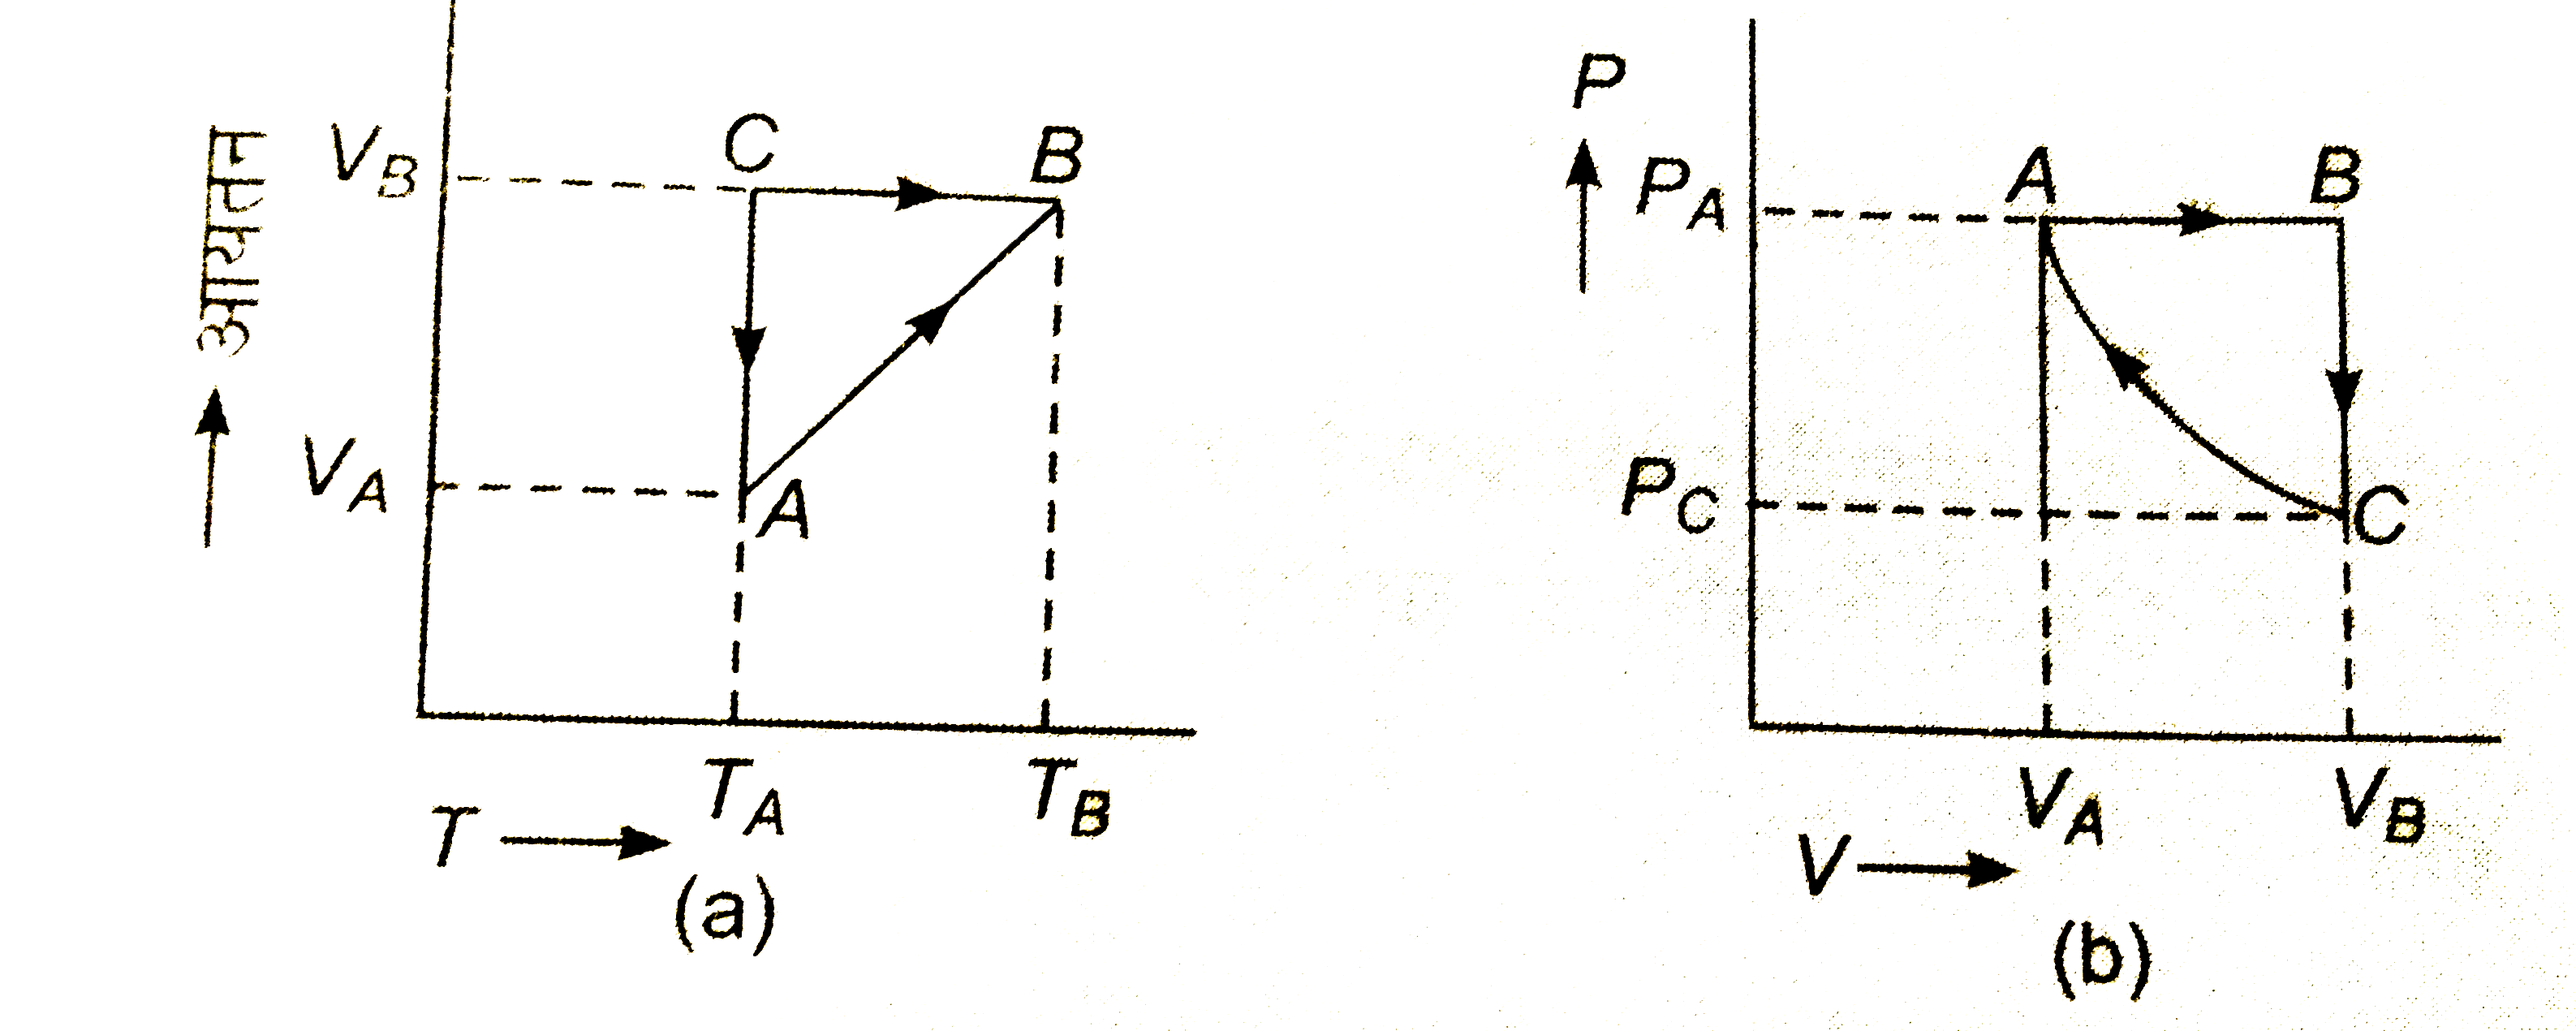
View SolutionA cyclic process ABCA is shown in V-T diagram (Fig (a)). It is performed with a constant mass of ideal gas. How will this transform to a p-V digram?
View SolutionA cyclic process is shown in the diagram process on the
View SolutionA cyclic process is shown in the diagram process on the

View Solution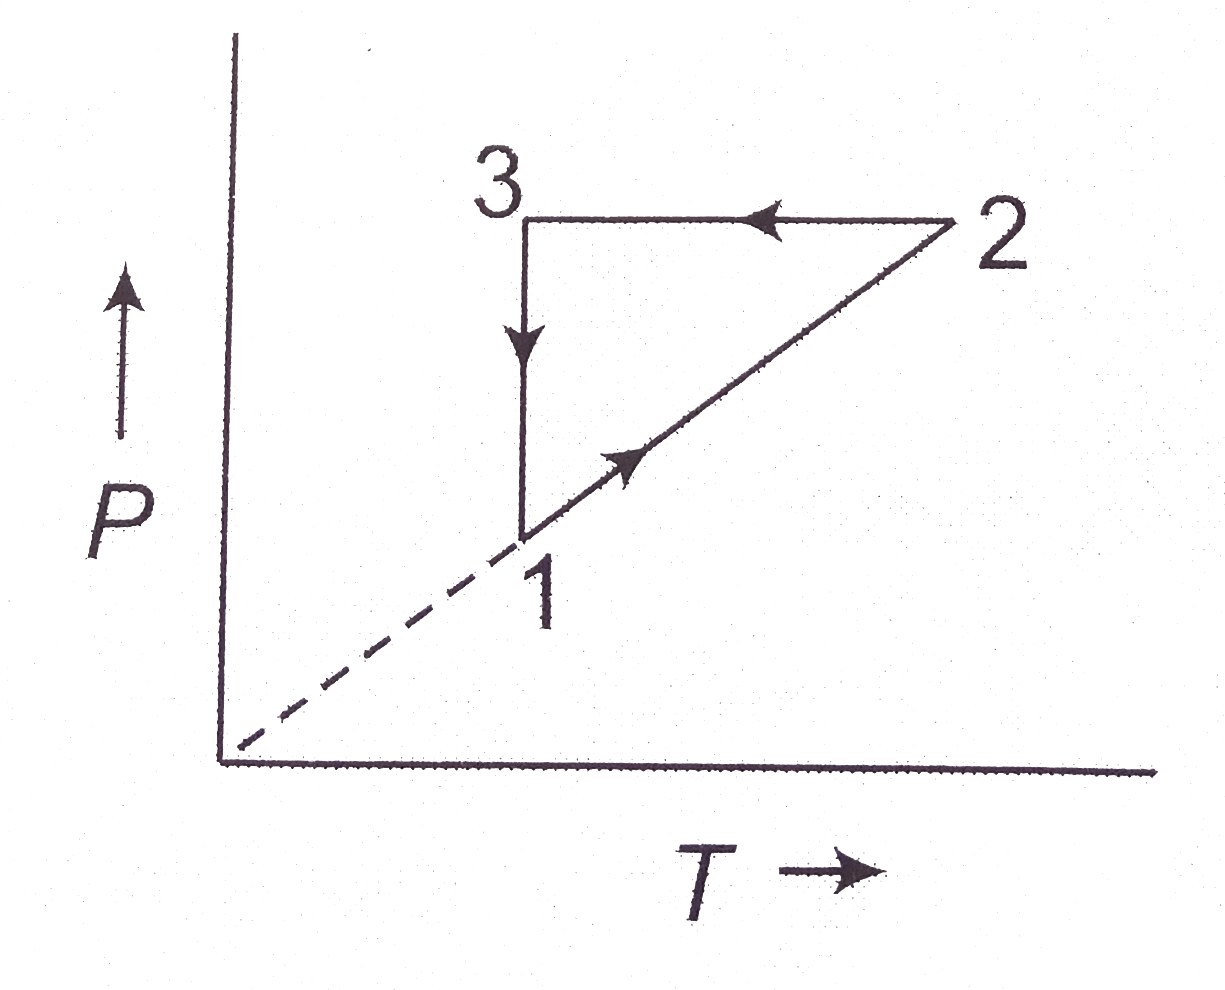
A cyclic process shown in diagram is performed with a constant mass of an ideal gas. Show it on a (a) diagram (b)
View SolutionA Cycle process ABCA shown in V-T diagram Fig. is preformed with a constant mass of an ideal gas. Show the same process on a P-V diagram.
View Solutionएक चक्रीय प्रक्रम ABCA को V - T आरेख में दिखाया गया है। प्रक्रम का P-V आरेख होगा
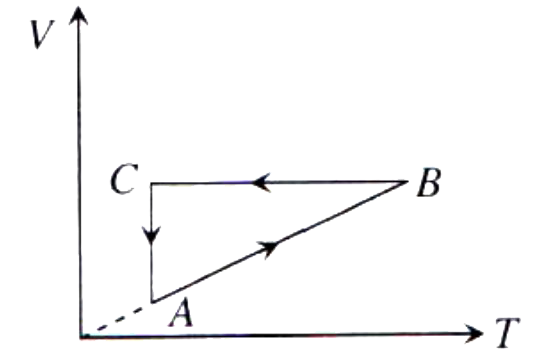
View Solutionएक चक्रीय प्रक्रम ABCA चित्र में प्रदर्शित आरेख के अुनसार नियत द्रव्यमान की आदर्श गैस में लिया गया है। इस प्रक्रिया को आरेख पर प्रदर्शित कीजिए।
View SolutionThe given figure shows the pressure-temperature (P-T) diagram for a fixed mass of an ideal gas undergoing cyclic process ABCA. The corresponding pressure-volume (P-V) graph for the given cyclic process will be
View SolutionA cyclic process ABCA is shown in the V - T diagram . Process on the P – V diagram is
View SolutionA cyclic process ABCA is shown in the given V-T diagram. Process in the P-V diagram will be
View SolutionA cyclic process ABCA is shown in the V - T diagram. The process on the P - V diagram is:
View SolutionA cyclic process ABCA is shown in the V - T diagram . Process on the P – V diagram is
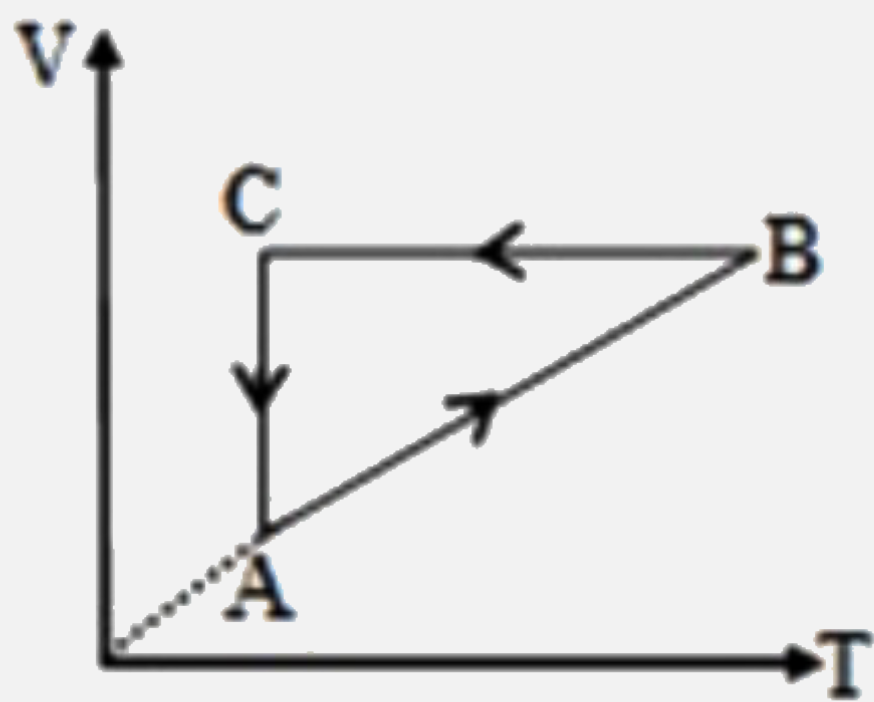
View SolutionV - T आरेख में प्रदर्शित एक चक्रीय प्रक्रम ABCA , एक आदर्श गैस के नियत द्रव्यमान के लिए चित्रित किया गया है | इसी प्रक्रम को p - V आरेख पर दर्शाइए (चित्र में, रेखा AB मूलबिन्दु से जाती है |)
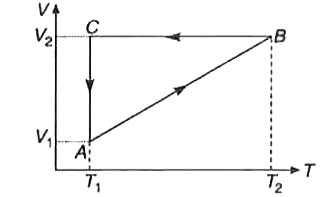
View SolutionFor a given thermodynamic cyclic process, P-V indicator diagram is as shown in the figure. Process AB,BC & CA are isobaric, & isothermal respectively. Then which of the following curve represent correc V-T indicator diagram for the process ABCA ?
View SolutionTwo moles of an ideal monoatomic gas undergoes a cyclic process ABCA as shown in V-T diagram below:

Heat supplied to the gas during the process AB is :
View SolutionThe P-V diagram for an ideal gas is shown in figure.
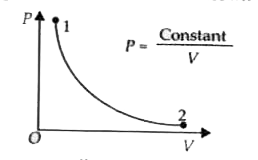
Out of the following diagrams which one represents the T-P diagram ?
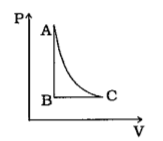
View Solutionએક નળાકાર પાત્રમાં રહેલા વાયુ માટે P - V આલેખ આકૃતિમાં દર્શાવ્યો છે : ચક્રિય પ્રક્રિયા ABCA અને ACBA થતા કાર્ય માટે કયું વિધાન સત્ય છે ?
View Solution