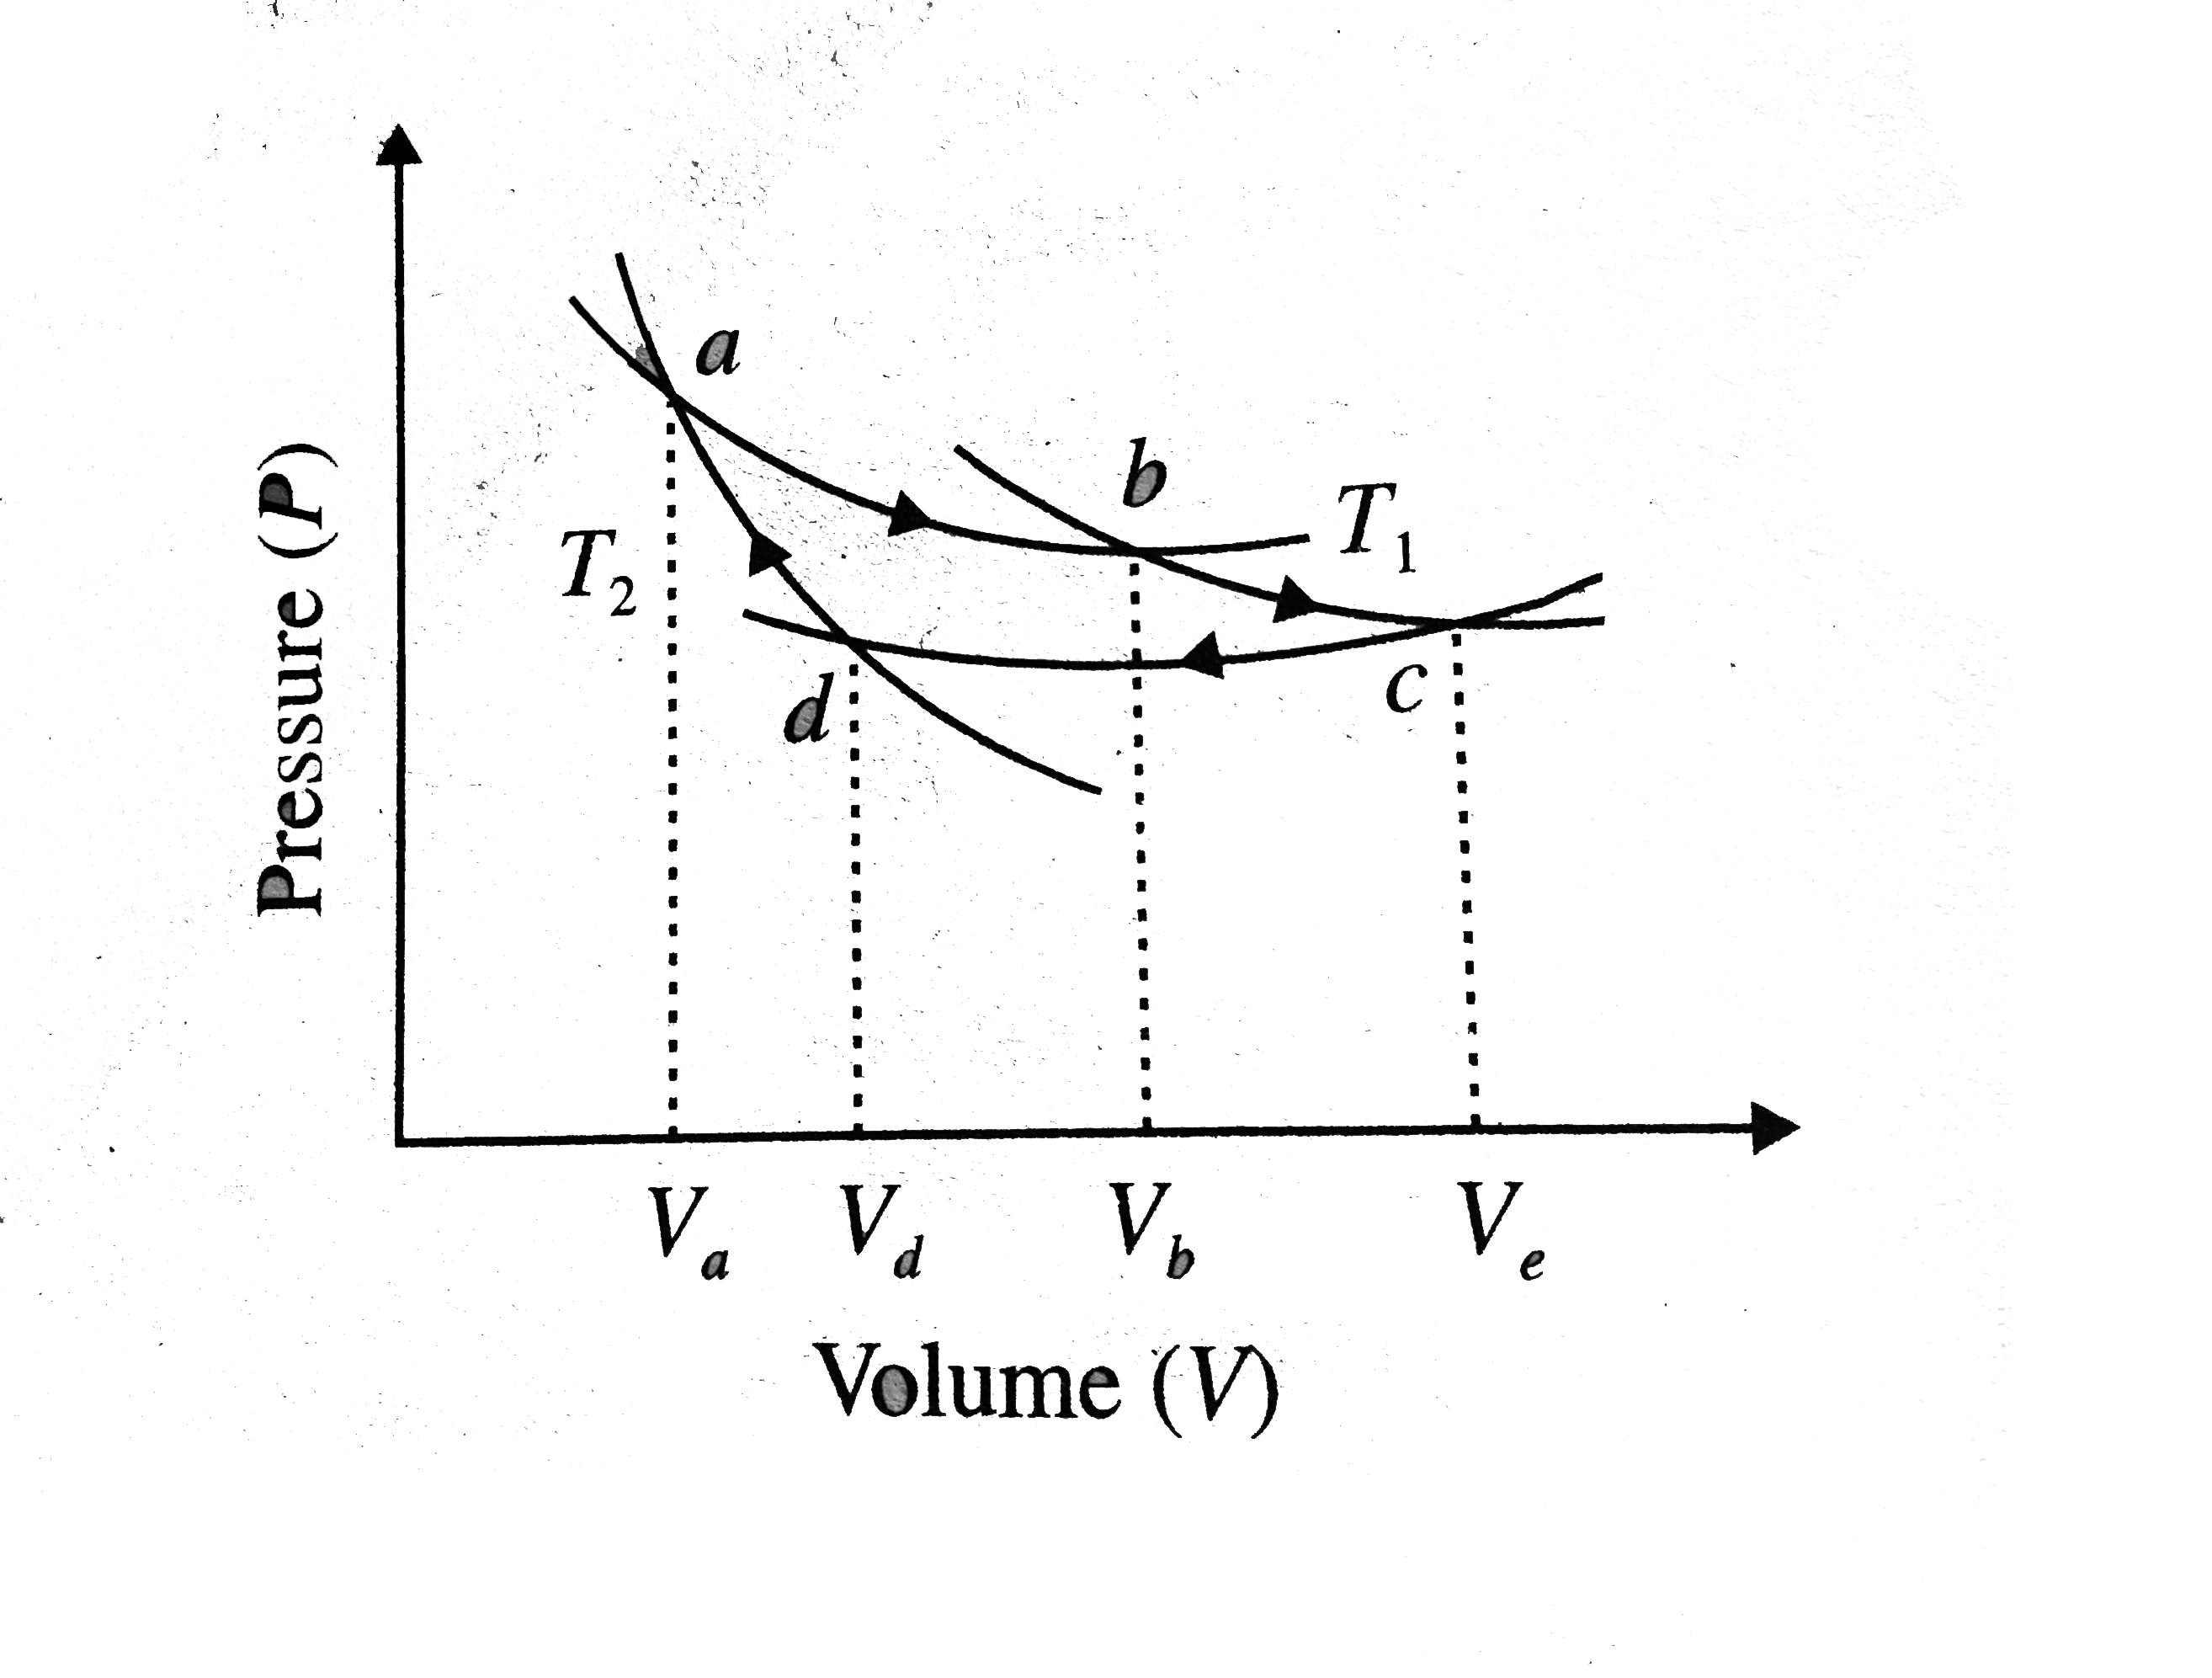
The given figure shows the pressure-temperature (P-T) diagram for a fixed mass of an ideal gas undergoing cyclic process ABCA. The corresponding pressure-volume (P-V) graph for the given cyclic process will be _PHY_E06_003.png)
_PHY_E06_003_Q01.png)
_PHY_E06_003_Q02.png)
_PHY_E06_003_Q03.png)
_PHY_E06_003_Q04.png)
Step by step video & image solution for The given figure shows the pressure-temperature (P-T) diagram for a fixed mass of an ideal gas undergoing cyclic process ABCA. The corresponding pressure-volume (P-V) graph for the given cyclic process will be by Physics experts to help you in doubts & scoring excellent marks in Class 12 exams.
Updated on:21/07/2023Similar Questions
Knowledge Check
An ideal gas undergoes cyclic process ABCDA as shown in given p−V diagram. The amount of work done by the gas is
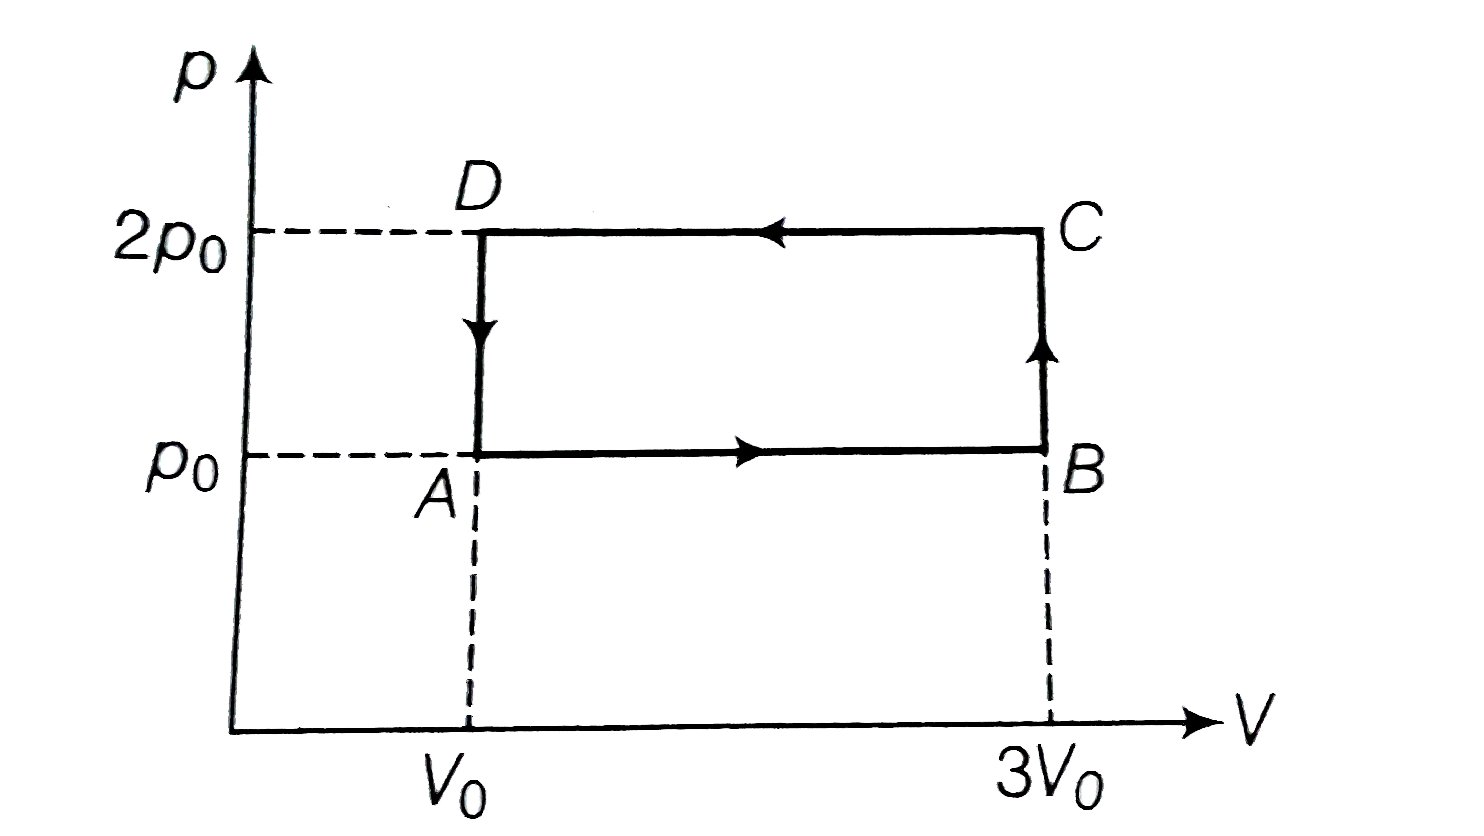 A6P0V0B−2P0V0C+2P0V0D+4P0V0
An ideal gas undergoes a process P→Q→R as shown in pressure (p) - volume (v) diagram.The work done by the gas is
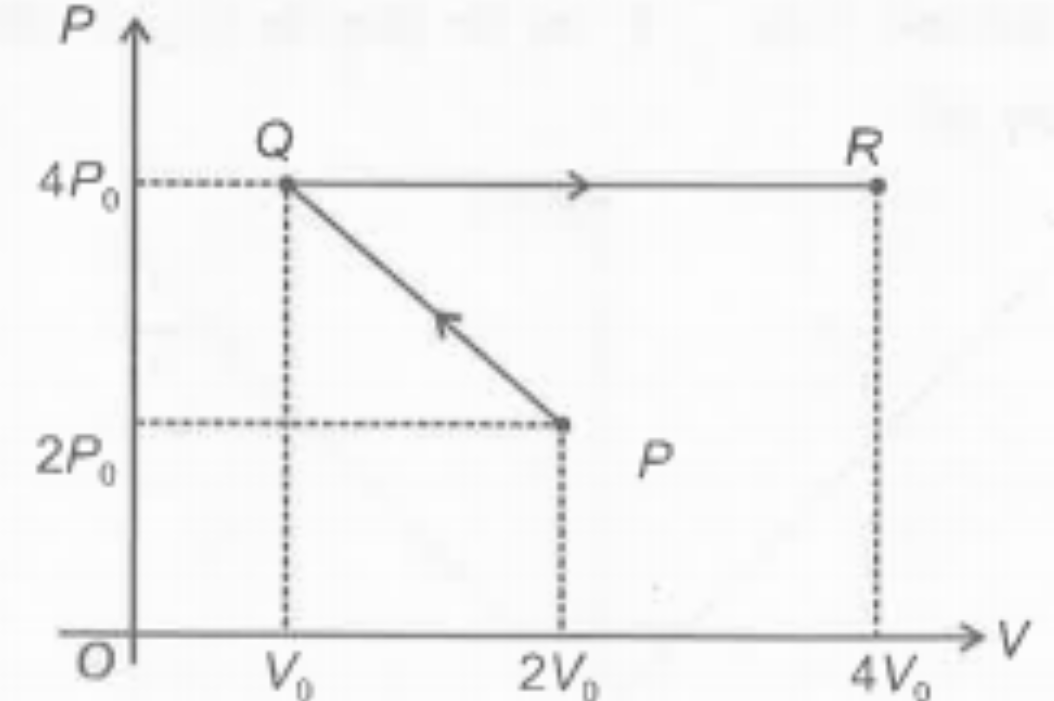
View SolutionAn ideal gas undergoes a cyclic process abcda which is shown by pressure-density curve,
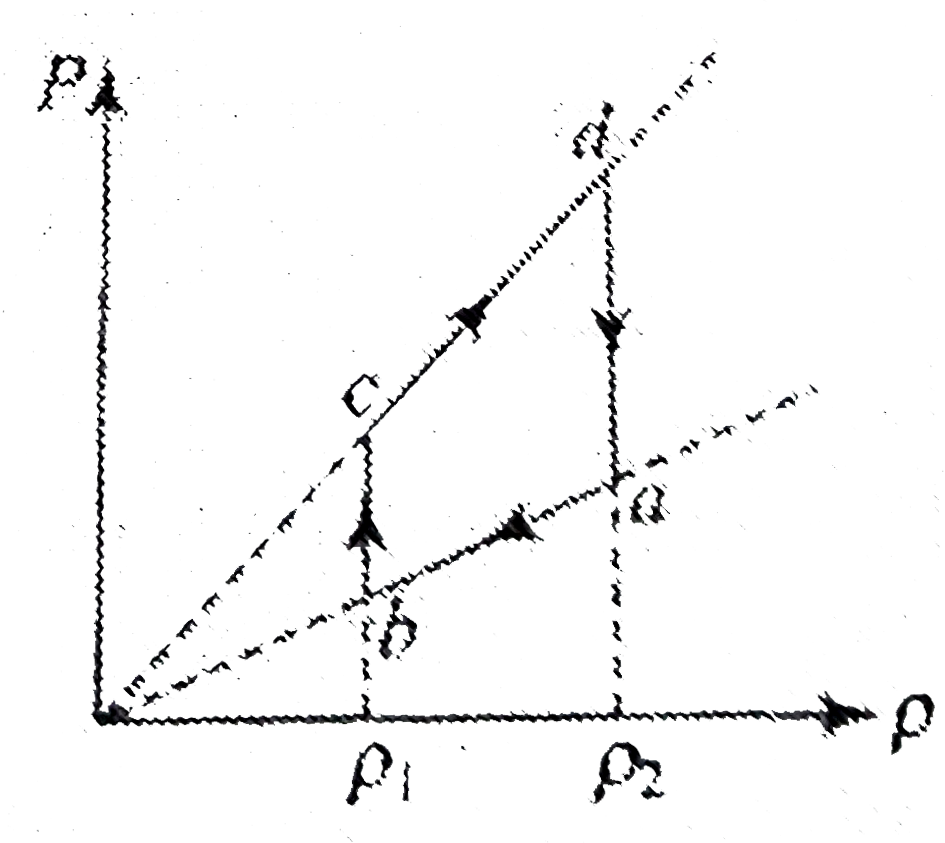
View SolutionAn ideal gas undergoes a cyclic process abcda which is shown by pressure-density curve,

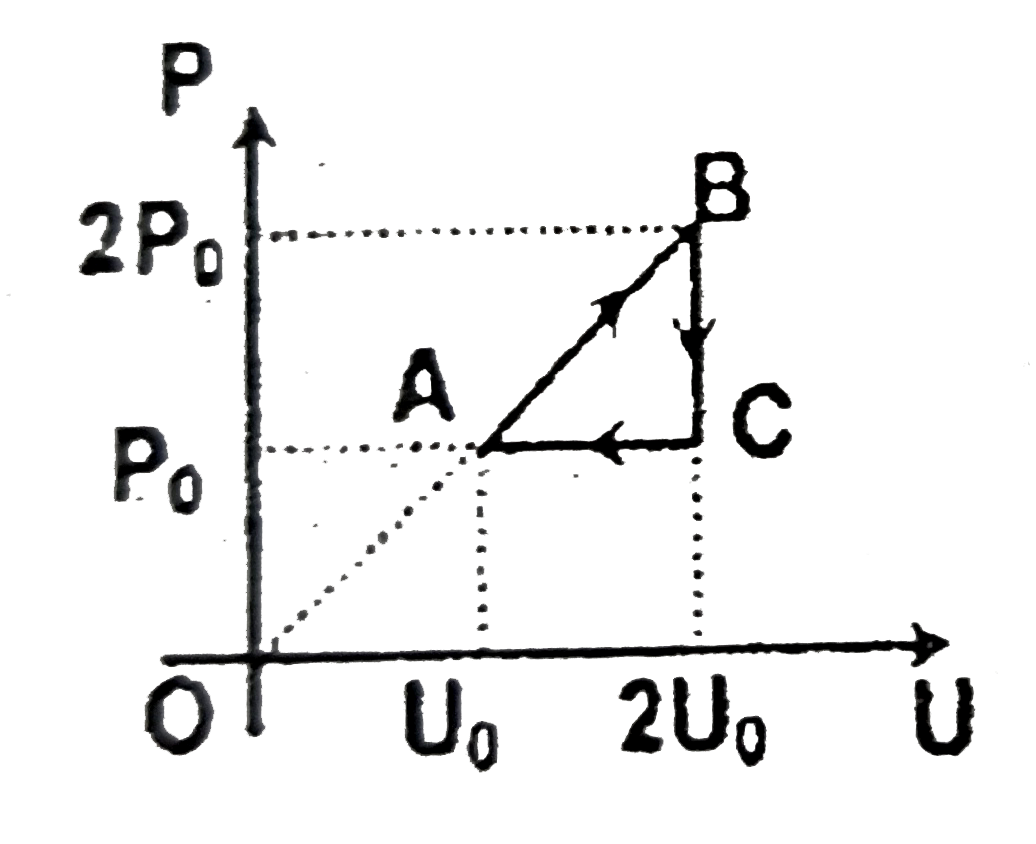
View SolutionAn ideal monatomic gas undergoes a cyclic process ABCA as shown in the figure. Graph of pressure versus volume of the cyclic process ABCA is
View SolutionAn ideal gas undergoes cyclic process ABCDA as shown in givend p−V diagram. The amount of work done by the gas is

View SolutionGiven a process on P−T diagram :
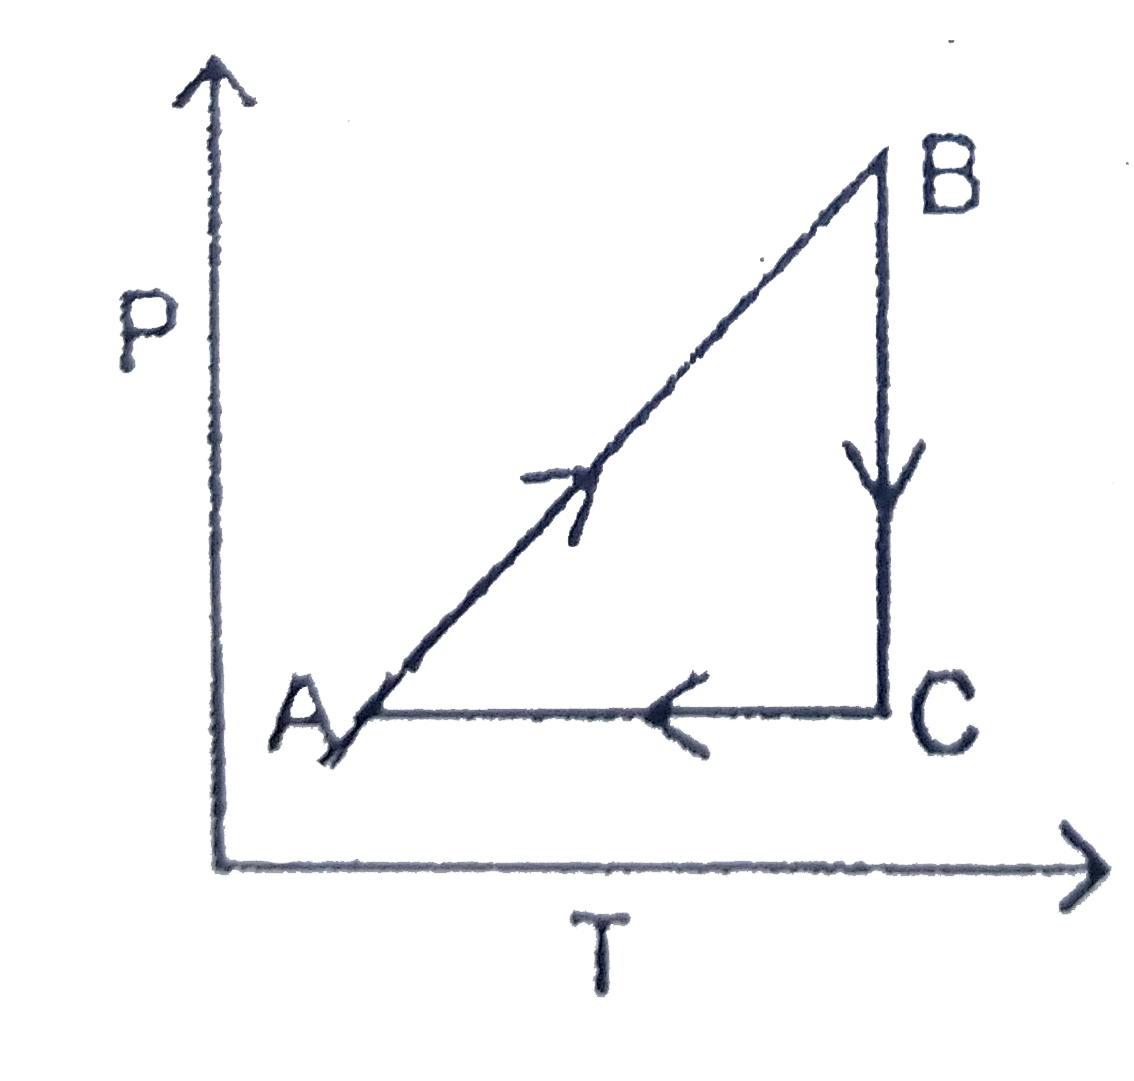
Select the corresponding graph(s)for the given process.
View SolutionAn ideal monoatomic gas follows a thermodynamic process as shown in pressure-volume (P-V) plot. The work done in process AB is

View Solution

