Draw an ogive for the data given below and from the graph determine:i The median marksii The number of students who obtained more than 75% marksMarksNo. of Students 0-9510-19920-291630-392240-492650-591860-691170-79680-89490-993
Through mark 60 draw a parallel line to x - axis which meets the curve at A. From A draw a perpendicular to x - axis meeting it at B.The value of point B is the median = 43 ii Total marks = 10075% of total marks = 75/100 x 100 = 75The number of student getting more than 75% marks = 120= - 111 = 9
Related Solutions
The distribution given below show the marks of 100 students of a class.
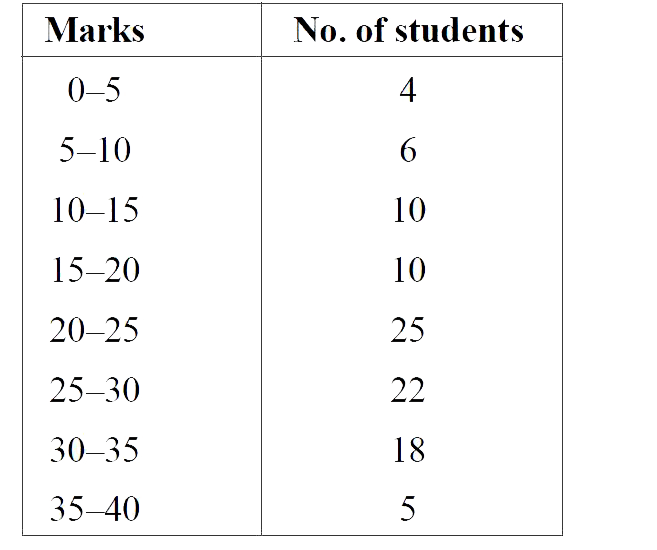
Draw a less than type and a more than type ogive from the given data. Hence obtain the median marks from the graph.
View SolutionFrom the data given below draw a more than ogive and find the median.

View SolutionDuring the medical checkup of 35 students of a class their weight were recorded as follows :

Draw a less than type a more than type ogive from the given data. Hene obtain the median weigth from the graph.
View SolutionThe marks obtained by 200 students in an examination are given below. : Draw a less than ogive for the above distribution and use less than ogive to find median.
View SolutionThe marks obtained by 120 students in a Mathematics test are given below:

Using the informations, given above, draw an ogive on a graph sheet. Take a suitable scale for your ogive. Use the ogive drawn to estimate :
(i) the median.
(ii) the number of students who obtained more than 75% marks in the test.
(iii) the number of students who did not pass in the test if the pass percentage was 40.
View SolutionThe marks obtained by 120 styudents in a test are given below :

Draw an ogive for the given distribution on a graph sheet
Use suitable scale for ogive to estiamte the following :
(i) The number of students who obtained more than 75% marks in the test.
View SolutionThe marks obtained (out of 100) by 400 students in an examination are given below:
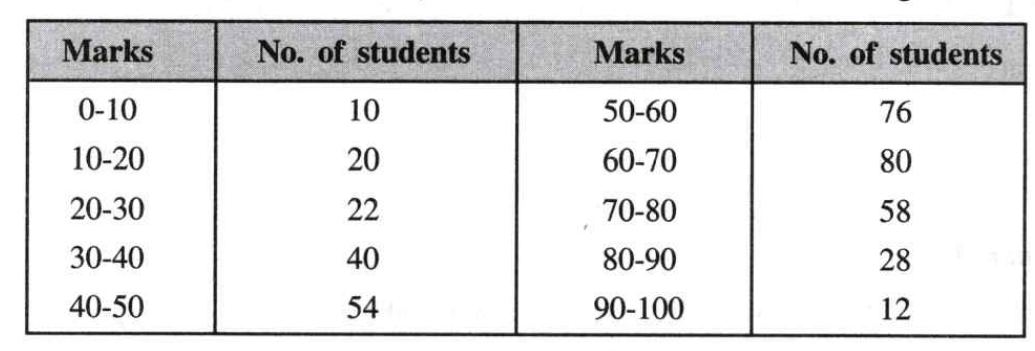
Using a graph paper, draw an ogive for the above distribution. Use ogive to estimate:
the number of students who did not pass if the pass percentage was 35.
View SolutionDraw the 'less than' and 'more than' ogive on the same graph paper from the data given below :
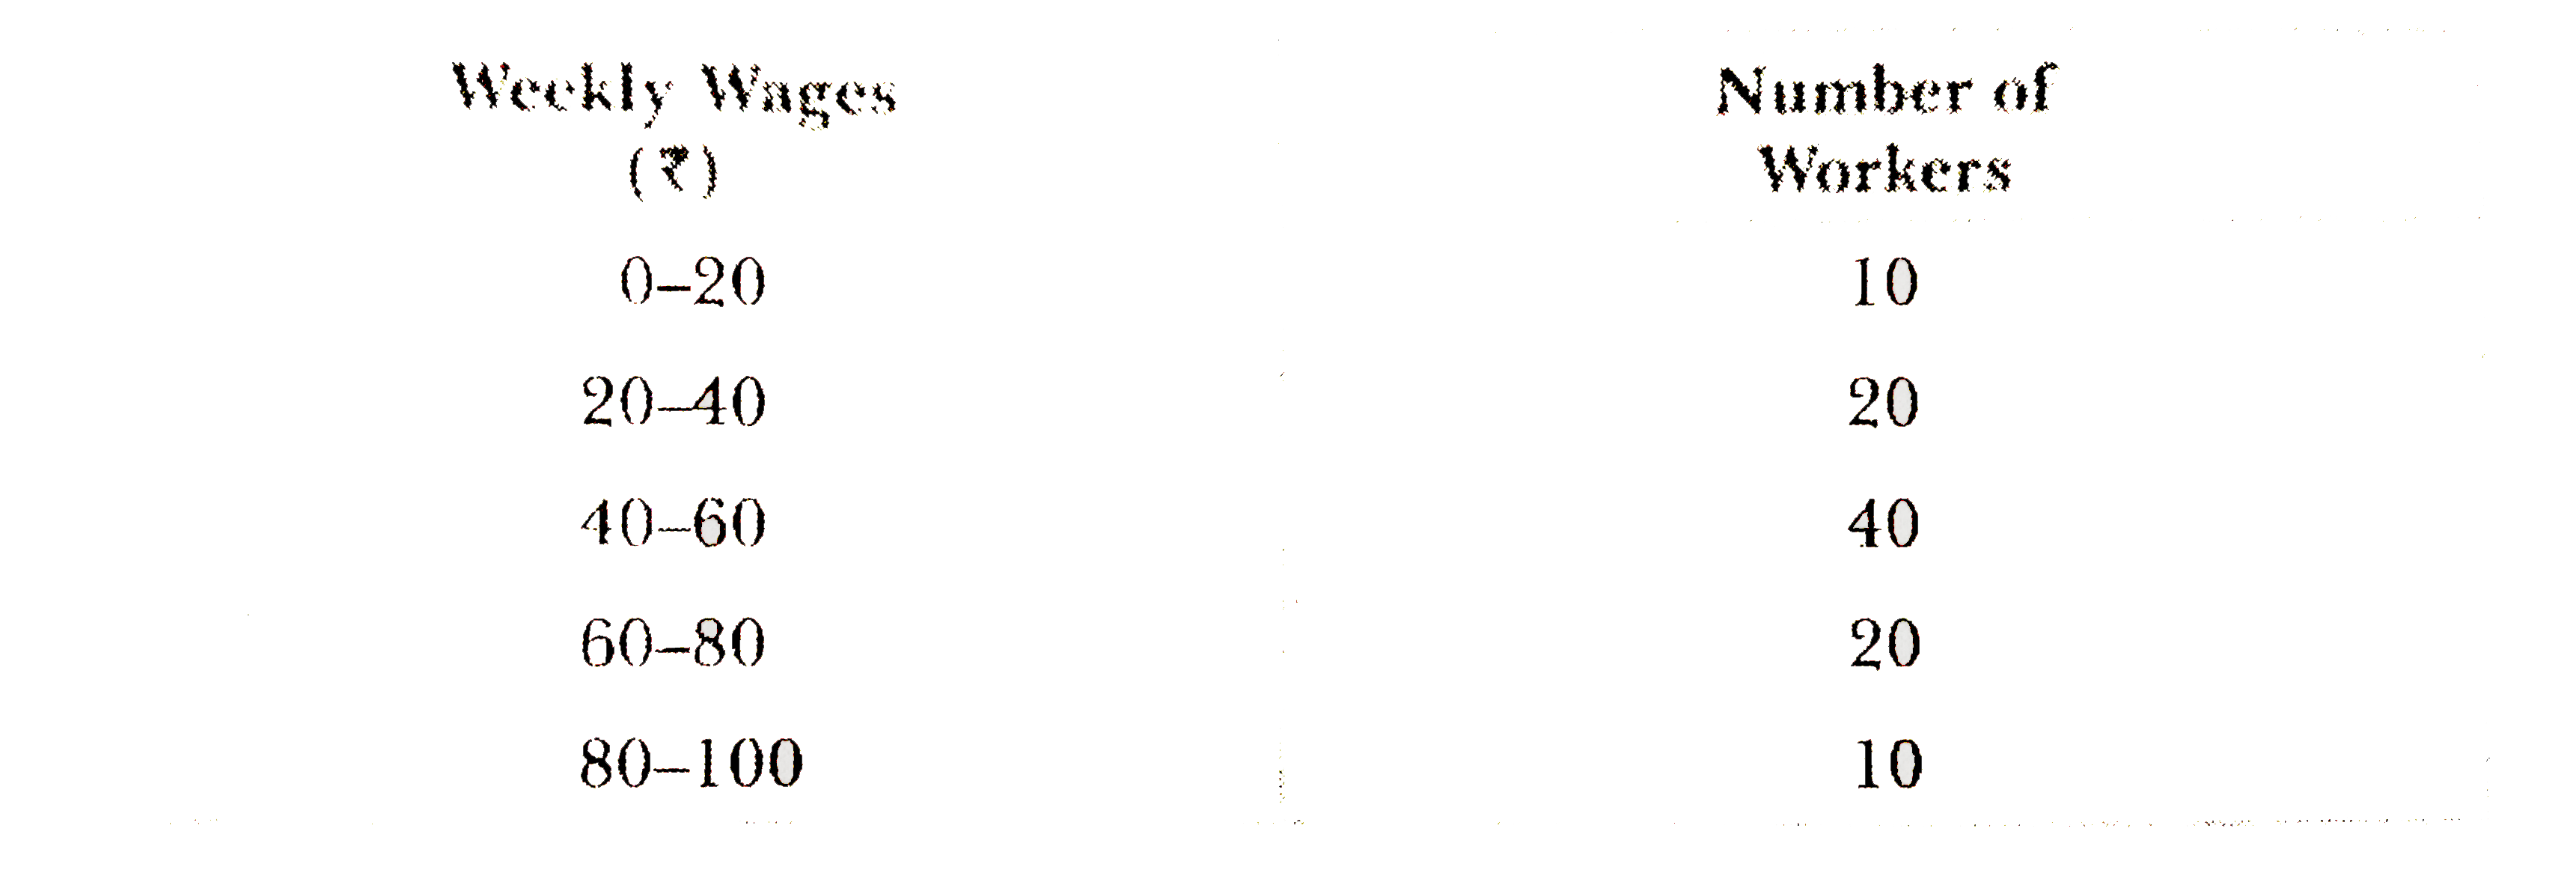
View SolutionDraw the 'less than' and 'more than' ogive on the same graph paper from the data given below :
View SolutionThe marks obtained by 100 students in a Mathematics test are given below :

Draw an ogive for the given distribution on a graph sheet.
(Use a scale of 2 cm = 10 units on both axis).
Use the ogive to estimate the number of students who obtained more than 85% marks in the test.
View SolutionDraw a more than ogive from the given data and estimate median with the help of ogive. :

View SolutionThe given graph shows the marks obtained by students in an examination.
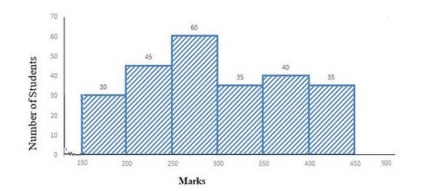 The number of students who obtained less than 300 marks is what percent more than the number of students who obtained 350 or more marks?
View SolutionThe given graph shows the marks obtained by students in an examination
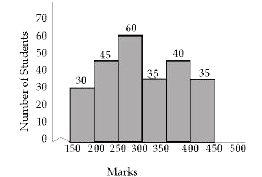
The number of students who obtained less than 300 marks is what percent more than the number of students who obtained 350 or more marks
View SolutionThe marks obtained (out of 100) by 400 students in an examination are given below:

Using a graph paper, draw an ogive for the above distribution. Use ogive to estimate the following: estimate the number of students who obtained more than marks in the examination.
View SolutionUse graph paper for this question.
The marks obtained by 120 students in an English test are given below :
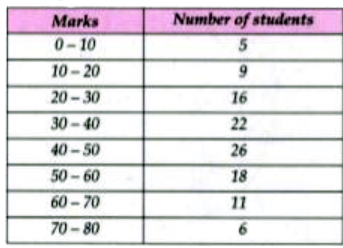

Draw the ogive and hence, estimate :
the median marks.
View SolutionFind the mode of the given data 4,5,5,4,7,2,3,4,2,4,5
View SolutionDuring the medical check-up of 35 students of a class, their weights were recorded as follows :
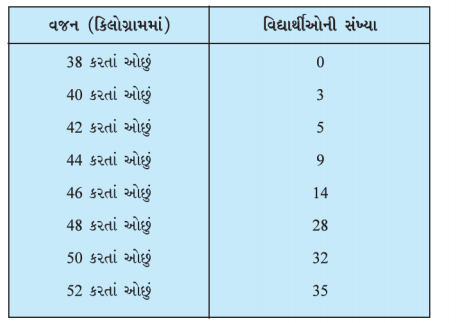
Draw a less than type ogive for the given data. Hence, obtain the median weight from the graph and verify the result by using the formula.
View SolutionDuring the medical check-up of 35 students of a class, their weights were recorded as follows :
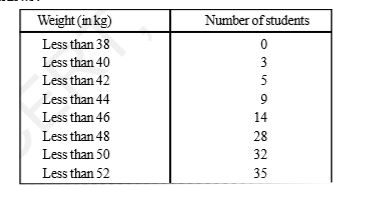
Draw a less than type ogive for the given data. Hence obtain the median weight from the graph and verify the result by using the formula.
View Solutionकिसी कक्षा के 35 विद्यार्थियों की मेडिकल जाँच के समय उनके भार निम्नलिखित रूप में रिकॉर्ड किए गए :
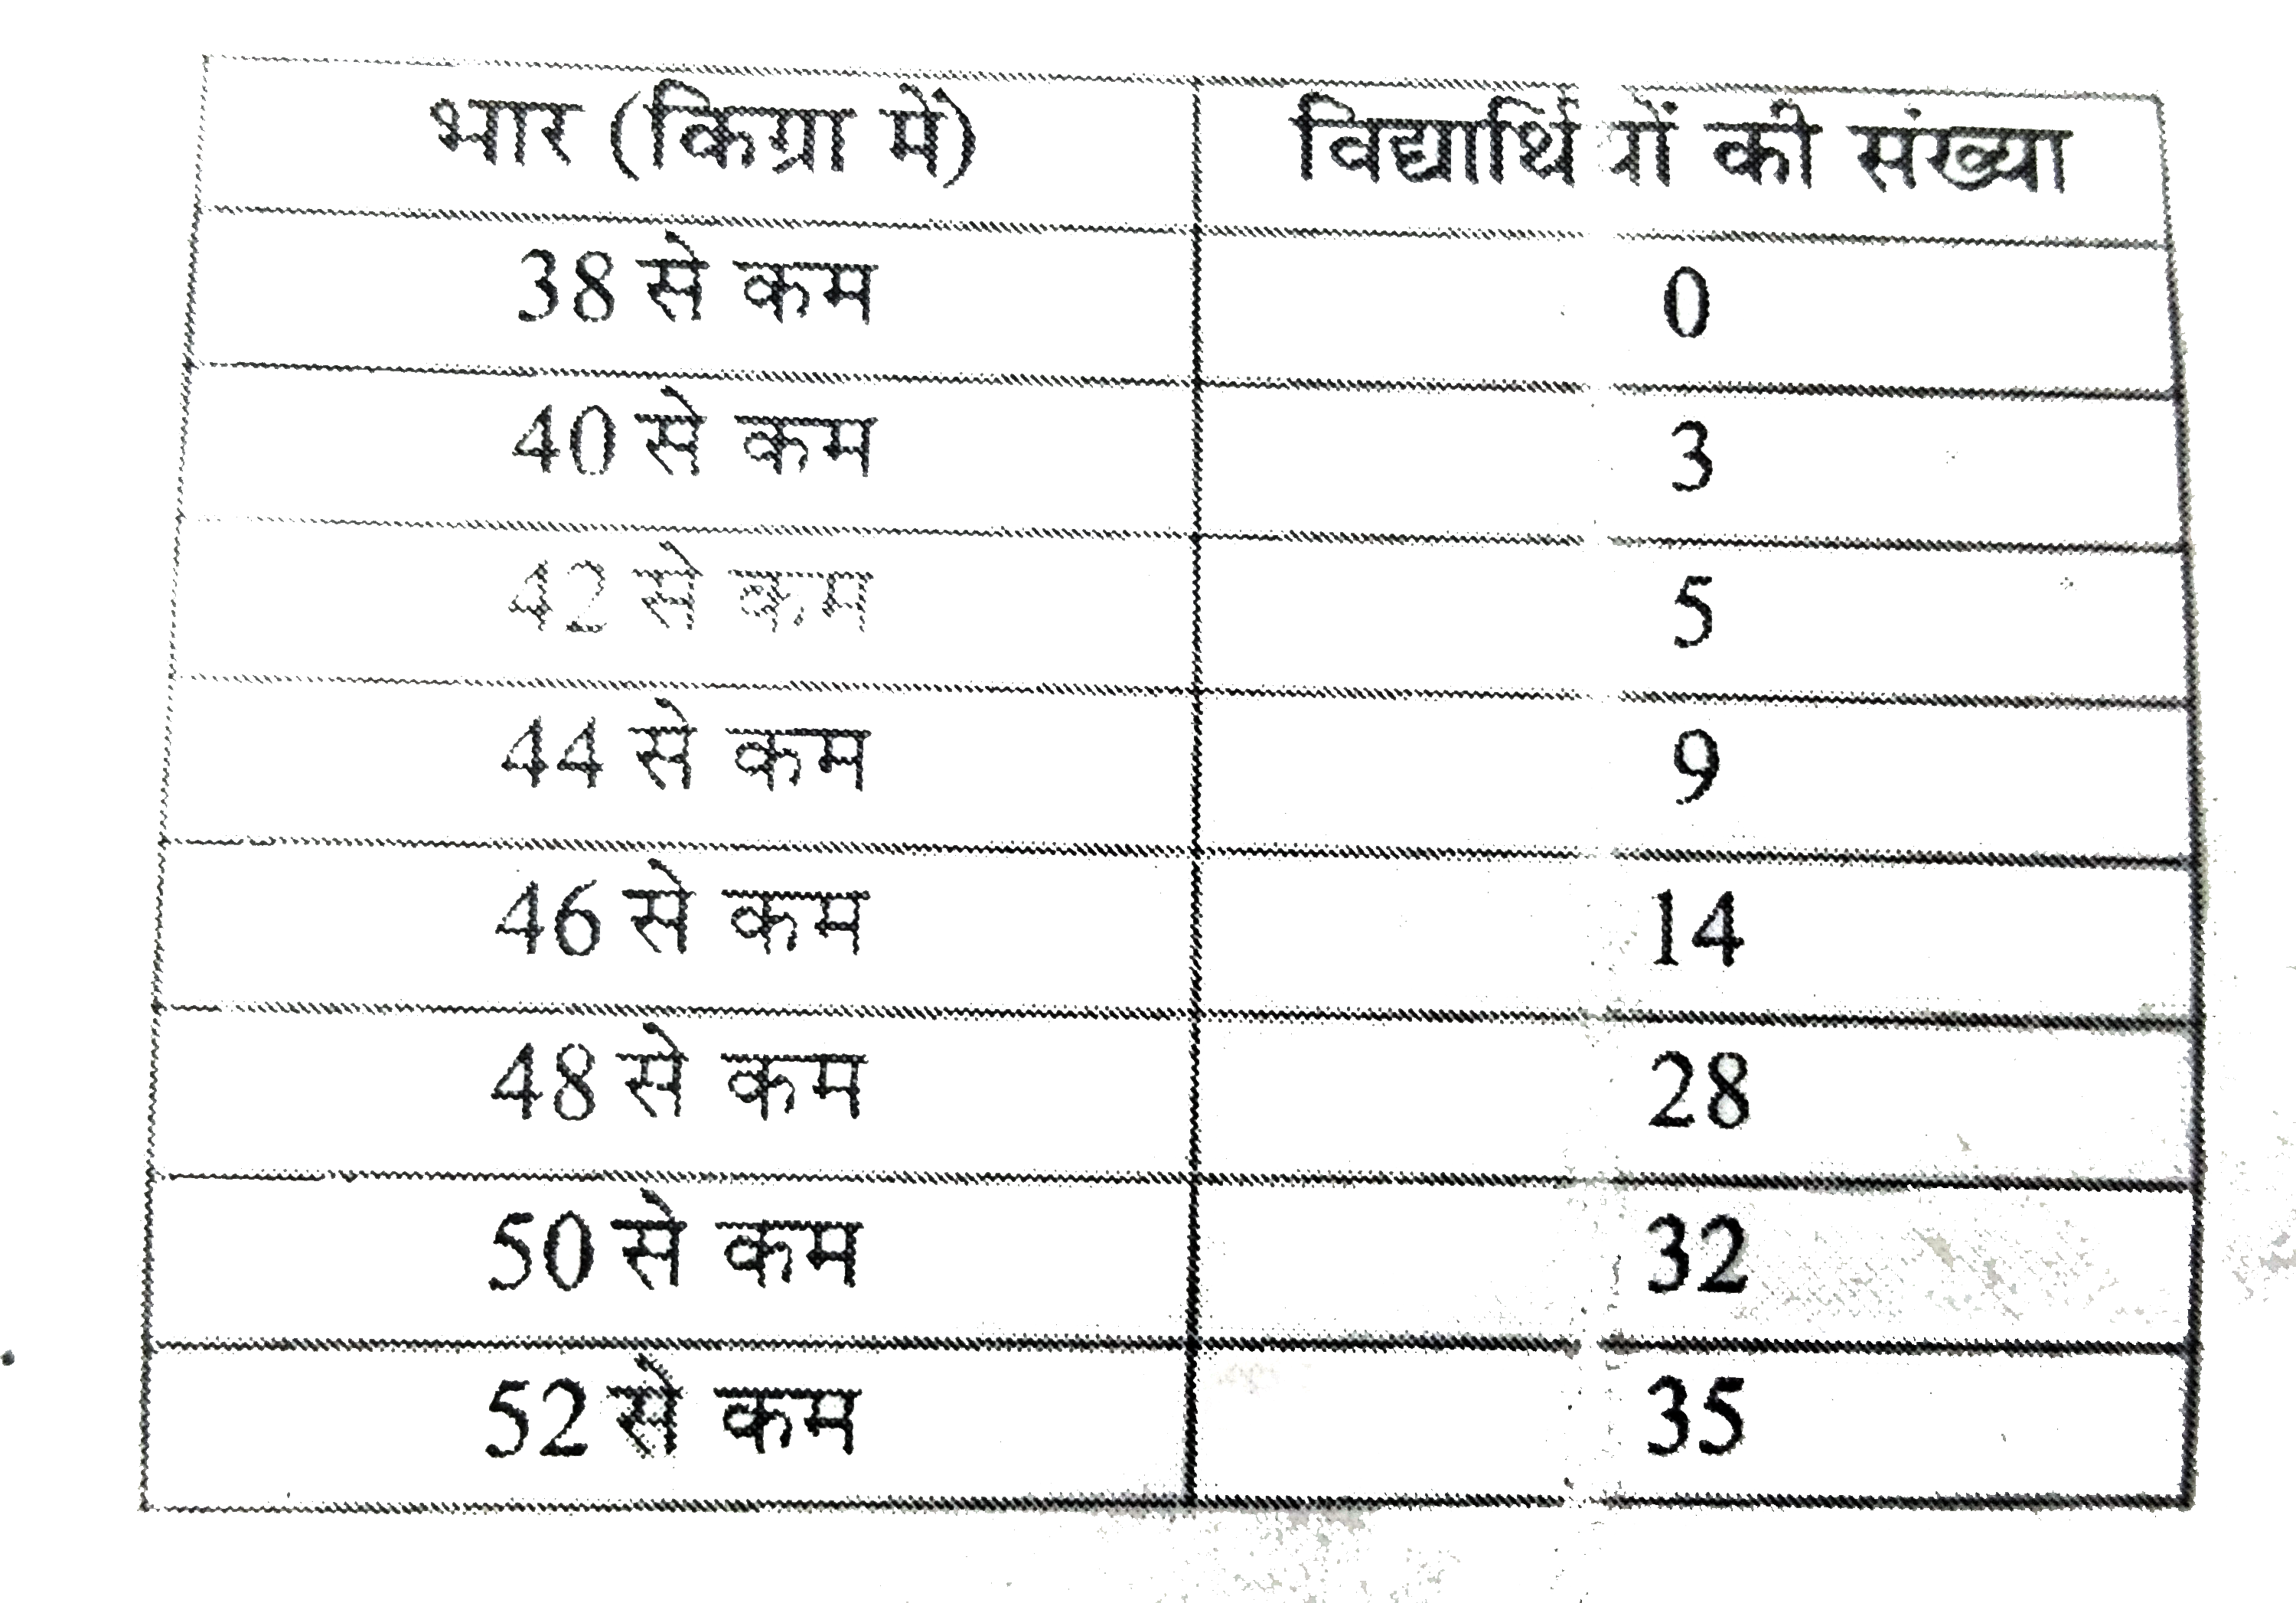
उपरोक्त आँकड़ों के लिए 'कम प्रकार का तोरण ' खींचिए। इसके बाद माध्यक भार ज्ञात कीजिए।
View SolutionDuring the medical check-up of 35 students of a class, their weights were recorded as follows:
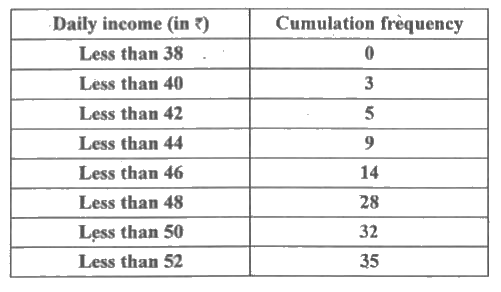
Draw a less than type ogive for the given data. Hence obtain the median weight from the graph and varify the result by using the formula.
View Solution