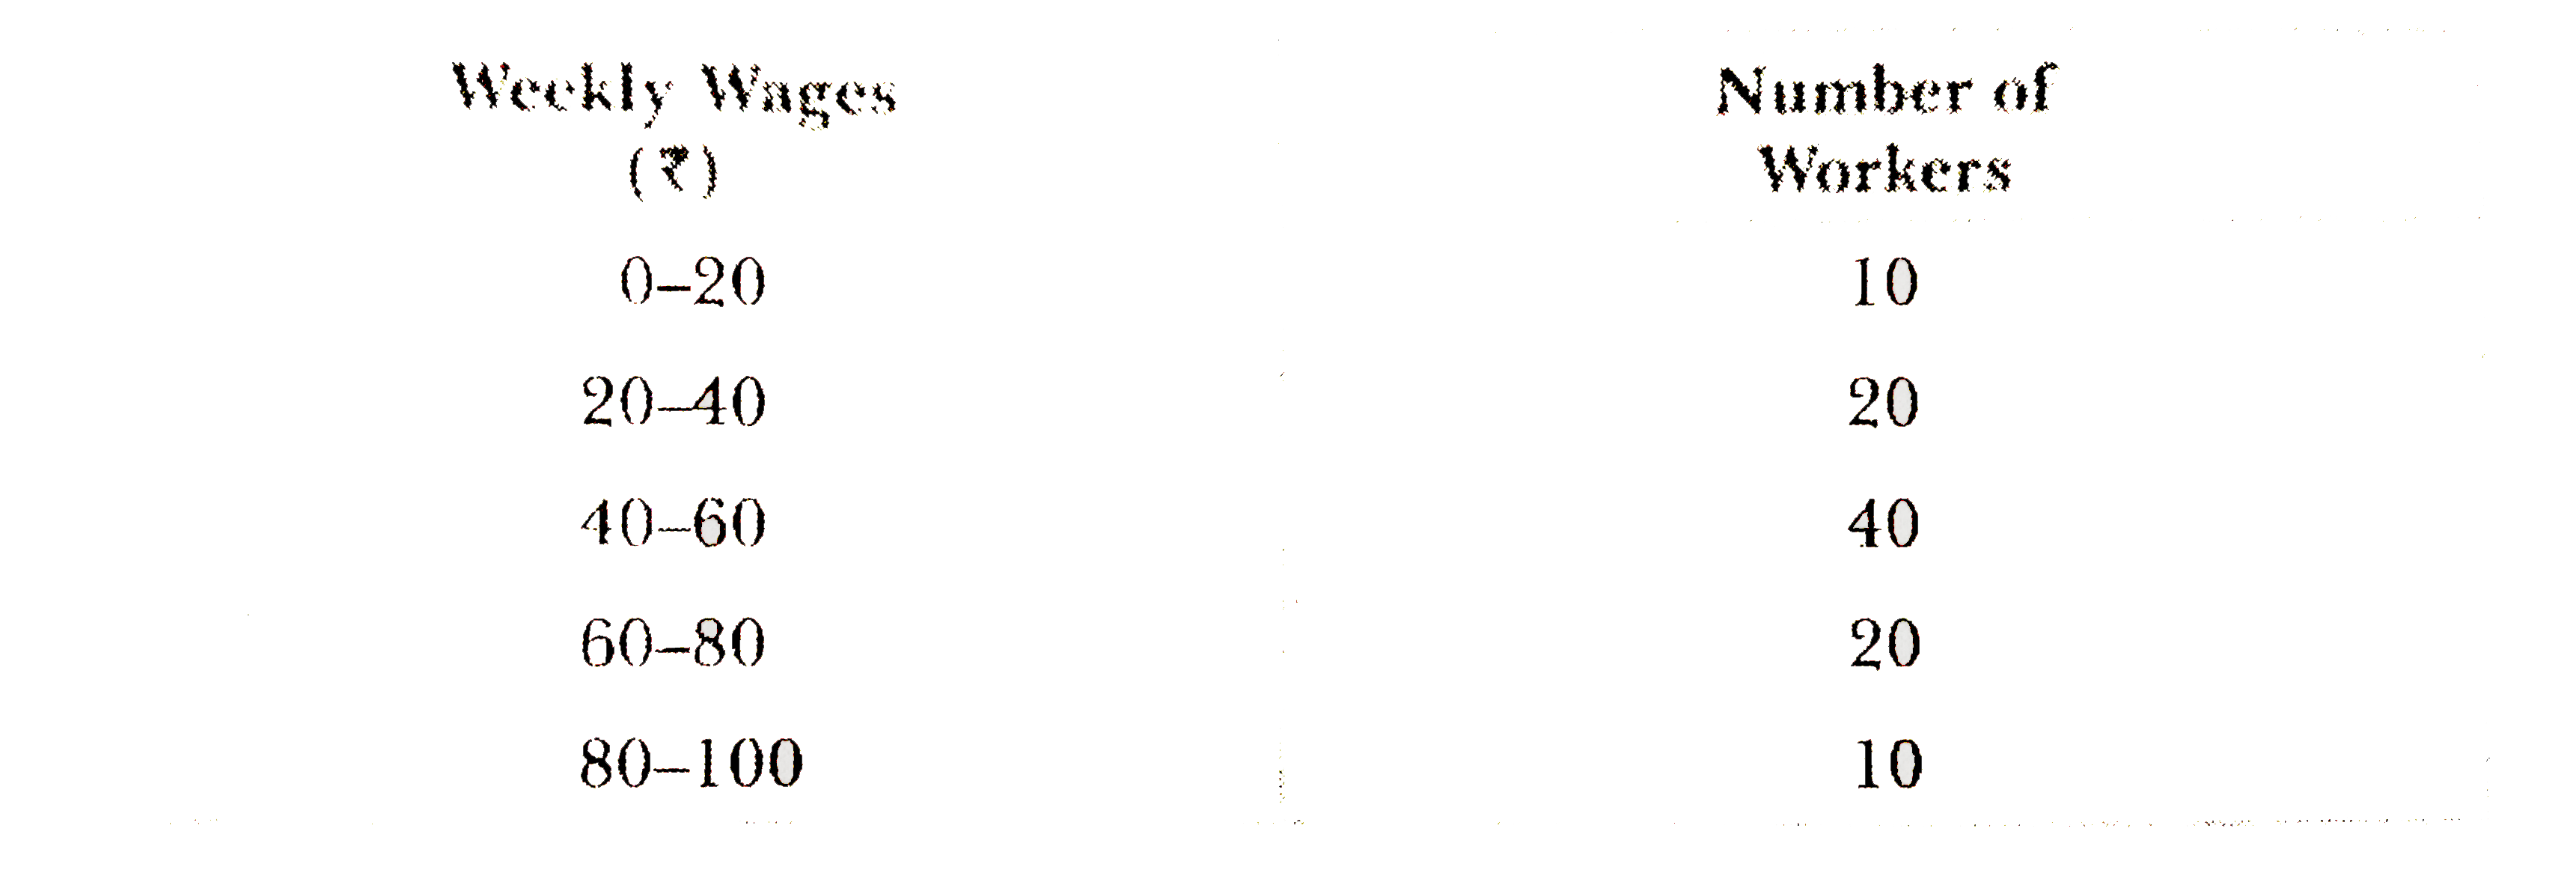
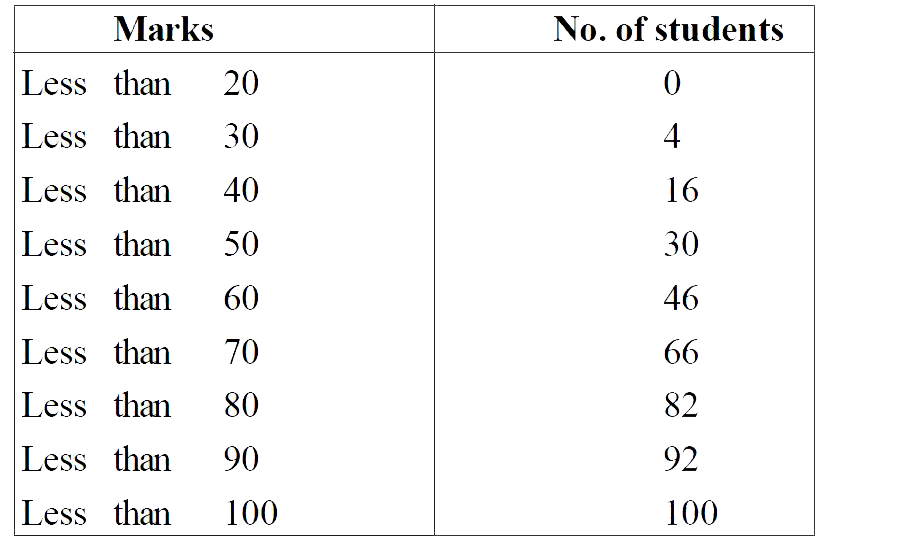
Draw the 'less than' and 'more than' ogive on the same graph paper from the data given below :
Video Solution
Text Solution
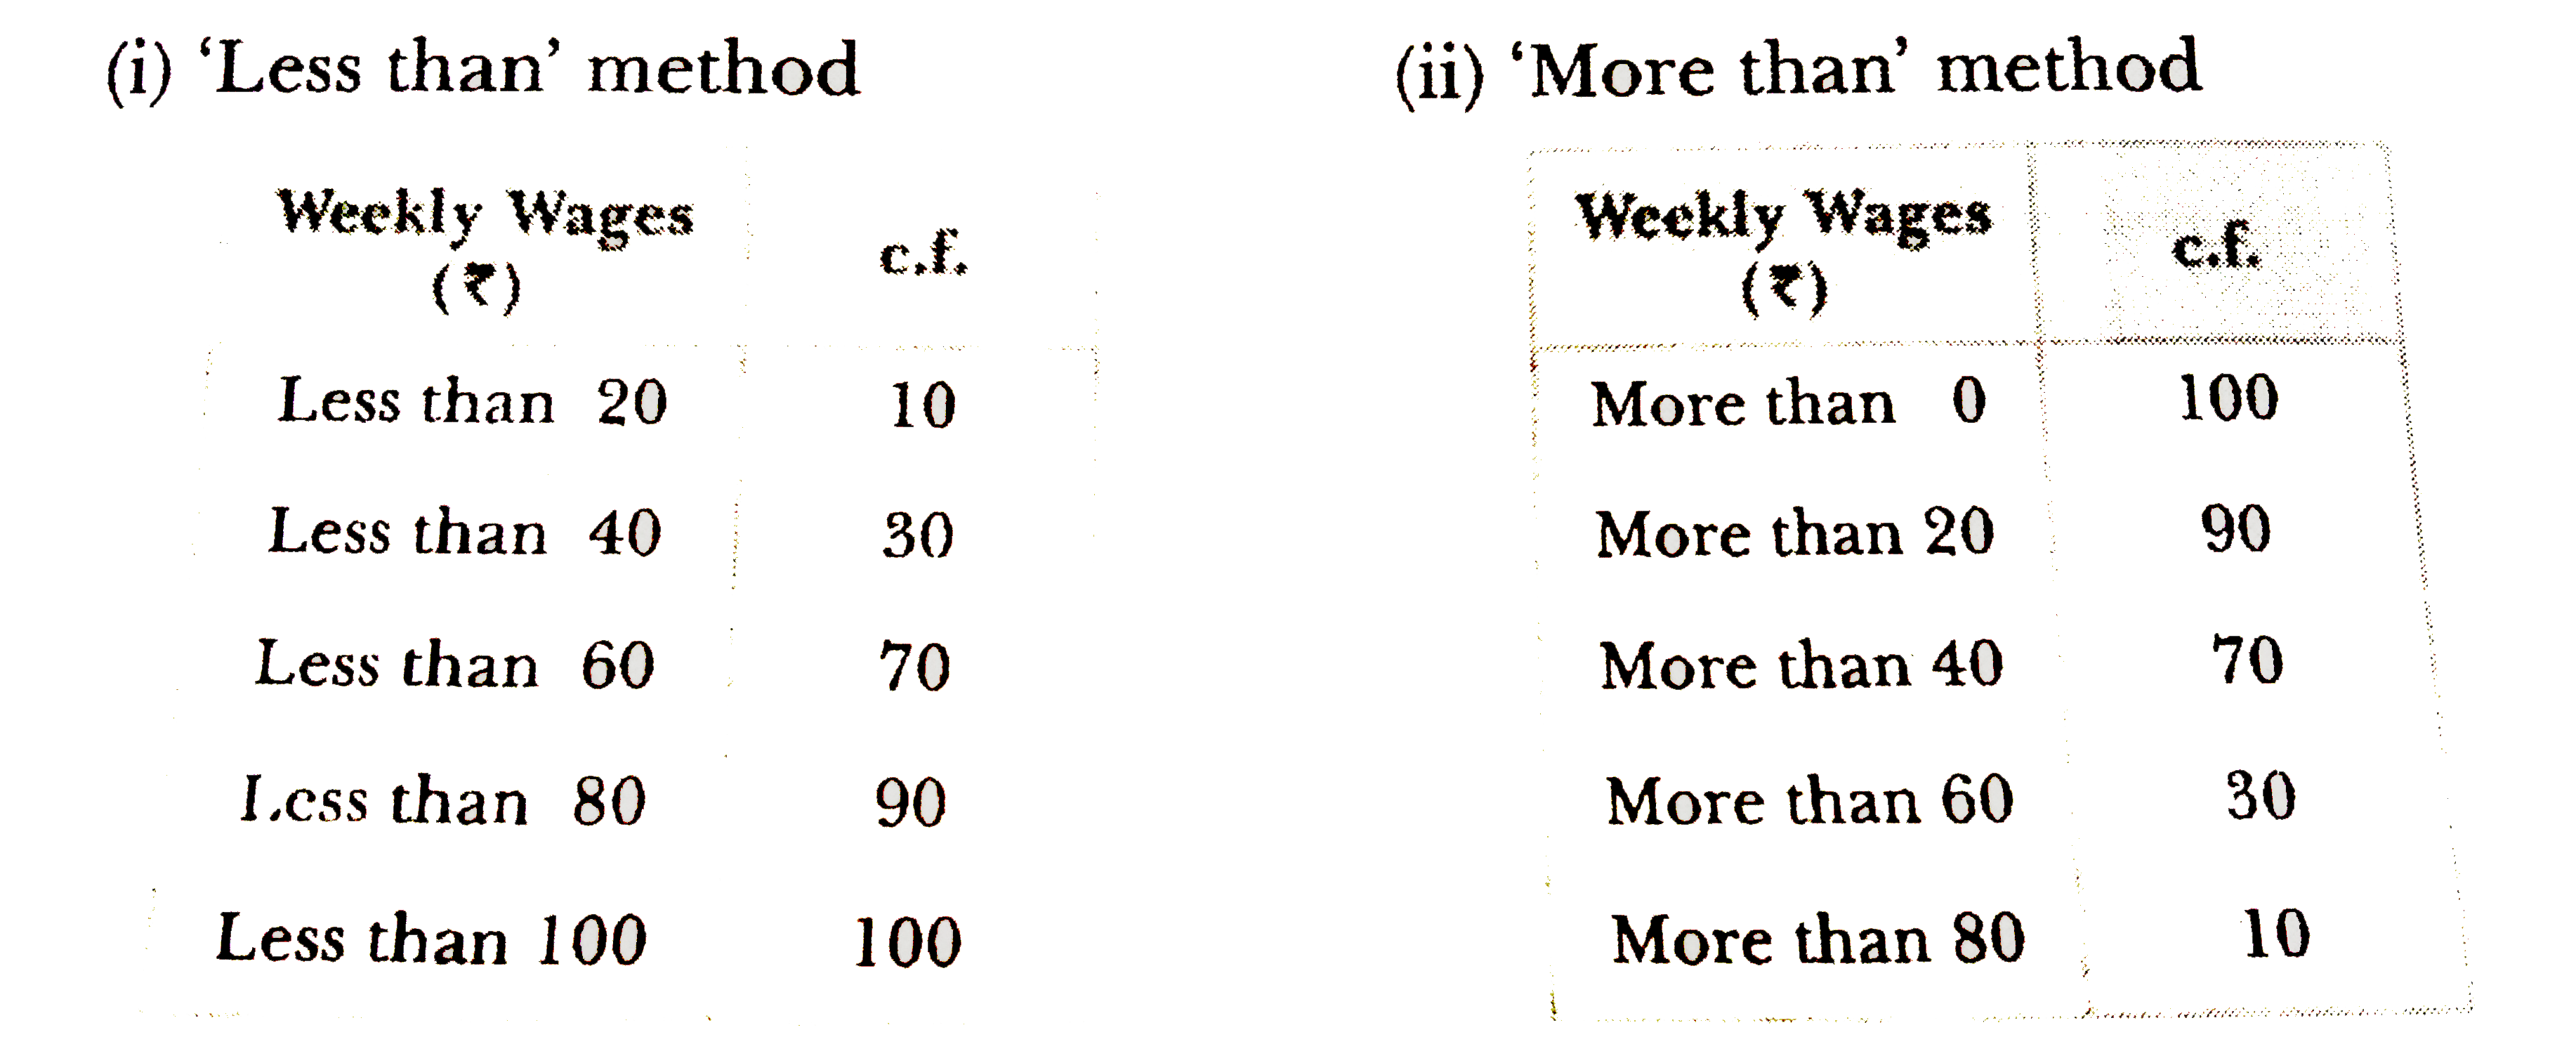
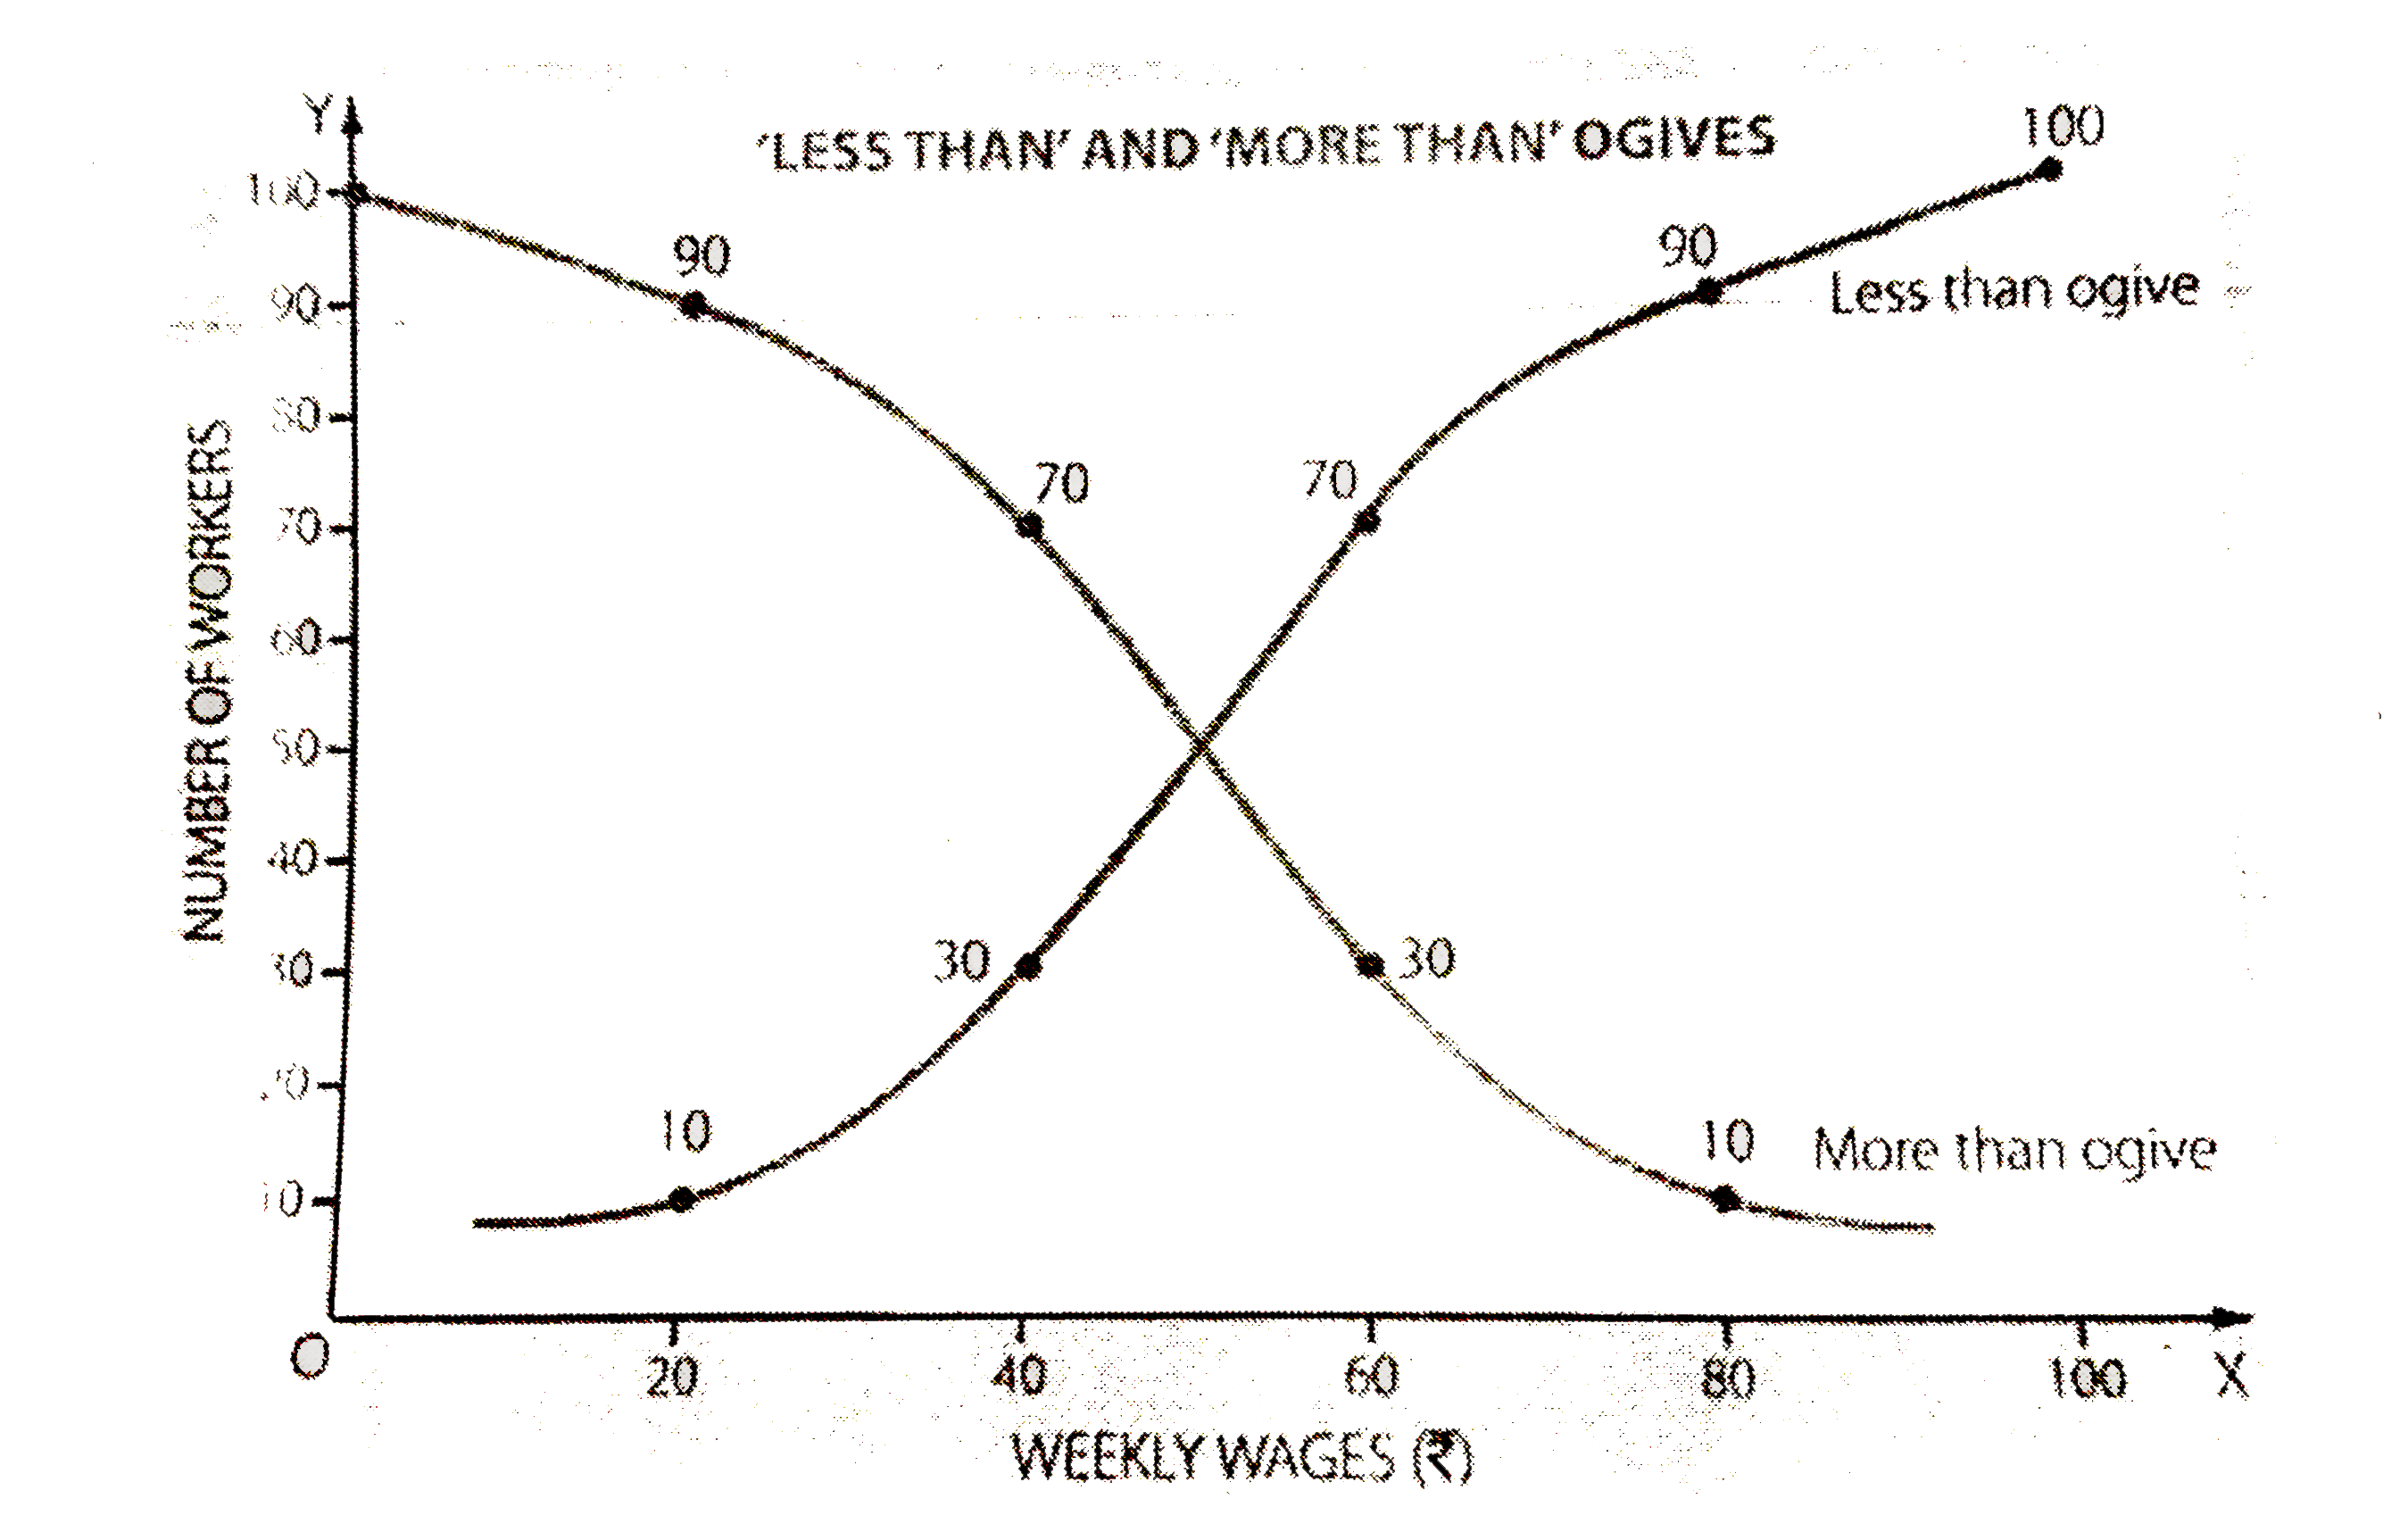
Both 'less than' and 'more than ' ogives based on the above data are presented in the following graph :
|
Topper's Solved these Questions
- FREQUENCY DIAGRAMS - HISTOGRAM, POLYGON AND OGIVEBOOK - TARUN JAIN & VK OHRICHAPTER - FREQUENCY DIAGRAMS - HISTOGRAM, POLYGON AND OGIVEEXERCISE - EXERCISE M.C.Q
6 Videos
- FREQUENCY DIAGRAMS - HISTOGRAM, POLYGON AND OGIVEBOOK - TARUN JAIN & VK OHRICHAPTER - FREQUENCY DIAGRAMS - HISTOGRAM, POLYGON AND OGIVEEXERCISE - EXERCISE FILL IN THE BLANK
5 Videos
- FREQUENCY DIAGRAMS - HISTOGRAM, POLYGON AND OGIVEBOOK - TARUN JAIN & VK OHRICHAPTER - FREQUENCY DIAGRAMS - HISTOGRAM, POLYGON AND OGIVEEXERCISE - EXERCISE NCERT
7 Videos
- DIAGRAMMATIC PRESENTATION OF DATA BAR DIAGRAMS AND PIE DIAGRAMSBOOK - TARUN JAIN & VK OHRICHAPTER - DIAGRAMMATIC PRESENTATION OF DATA BAR DIAGRAMS AND PIE DIAGRAMSEXERCISE - NCERT Question (With Hints to Answers)
3 Videos
- INDEX NUMBERSBOOK - TARUN JAIN & VK OHRICHAPTER - INDEX NUMBERSEXERCISE - NCERT Questions (With Hints to Answers)
12 Videos
Similar Questions
Knowledge Check
The 'less than' ogive curve and the 'more than' ogive curve intersect at
AmedianBmodeCarithmetic meanDNone of the aboveIf the 'less than ' and the 'more than' ogive given intersect at the point (27,34) , then find the median of the distribution and also find the total number of observations .
A27,34B54,34C54,68D27,68If the 'less than type' ogive and 'more than type' ogive intersect each other at (20.5, 15.5) then the median of the given data is
A5.5B15.5C20.5D36
Draw a less than and more than median weight from the graph and type ogive for the given data. Hence find the verify the result by using the formula.
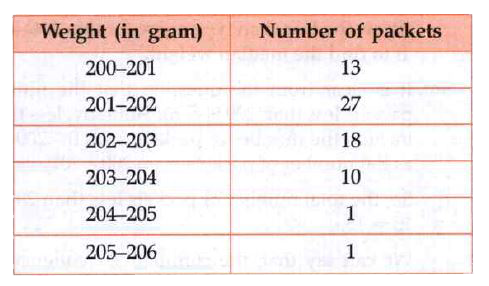
View SolutionThe weighs of tea in 70 packets are shown in the following table:
Draw the less than type and more than type ogives for the data and use them to find the median weight.
View SolutionThe point where ' less than ogive' and more than ogive ' intersect each other determines median .
View SolutionDraw a 'less than' ogive of the following data
View SolutionConstruct a less than ogive and a more than ogive from the following data :

View Solution

