Label the given graph :iiiiiiaLog phaseExponantial phaseStationary phasebExponantial phaseLog phaseStationary phasecStationary phaseLog phaseExponantial phasedLog phaseStationary phaseExponantial phase
Related Solutions
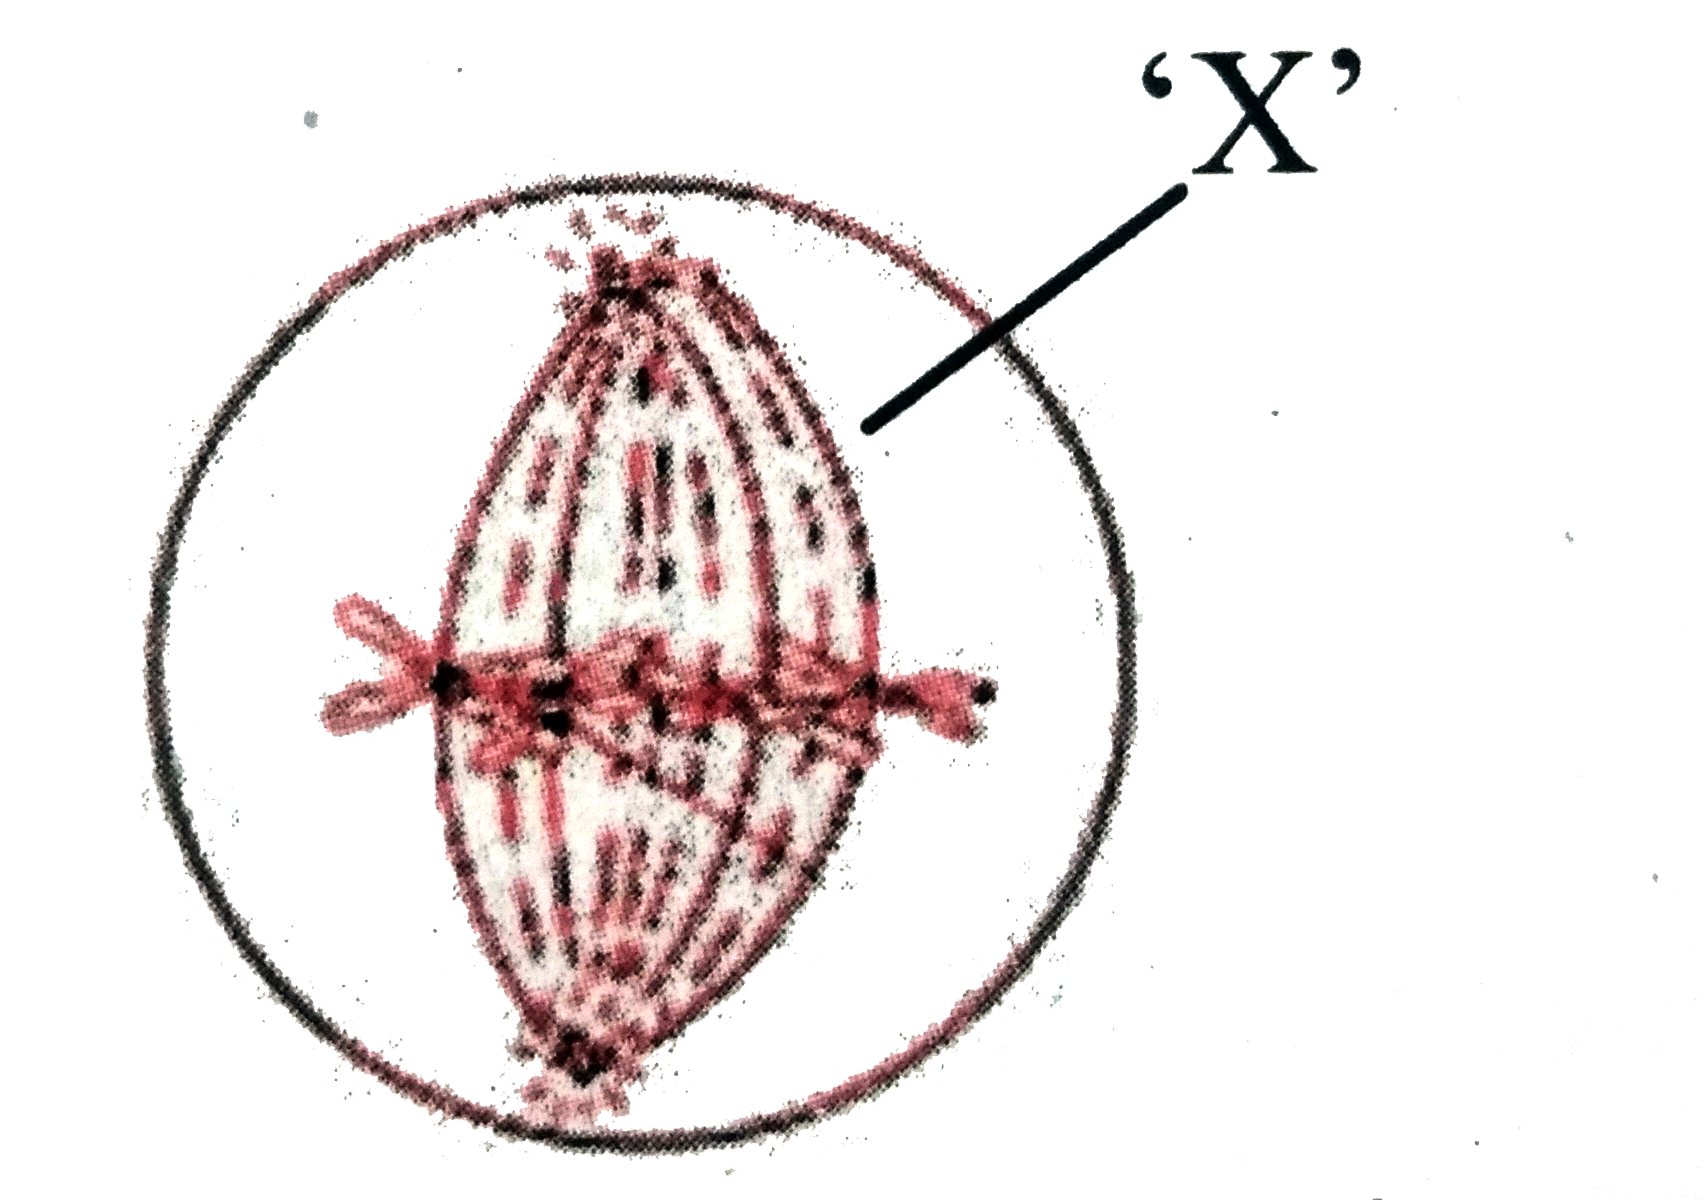
Observe the given diagram . Identify the phase of mitosis and the part labelled as 'X' in the diagram.
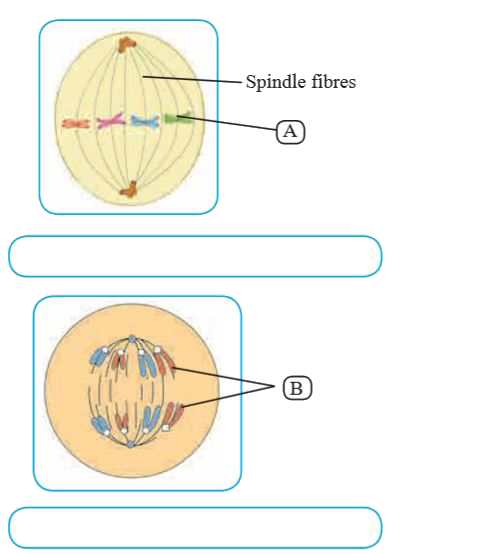
View SolutionIdentify the following phases of mitosis and label the 'A' and 'B' given in diagrams
View SolutionIdentify the following phases of mitosis and label the 'A' and 'B' given in diagrams.
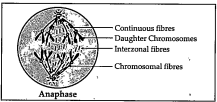
View SolutionIdentify the following phases of mitosis and label the 'A' and 'B' given in diagrams.
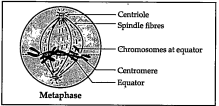
View SolutionIdentify phases labeled as A, B, and C in a given sigmoidal growth curve.
View SolutionSketch and label the phases of oogenesis.
View SolutionLabel PQRST in the graph.
 .
.
View SolutionRefer to the given graph carefully and answer the following question.
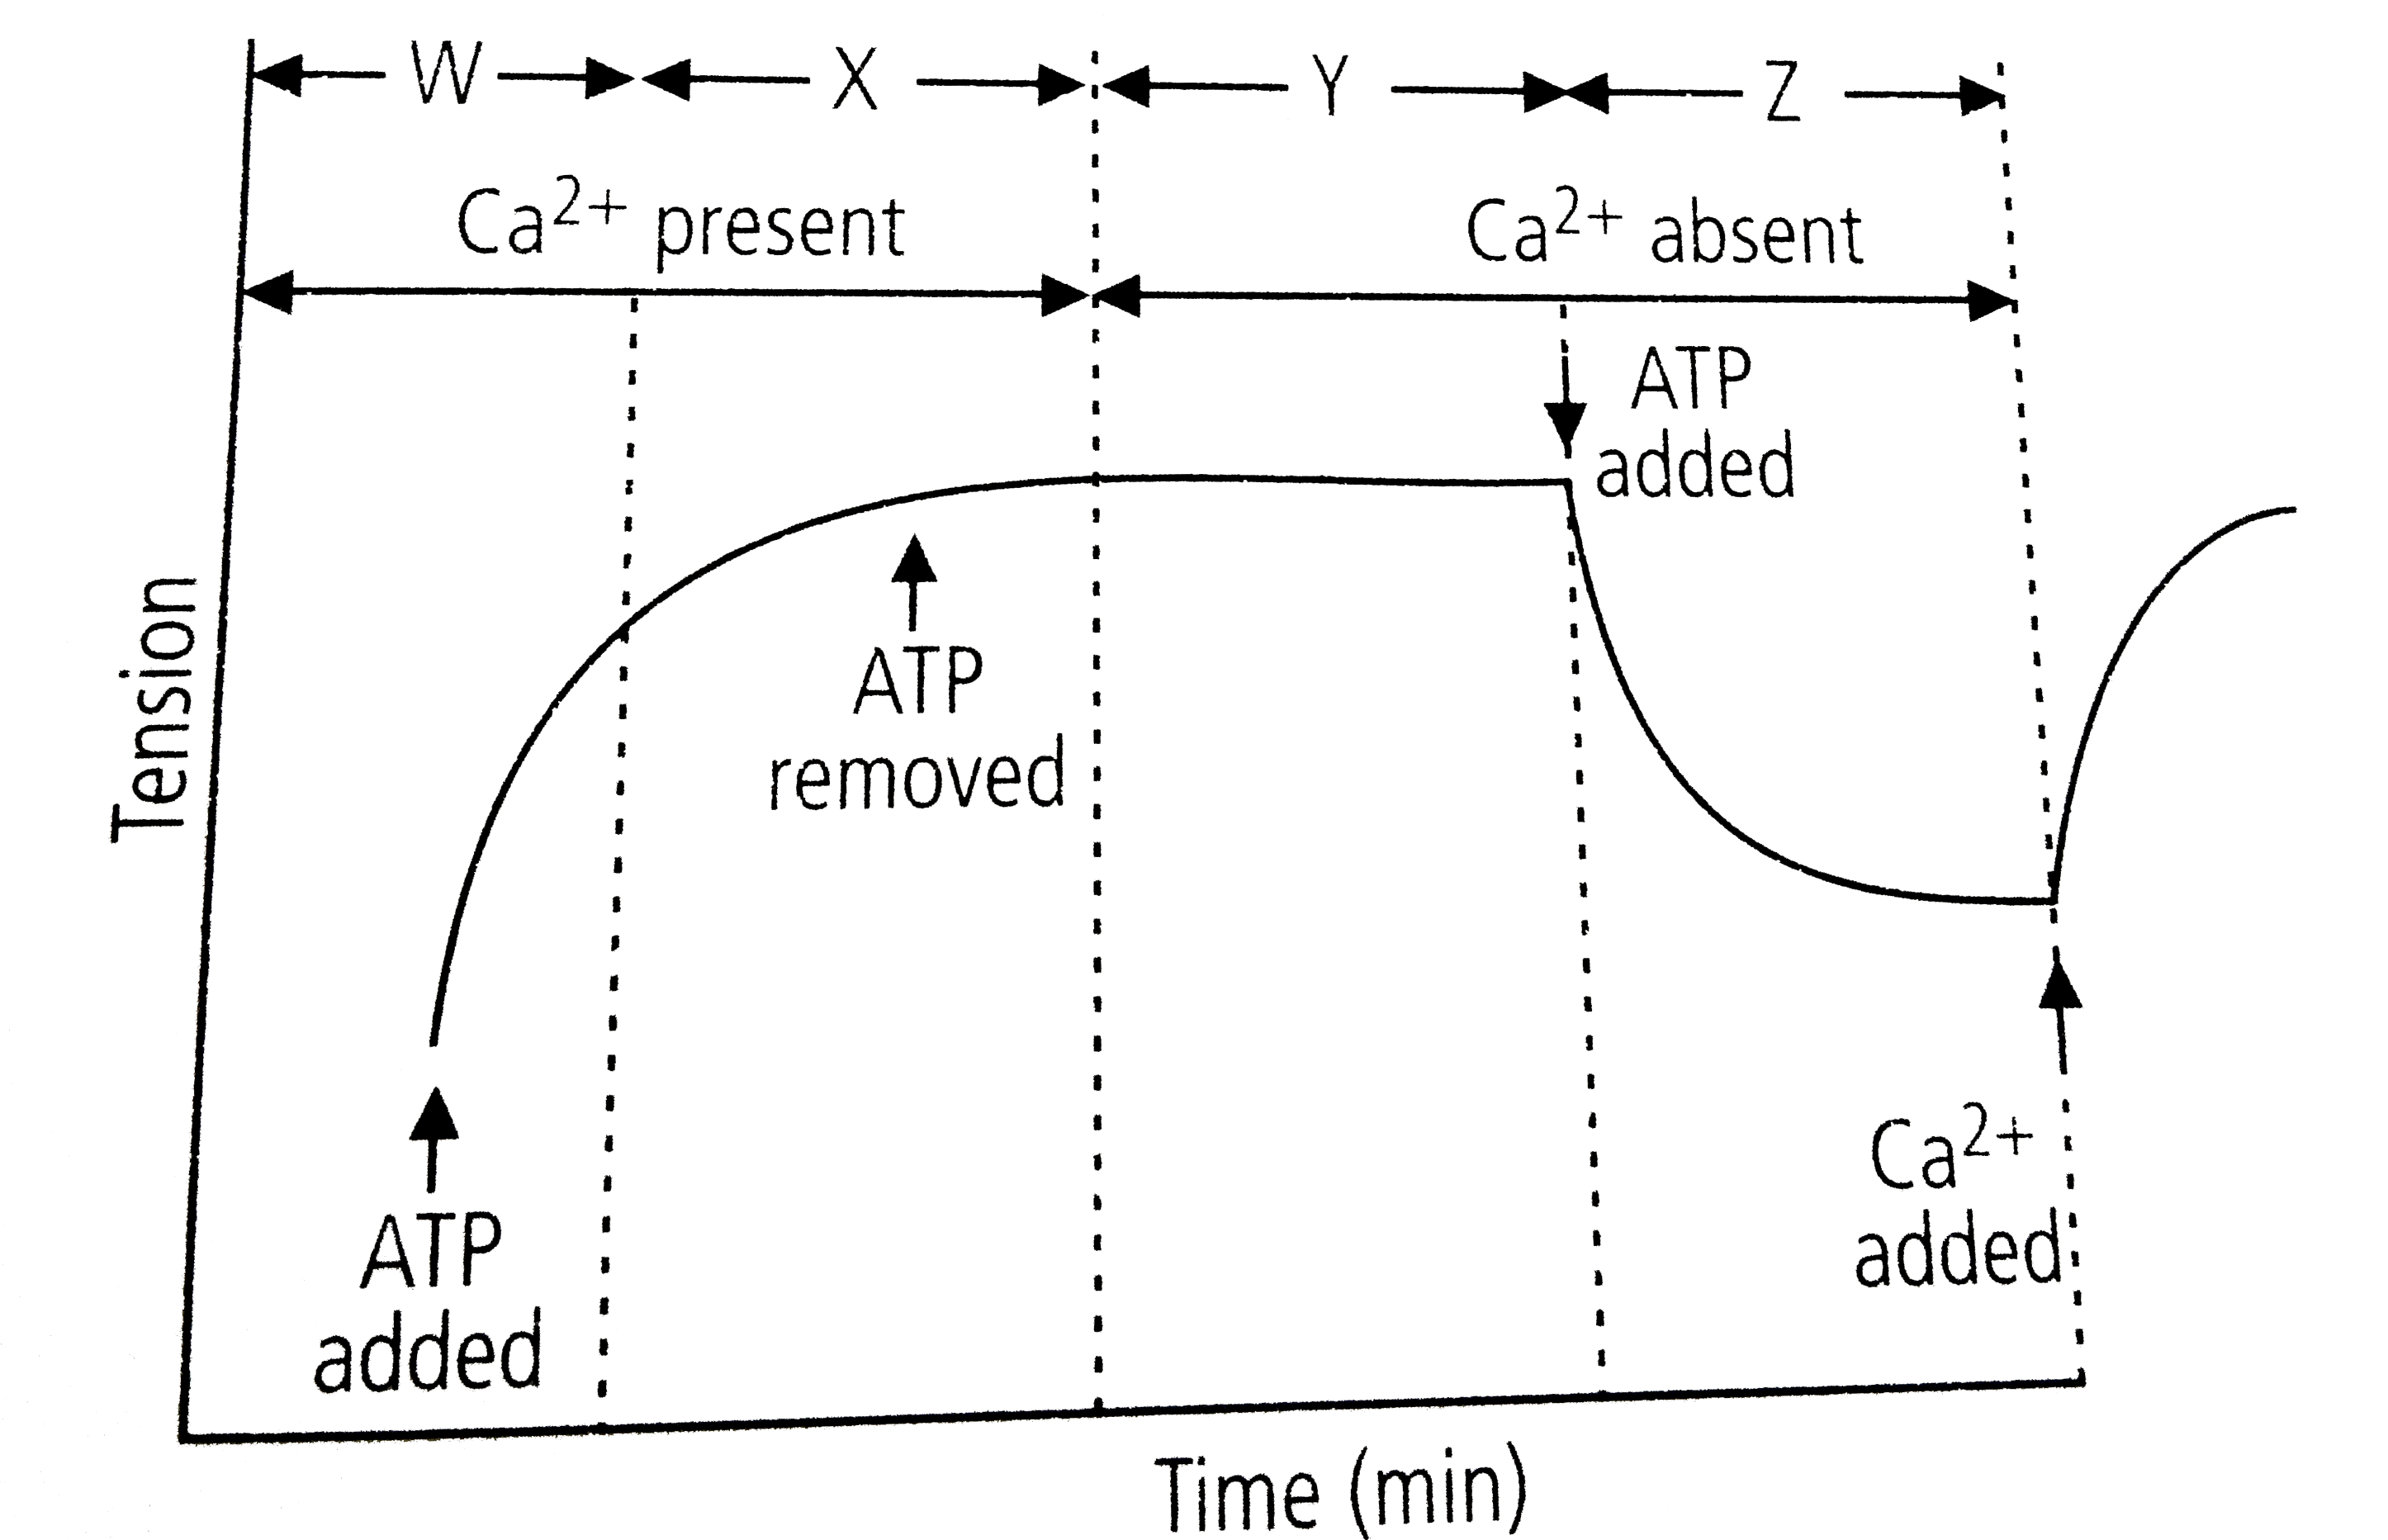
Which of the labelled parts on the graph represents rigor mortis?
View SolutionRefer to the given graph carefully and answer the following question.

Which of the labelled parts on the graph represents rigor mortis?
View SolutionRefer to the given graph carefully and answer the following question.

Which of the labelled parts on the graph represents rigor mortis?
View SolutionS আকৃতির লেখচিত্রের পর্যায় - [ i ] ল্যাগ দশা [ ii ] ত্বরণ দশা [ iii ] লগ দশা [ iv ] ধারণ দশা
View SolutionA V-I graph for a nichrome wire is given below. What do you infer from this graph? Draw a labelled circuit diagram to obtain such a graph.

View SolutionThe graph shows the level of ovarian hormones in a normally menstruating women during follicular phase. Reconstruct the hormonal graph for luteal phase. .
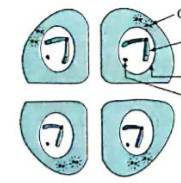
View SolutionLabel the diagram below. Which phase of cell division is seen in the diagram given below?
View SolutionThe given graph shows the change in DNA content during various phases (A to D) in a typical mitotic cell cycle. Identify the phases and select the correct option.
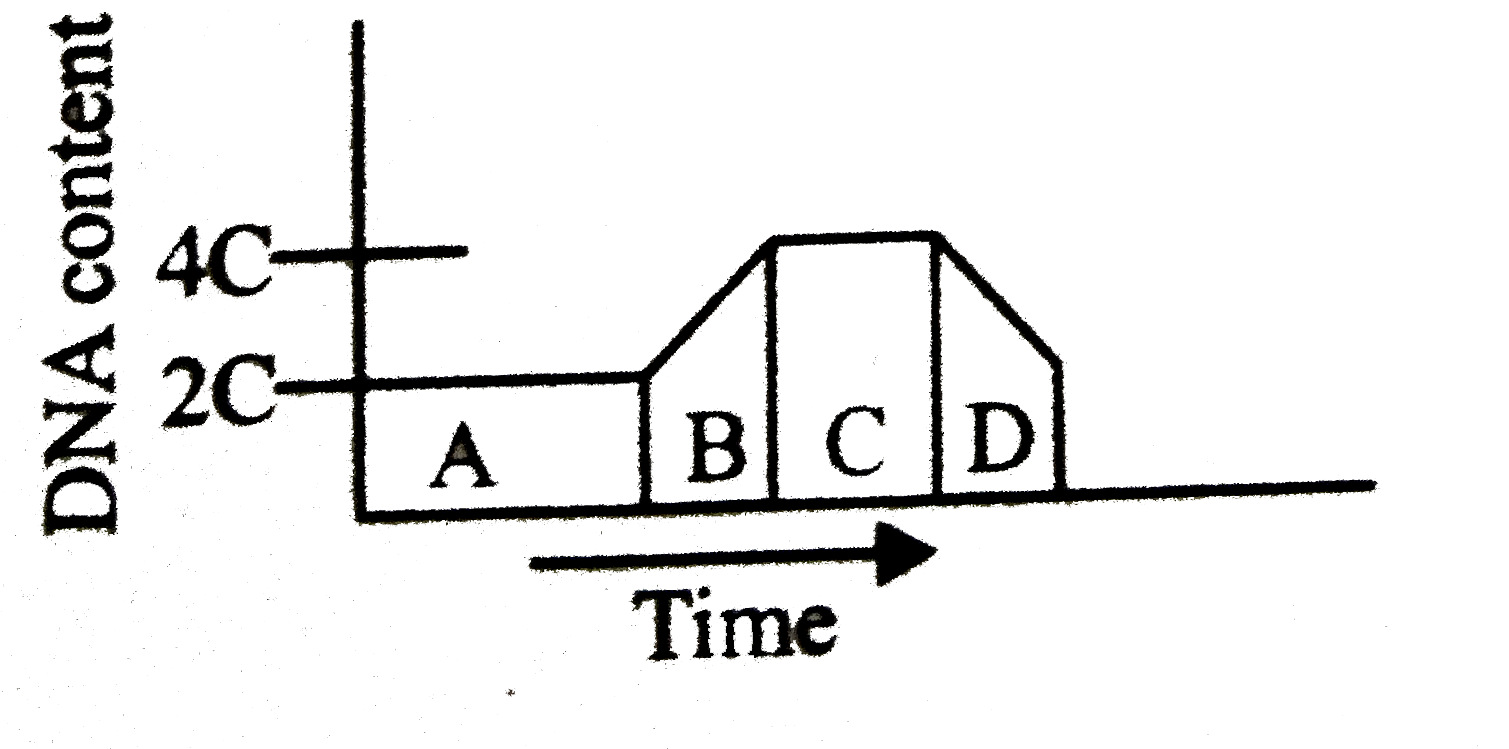
View SolutionThe given graph shows the change in DNA content during various phases (A to D) in a typical mitotic cell cycle. Identify the phases and select the correct option.

View SolutionThe given graph shows the change in DNA content during various phases (A to D) in a typical mitotic cell cycle. Identify the phases and select the correct option.

View SolutionWith a well labelled graph explain elastic hysteresis.
View SolutionDraw neat and scientitic diagrams of each of 'Second Phase' and 'Third Phase' of Karyokinesis of Mitosis in an animal cell and label the Centromere.
View SolutionDraw neat and scientitic diagrams of each of 'Second Phase' and 'Third Phase' of Karyokinesis of Mitosis in an animal cell and label the Continuous Fibre .
View Solution