A V-I graph for a nichrome wire is given below. What do you infer from this graph? Draw a labelled circuit diagram to obtain such a graph.

Graph between V and I is a straight line . So, this infers that the flow of current (I) in the conductor is directly proportional to the potential diffidence (V) established across it . This is ohm.s law
Resistance of the wire can be calculated as
R=VI=0.8−0.2 = 4 ohm
This means nichrome wire has a constant value of the resistance 4 ohm

Similar Questions
Knowledge Check
- Question 1 - Select One
The graph of displacement v/s time is given below. Its corresponding velocity-time graph will be :
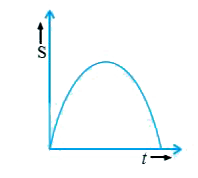 A
A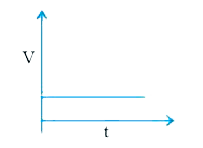 B
B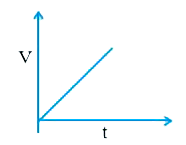 C
C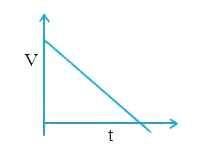 D
D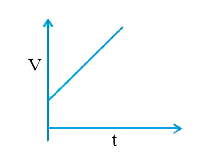
- Question 2 - Select One
What can be said from graph below?
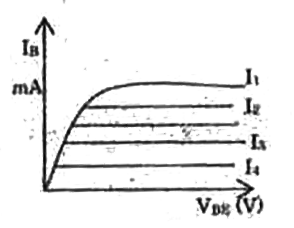 AI1+I42=I2+I32BI4>I3>I2>I1CI1>I2>I3>I4DI1×I4=I2×I3
 - Question 3 - Select One
The equation of the graph given below is
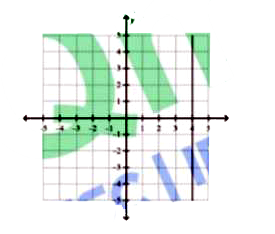 AY=4BX=4CX=−4DY=0
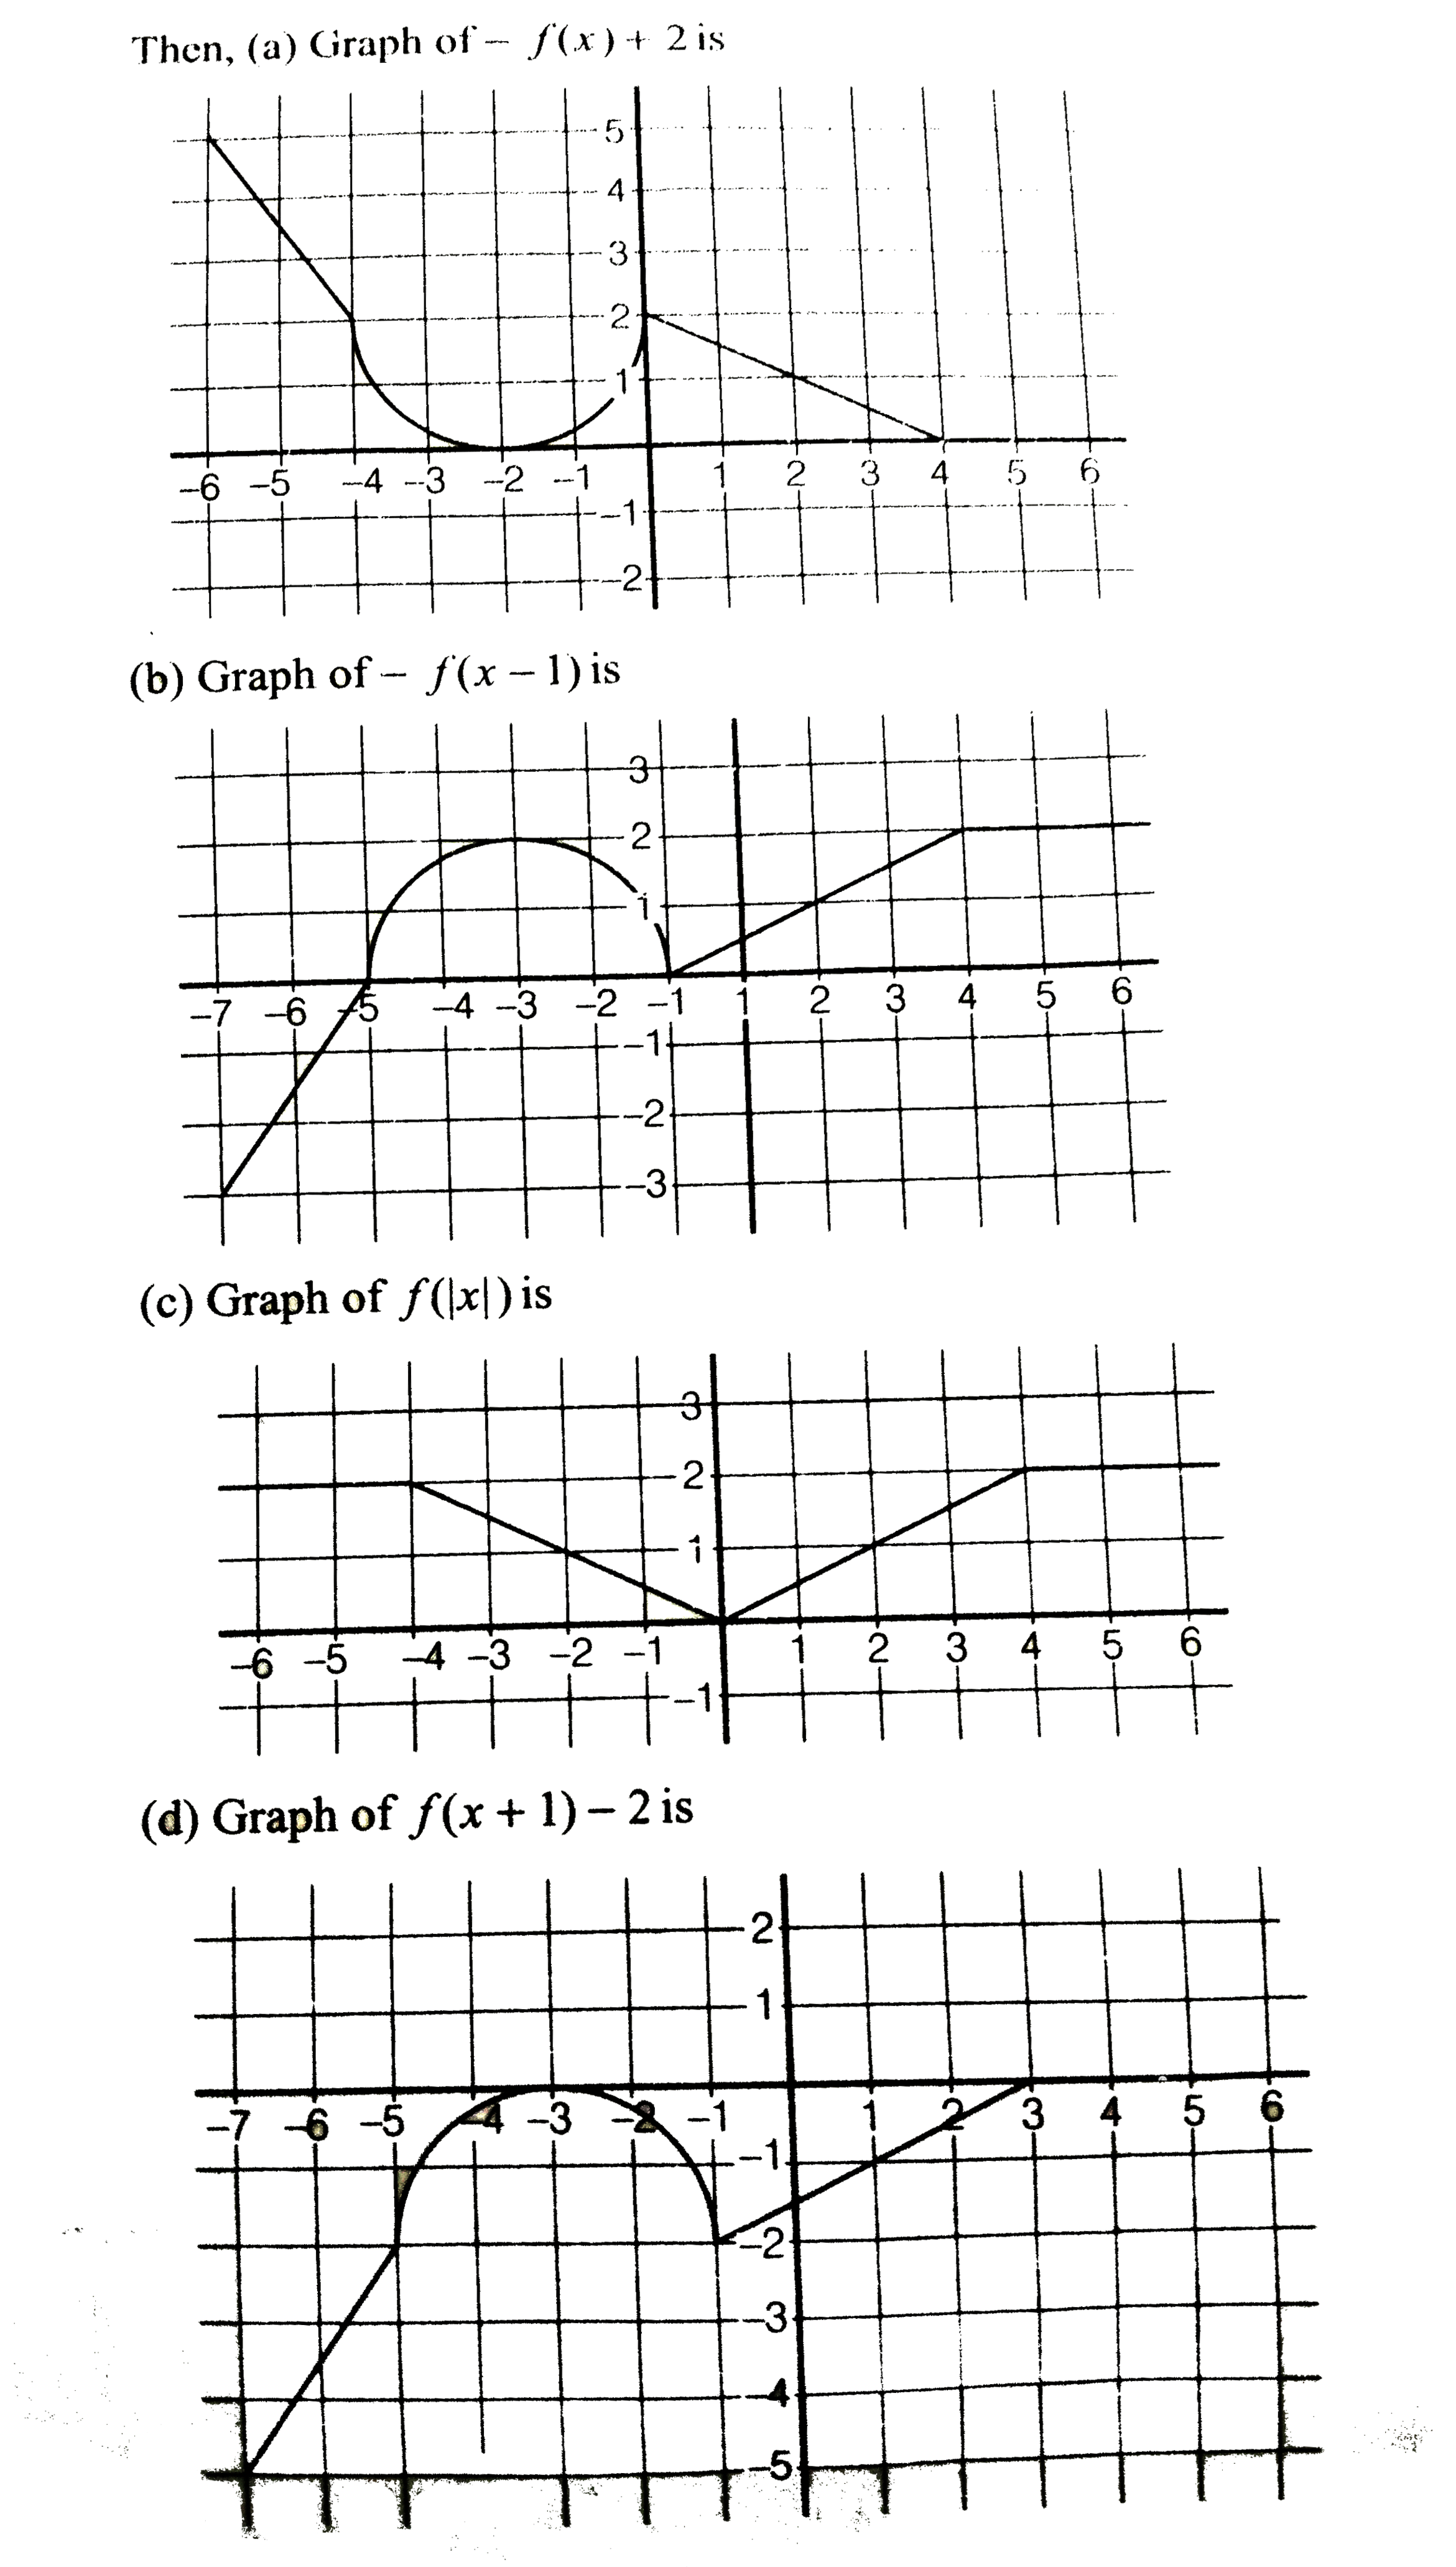
The graph of f(x) is given below.
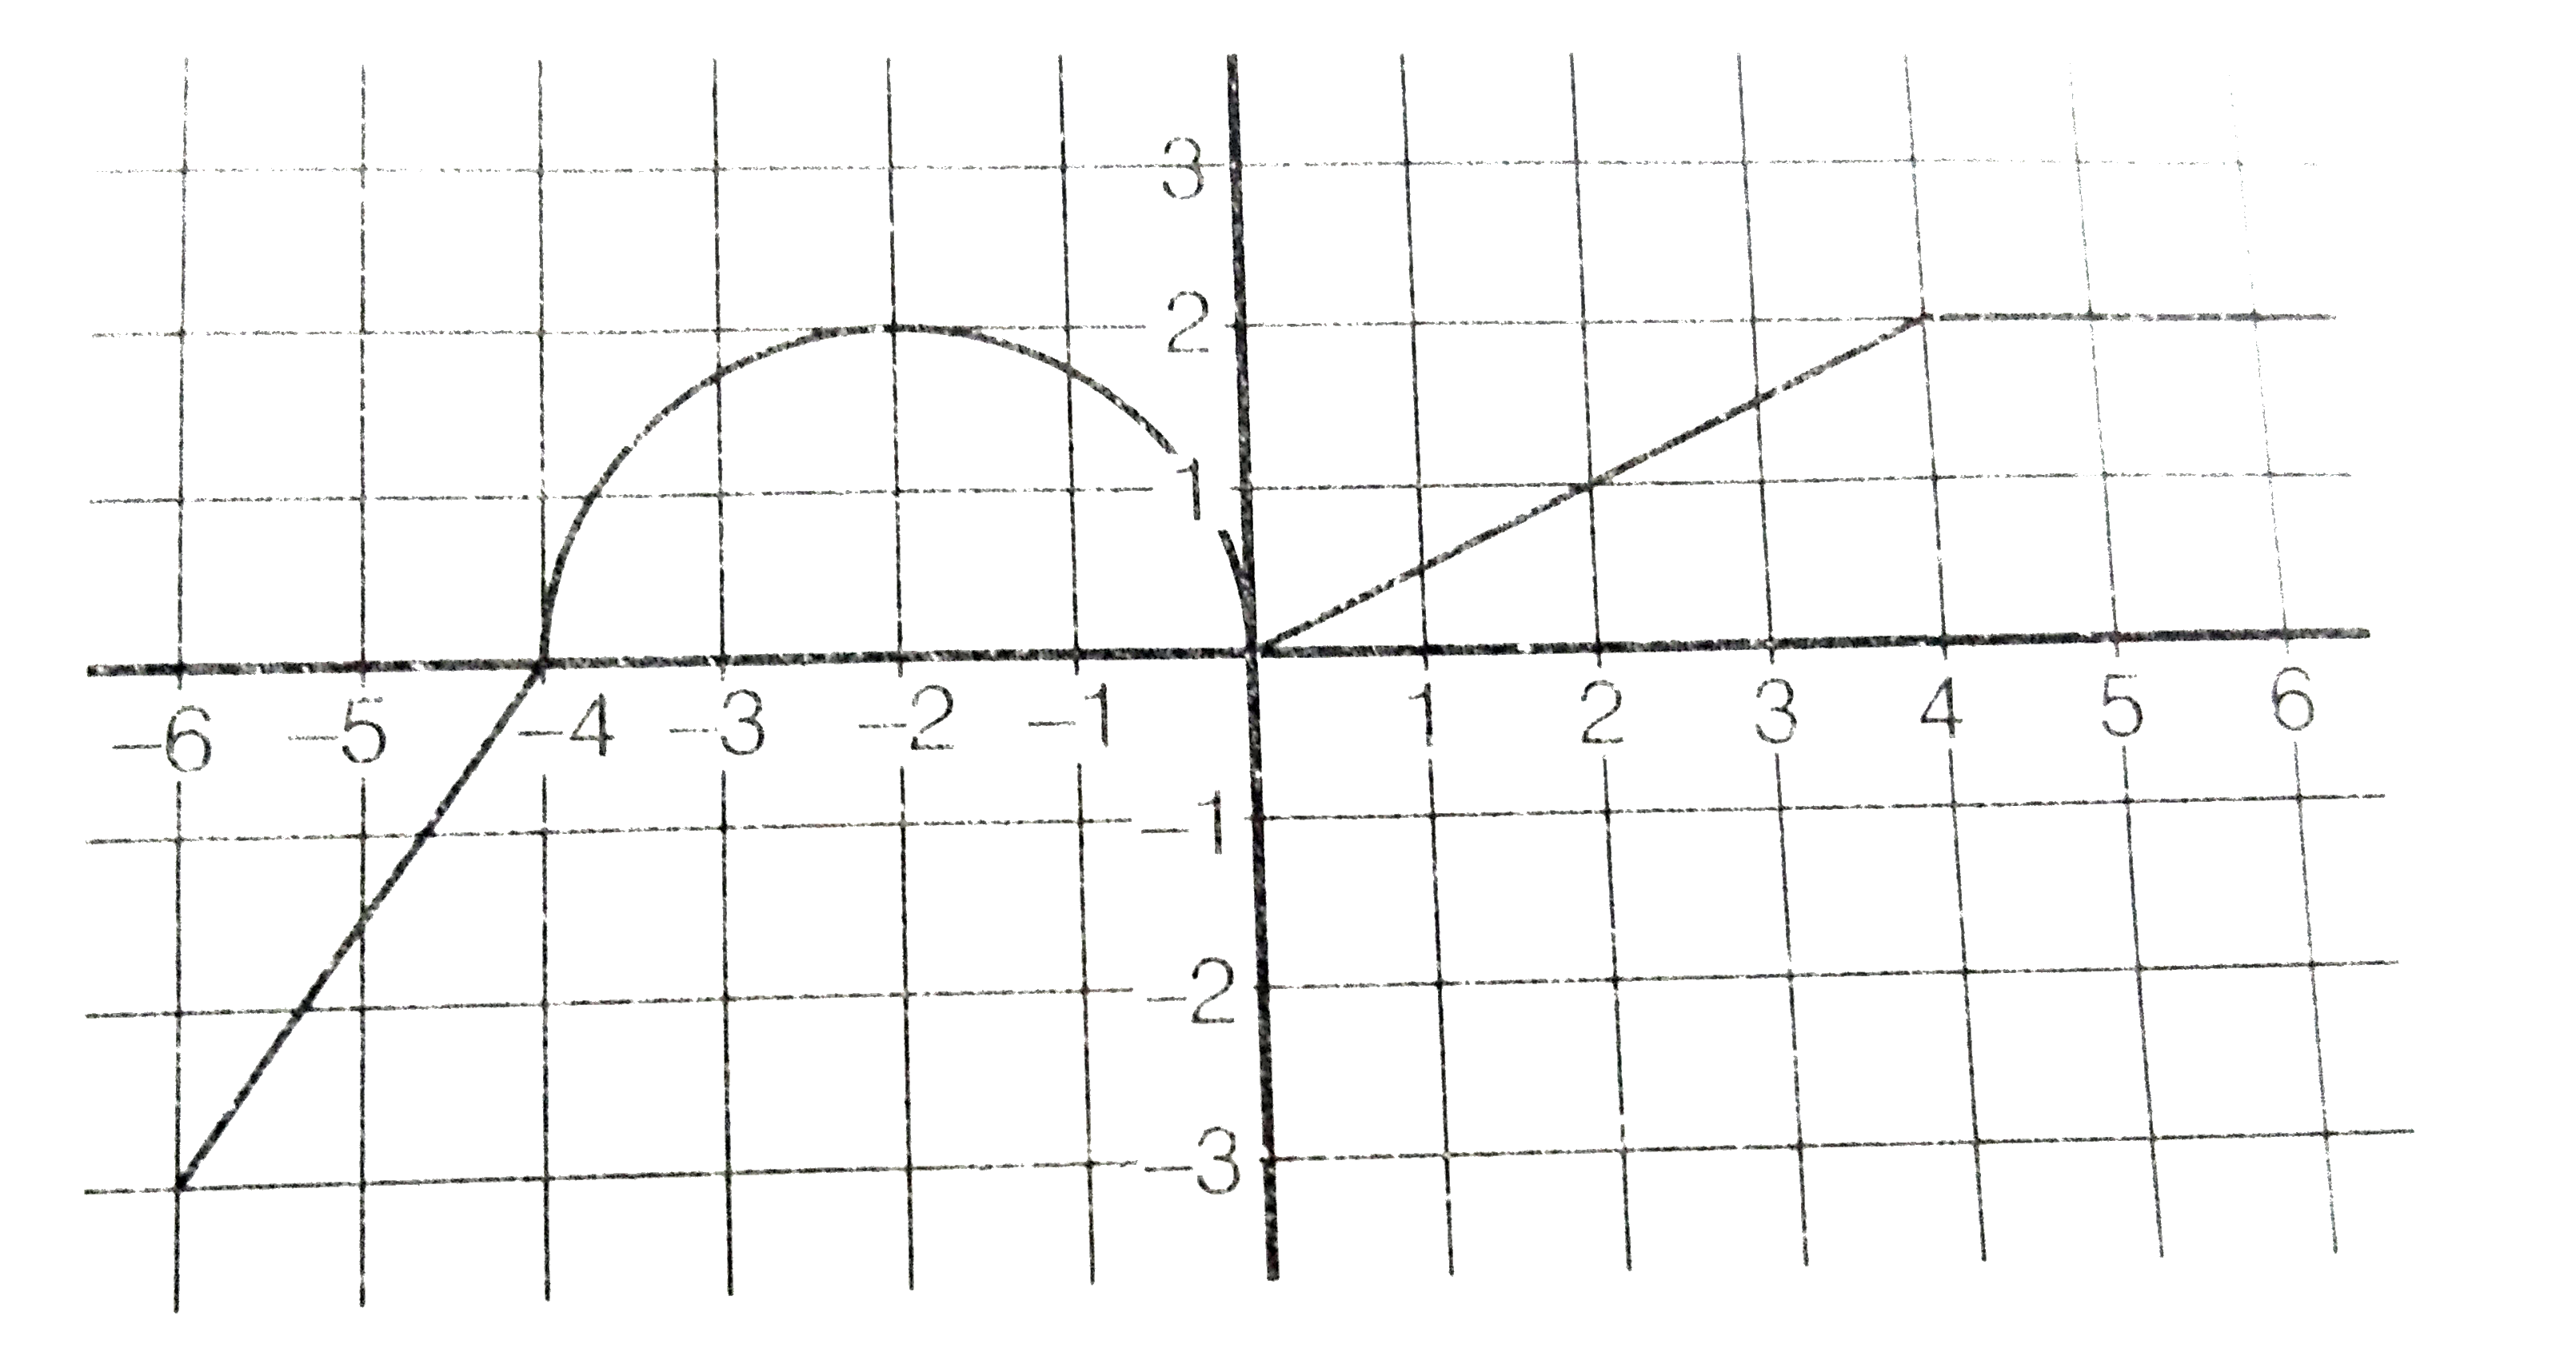
Then, (a) Graph of −f(x)+2 is
 View Solution
In some cases, Ellingham diagrams (graphs) show a bend. What do you refer from it ?
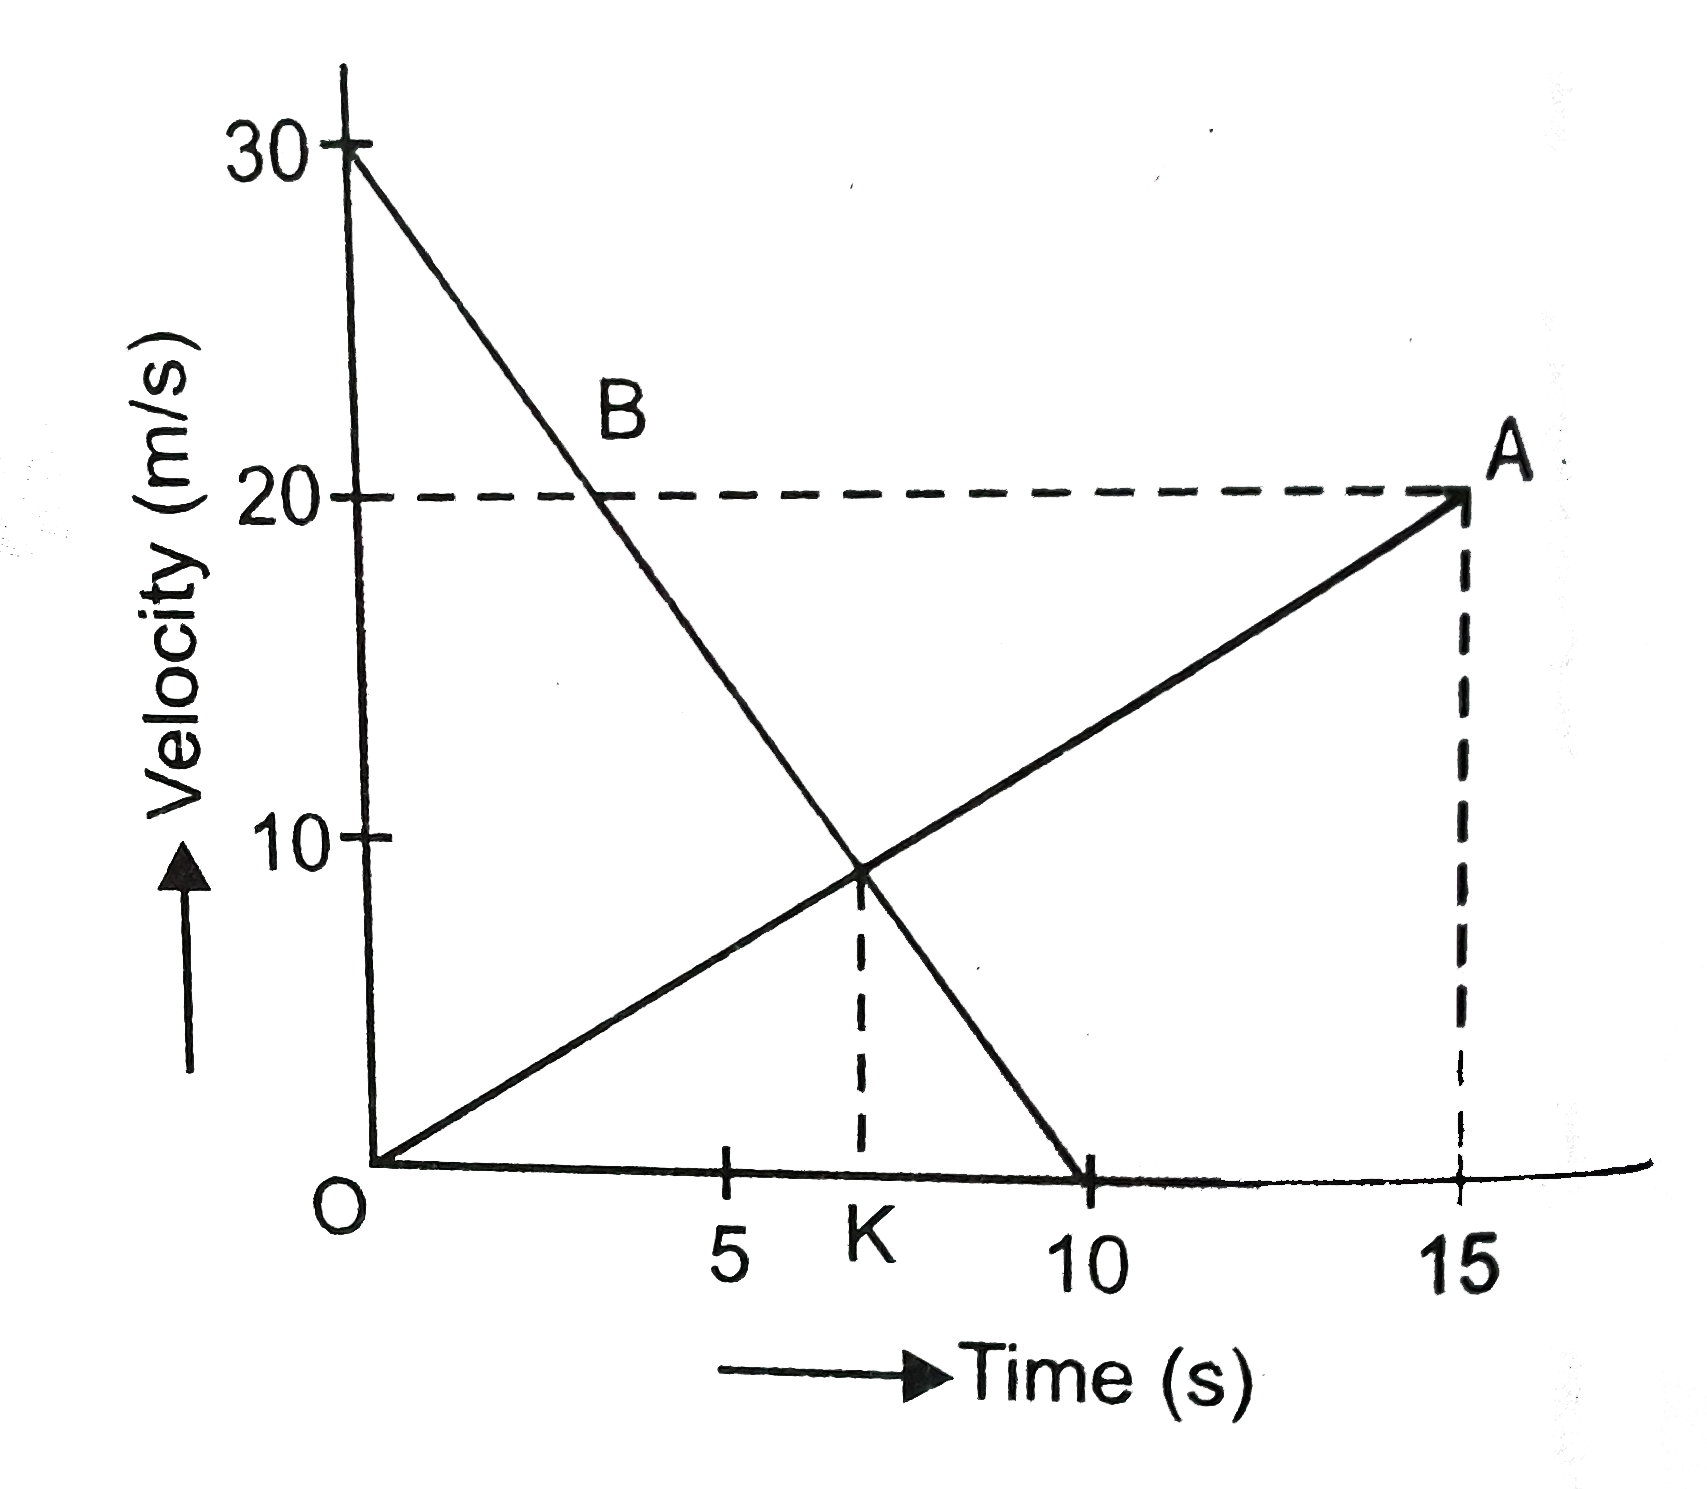
View SolutionThe velocity time graphs of two bodies A and B are shown in Figure. Observe these graphs carefully and answer the following questions :
(i) From the shape of graphs, what is nature of motion of A and B
(ii) What do you infer from the slopes of the graphs ?
(iii) What are the initial velocities of A and B ?
(iv) What is acceleration of A ?
(v) What is acceleration of B ?
(vi) What distance is travelled by B before coming to rest ?
(vii) At what time will the two bodies have equal velocity ?
 View Solution
Use the table given below to draw the graph.Use the graph drawn to find the value of a and b.
View SolutionThe graph of y=f(x) is given below
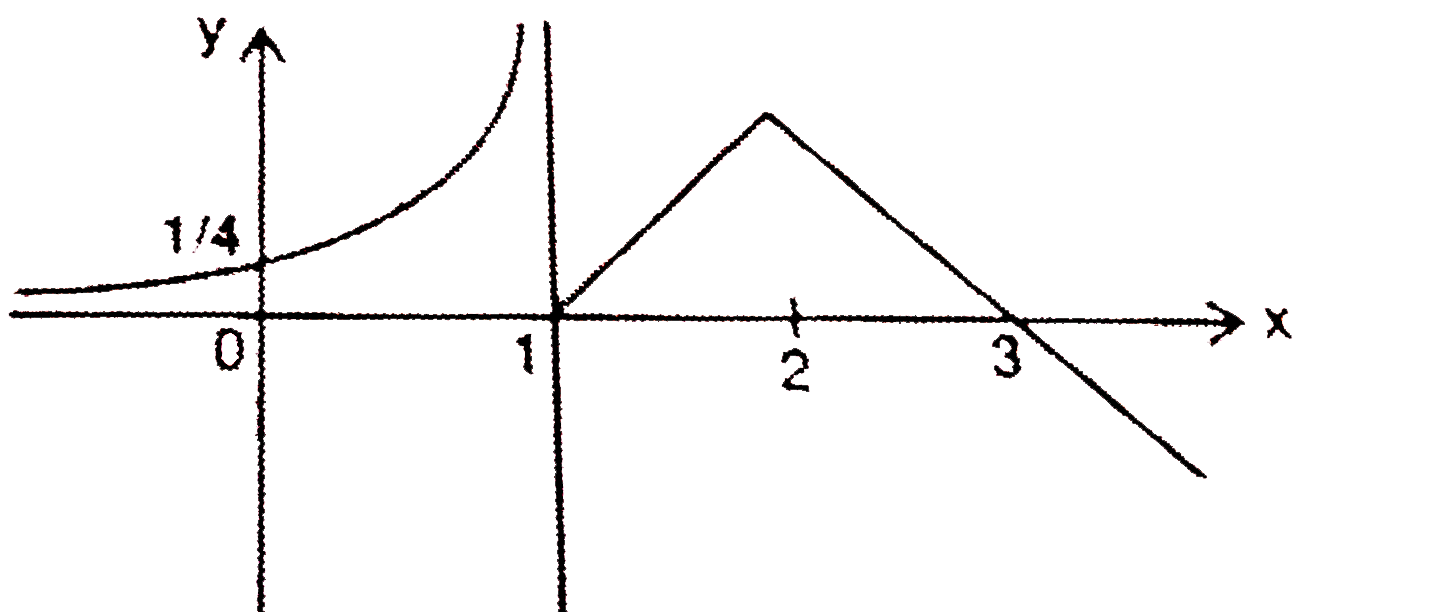
then the graph y=|f(|x|)| is :View Solution


