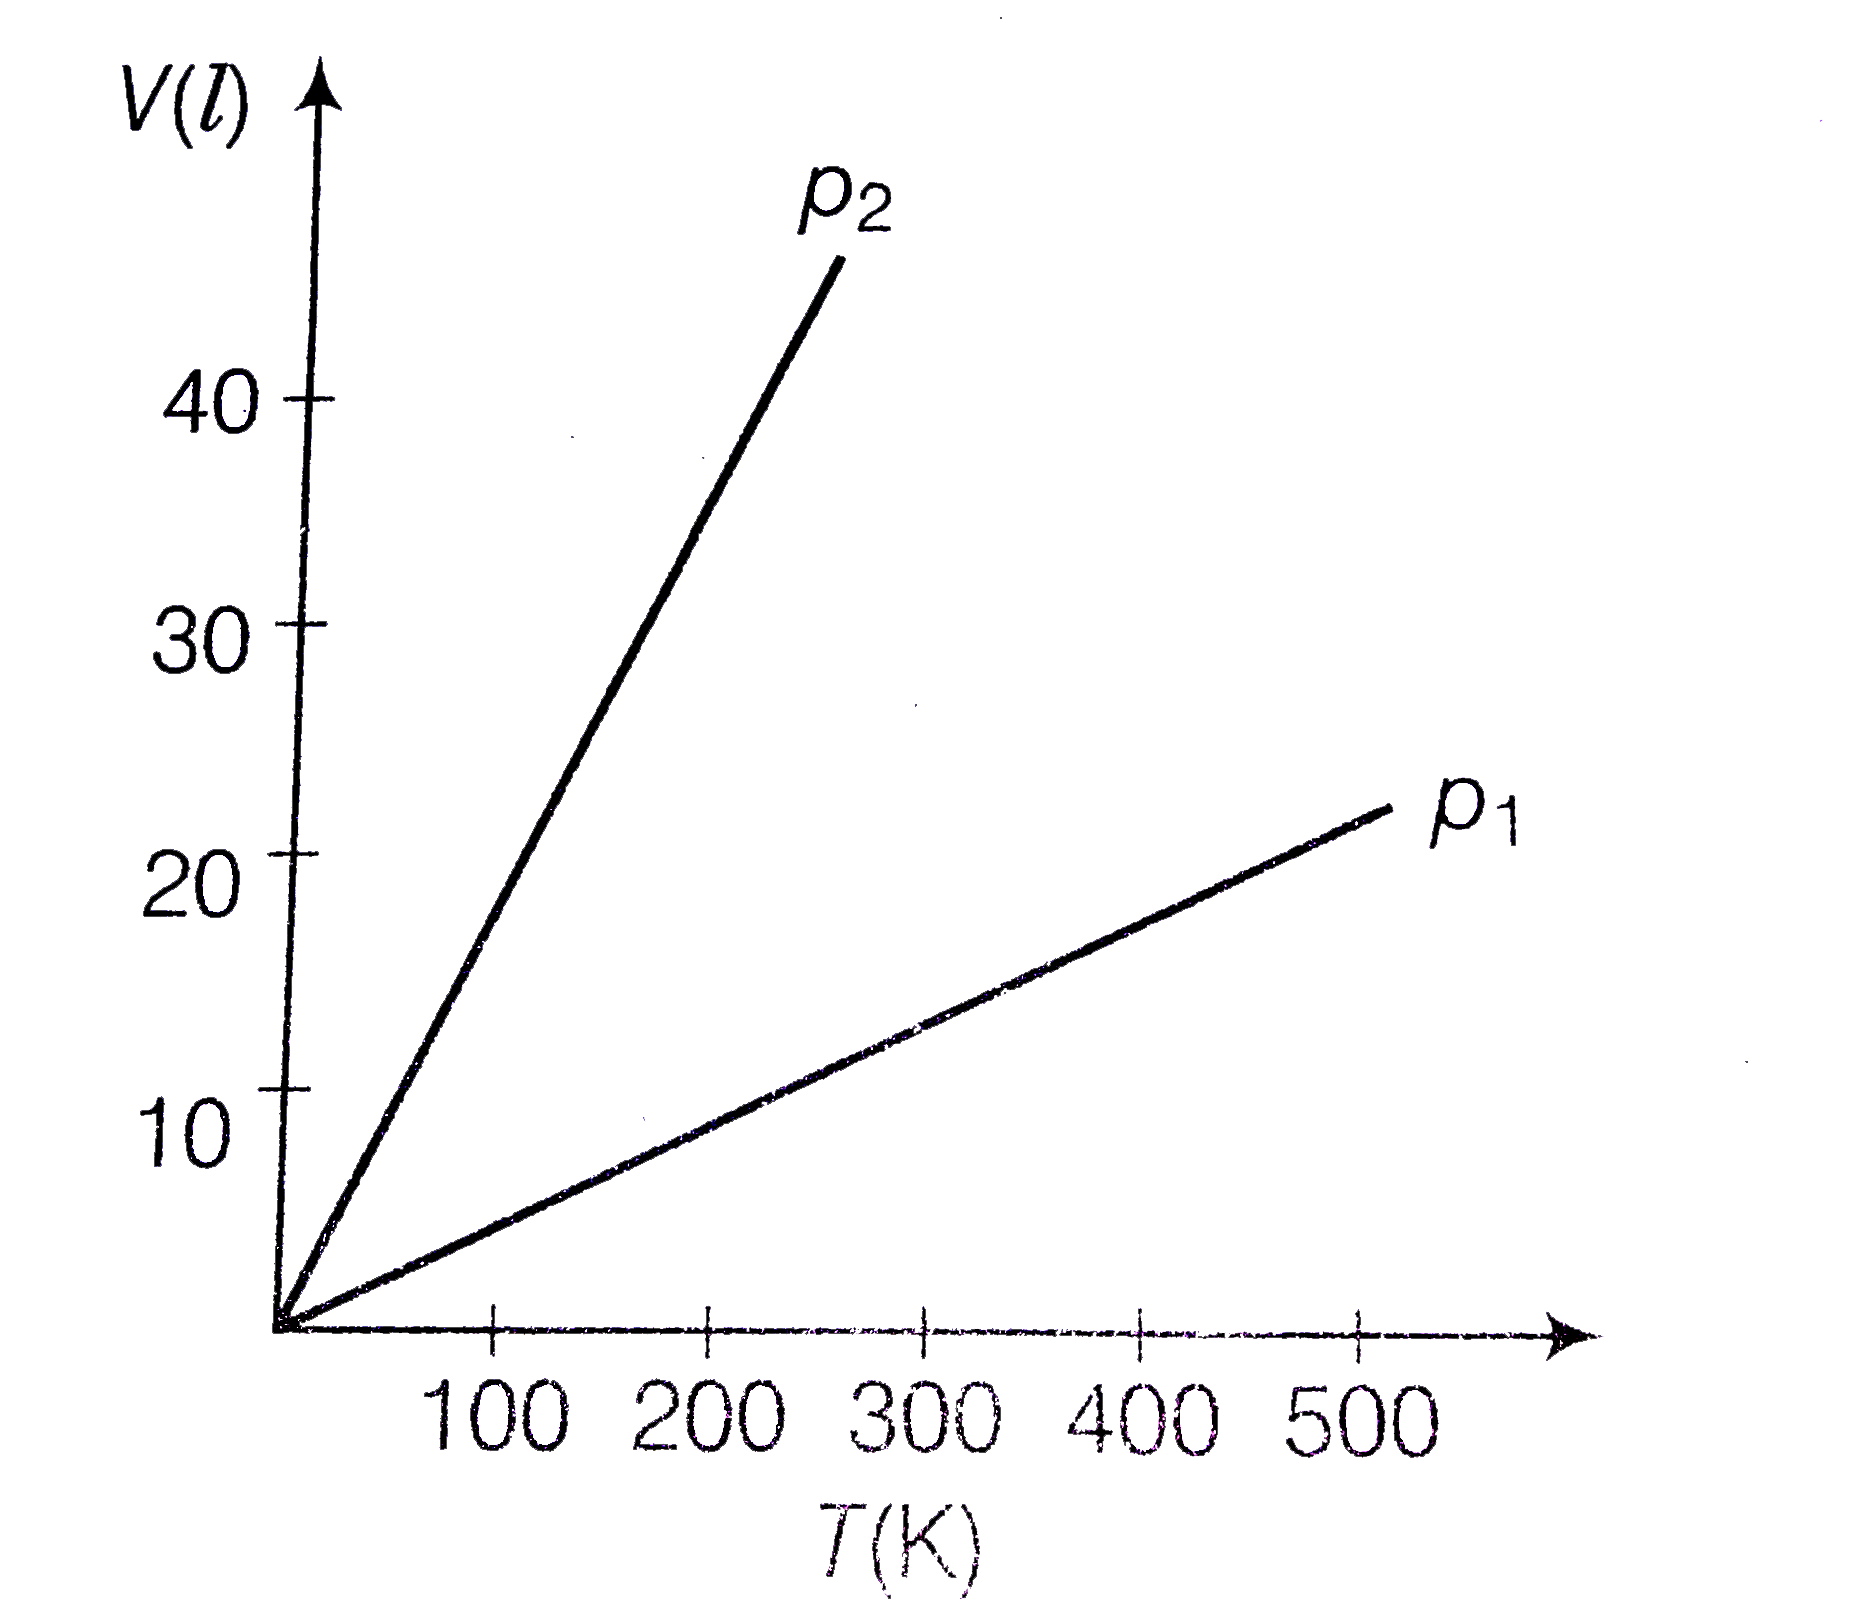
The figure shows the volume V versus temperature T graphs for a certain mass of a perfect gas at two constant pressure of P1 and P2. What inference can you draw from the graphs. can be drawn due to insufficient information.A P1 P2C P1 = P2 D No inference
The correct option B P1 > P2Explanation:From graph θ2 > θ1tan θ2 > tan θ1slope of graph P2 > slope of graph P1∴ V/T2 > V/T1as PV = nRTV/T ∝ 1/P∴ 1/P2 > 1/P1i.e. P1 > P2
Related Solutions
The pressure and density of a gas (Ƴ =5/3) changes adiabatically from (p1,d1 ) to (p2,d2).If d2/d1=27 the find value of p2/p1 ?
View Solution
P1 and P2 are respectively
View SolutionP1 and P2 are respectively :
View SolutionProperties of ITF#!#P1 & P2
View SolutionFrom power prove that for lens. P=P1+P2+P3+.........Pn
View SolutionConsider the following events: : Six fair dices are rolled and at least one die shows six. : Twelve fair dice are rolled and at least two dice show six. Let be the probability of and be the probaility of . Which of the following is true? (A) p1 > p2 (B) p1 = p2 = 0.6651 (C) p1 < p2 (D) p1 = p2 = 0.3349
View SolutionThe following figure shows two plants of the same species. Identify the pollination types represented by P1, P2 and P3
View Solution= 113400 இங்கு p1, p2, p3, p4 என்பன ஏறு வரிசையில் அமைந்த பகா எண்கள் மற்றும் x1, x2, x3, x4 என்பன முழுக்கள் எனில் p1, p2, p3, p4 மற்றும் x1, x2, x3, x4 ஆகியவற்றின் மதிப்புகளைக் காண்க.
View SolutionThe below figure shows 2 plants of the same species identify the types of pollination indicated as P1 P2 and P3
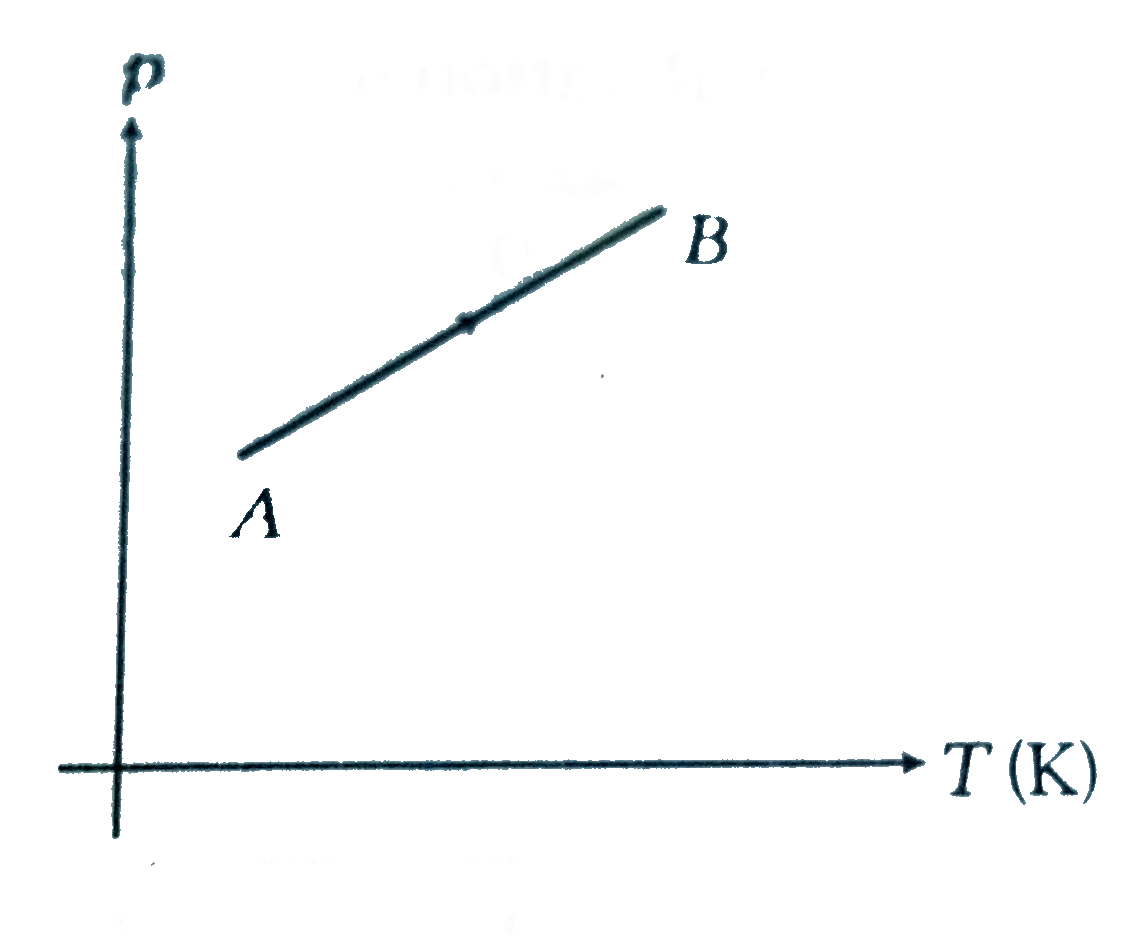
View SolutionThe p-T graph for the given mass of an ideal gas is shown in figure. What inference can be drawn regarding the change in Volume (whtherit is constant, increasing or decreasing) ?
View SolutionThe graph for the given mass of an ideal gas is shown in figure. What inference can be drawn regarding the change in Volume (whtherit is constant, increasing or decreasing) ?

View SolutionA cylindrical tube with its base as shown is filled with water. It is moving down with a constant acceleration a along a fixed inclined plane with angle theta = 45^0 P1 and P2 are pressure points 1 and 2 resp located at base of tube. Let beta = (P1 - P2)/(rho g d) . Which statement is true?
View SolutionVolume versus temperature graphs for a given mass of an ideal gas are shown in figure. At two different values of constant pressure. What can be inferred about relation between and ?

View SolutionVolume versus temperature graphs for a given mass of an ideal gas are shown in figure. At two different values of constant pressure. What can be inferred about relation between P_(1) and P_(2) ?
View SolutionVolume versus temperature graphs for a given mass of an ideal gas are shown in figure. At two different values of constant pressure. What can be inferred about relation between P_(1) and P_(2) ?
View SolutionVolume versus temperature graphs for a given mass of an ideal gas are shown in figure. At two different values of constant pressure. What can be inferred about relation between and ?

View SolutionShow that the relation R defined in the set A of all polygons as have same number of sides}, is an equivalence relation. What is the set of all elements in A related to the right angle triangle T with sides 3, 4 and 5?
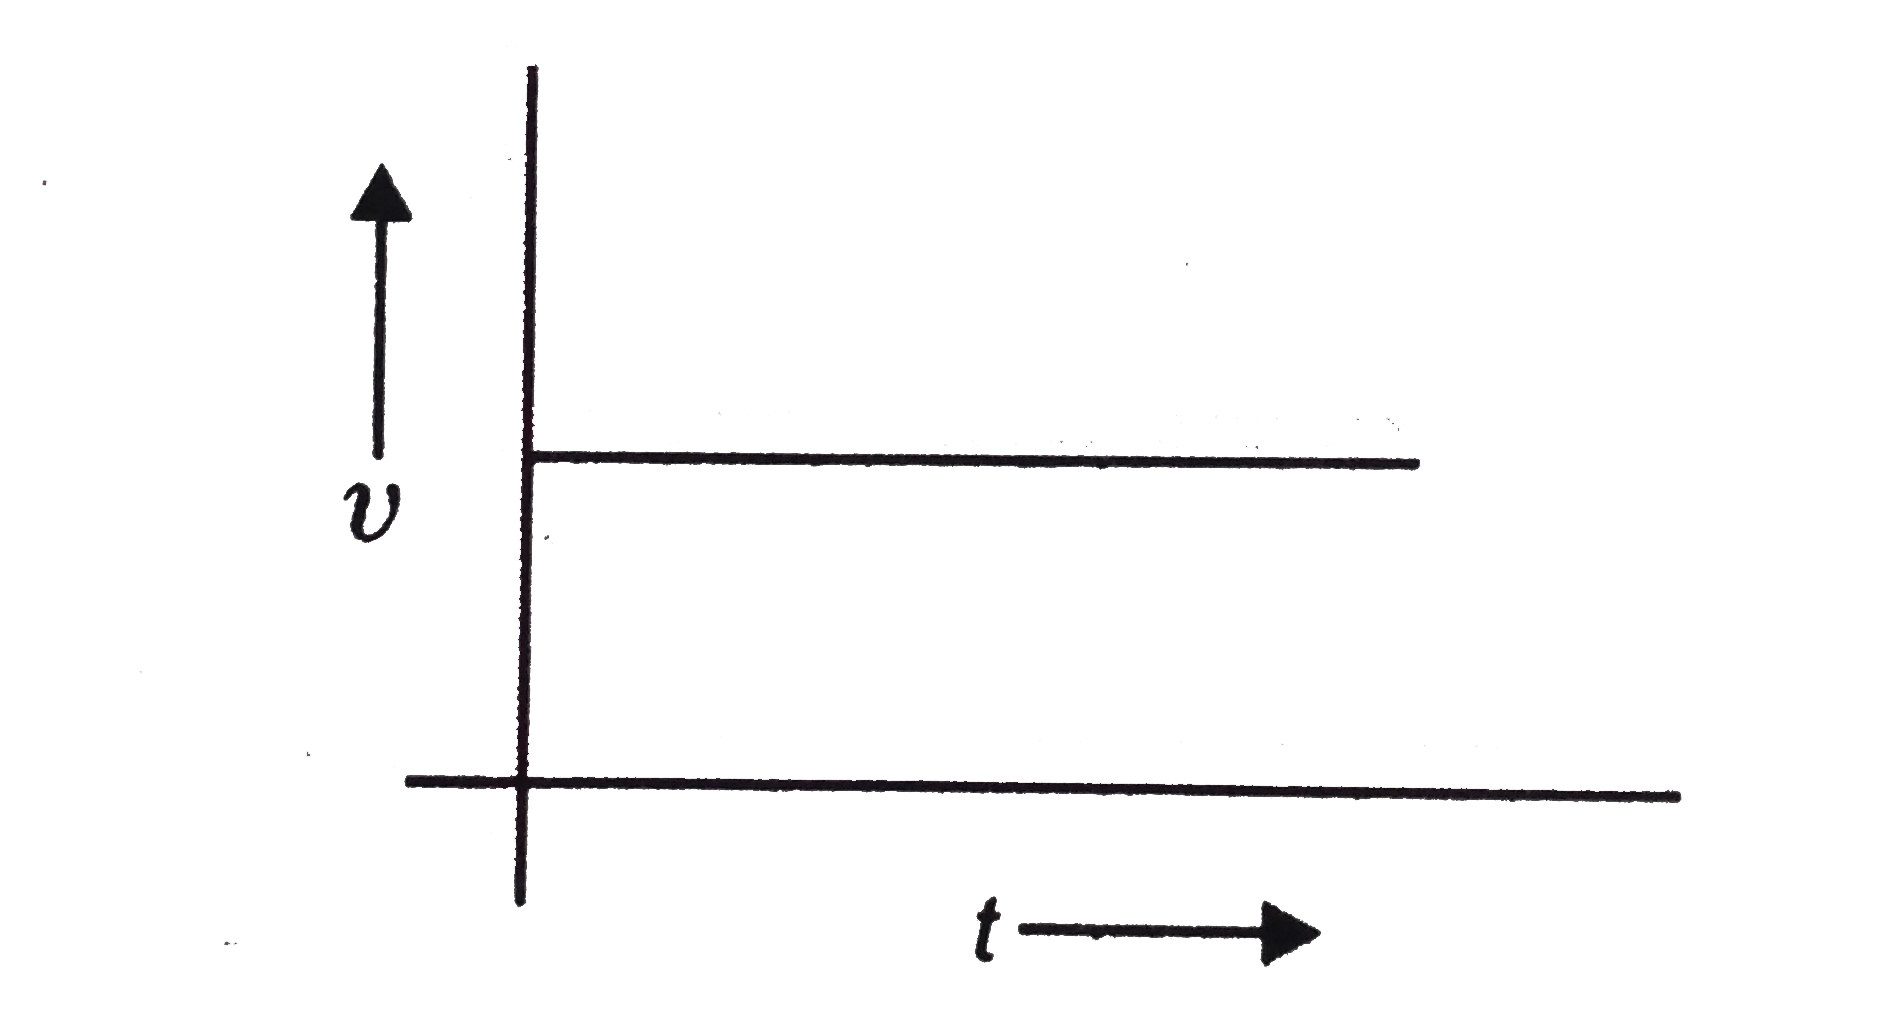
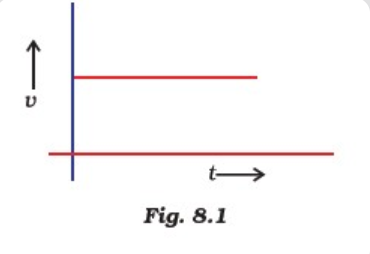
View SolutionFrom the given graph (Figure), it can be inferred that the object is

View SolutionFrom the given v-t graph (see figure), it can be inferred that the object is

View SolutionFrom the given v-t graph (see figure), it can be inferred that the object is

View Solution