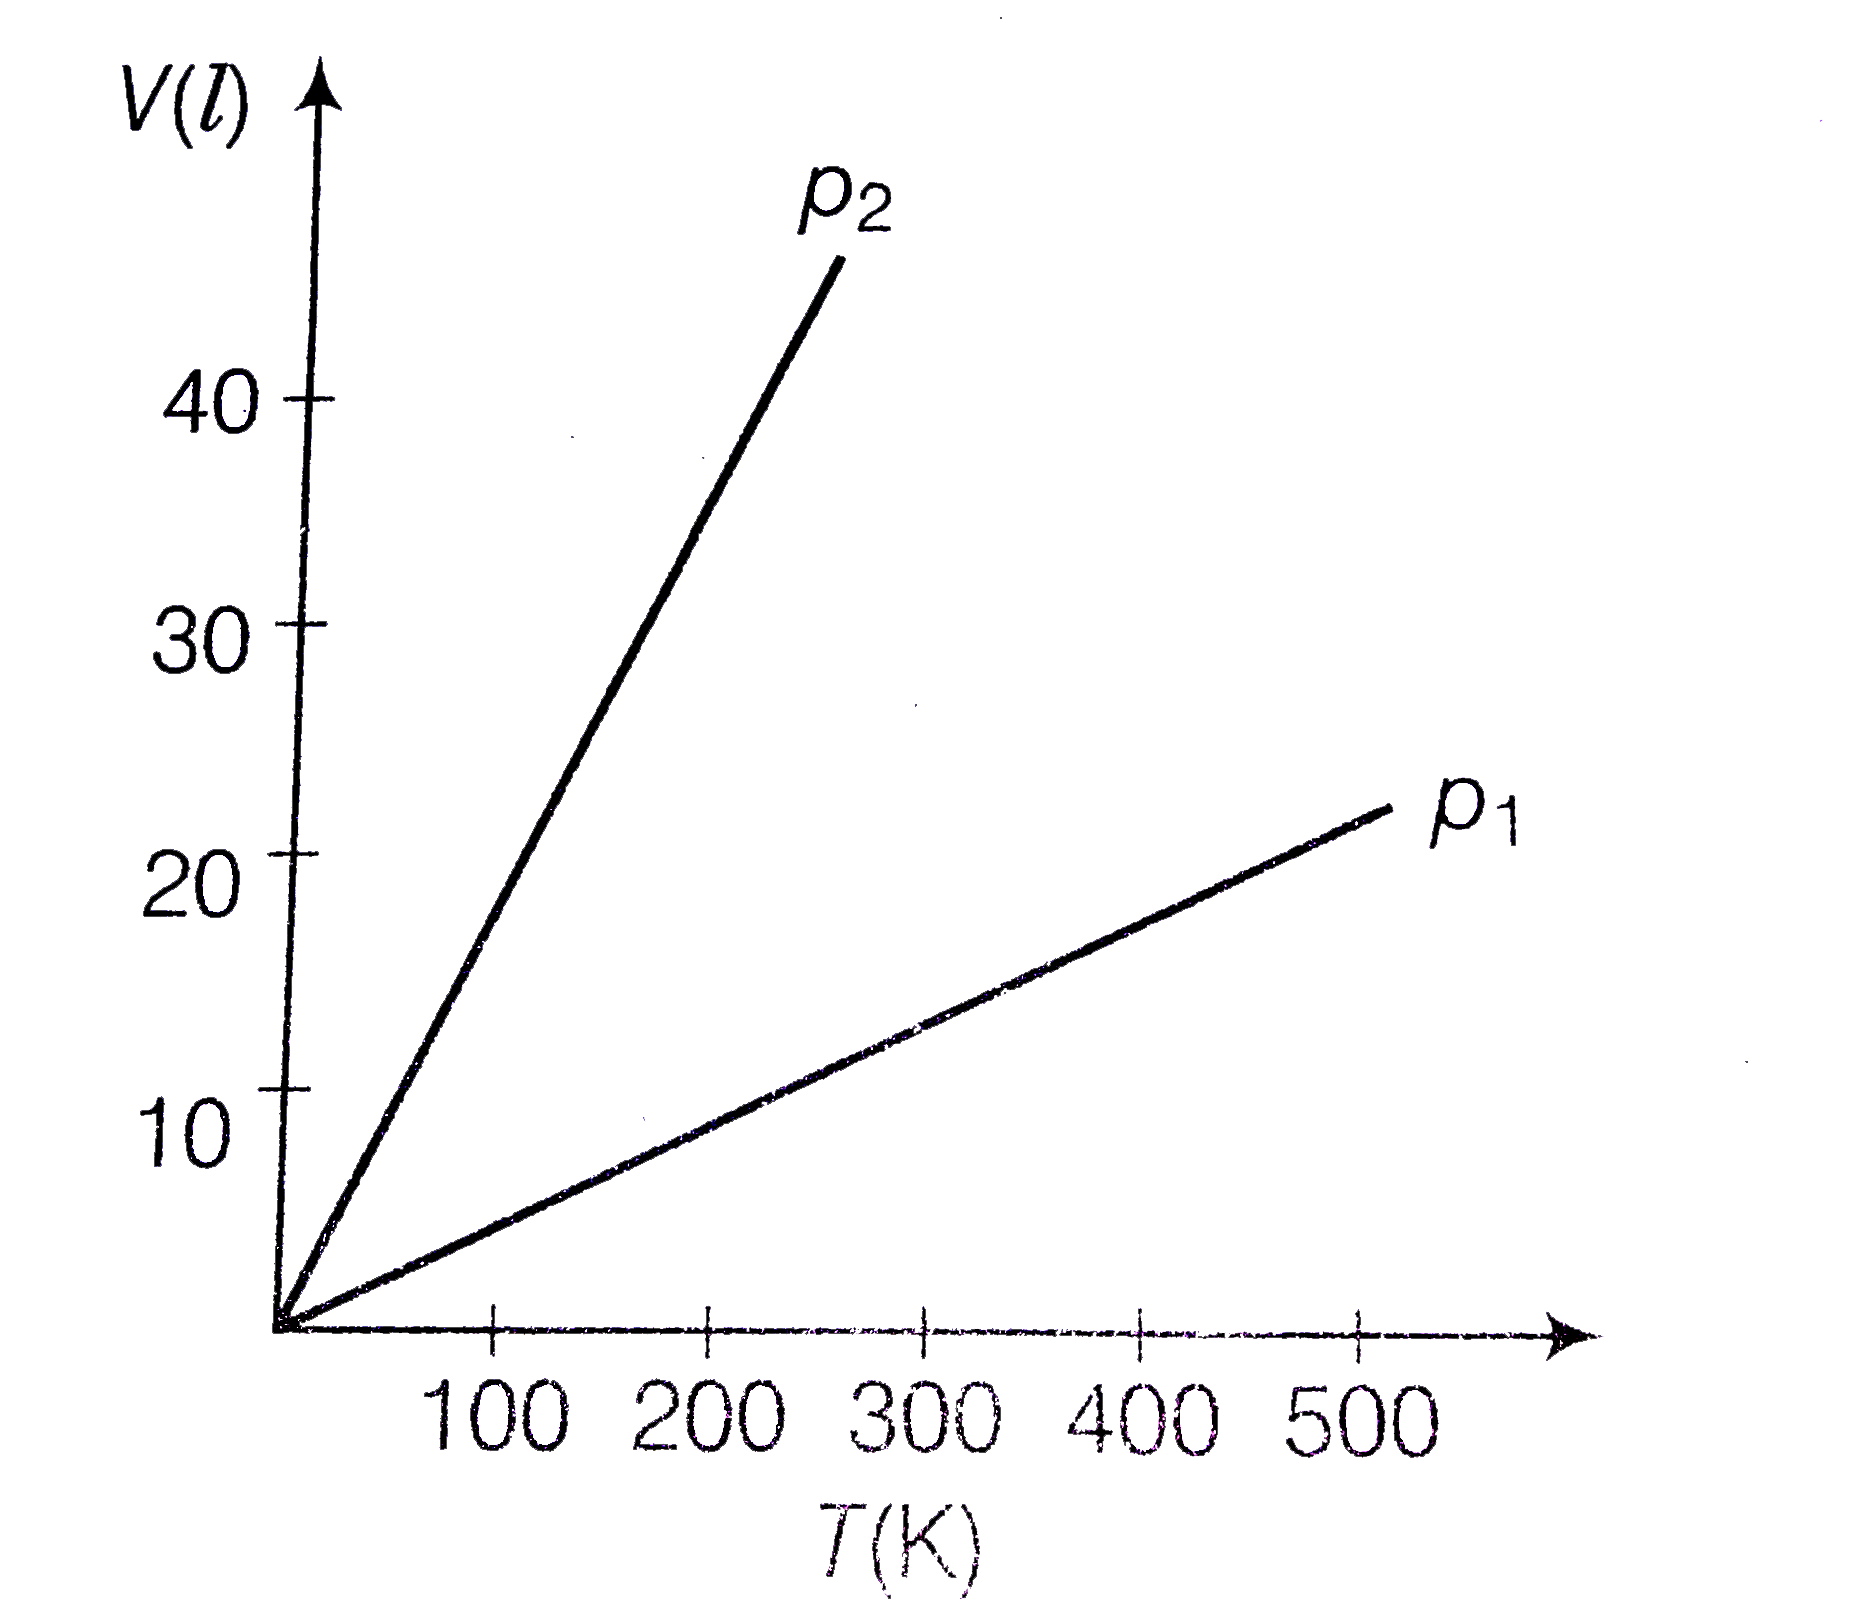
Volume versus temperature graphs for a given mass of an ideal gas are shown in figure. At two different values of constant pressure. What can be inferred about relation between P1 and P2 ?
P1>P2
P1=P2
P1<P2
data is insufficient
The correct Answer is:A
According to Charle's law
V∝TorVT=constant=1P
As in graph, slope at P2 is more than slope at P1.
thereforeP_(1)gtP_(2)
Topper's Solved these Questions
- KINETIC THEORYBOOK - NCERT FINGERTPS ENGLISHCHAPTER - KINETIC THEORYEXERCISE - ASSERTION & REASON
10 Videos
- KINETIC THEORYBOOK - NCERT FINGERTPS ENGLISHCHAPTER - KINETIC THEORYEXERCISE - Specific Heat Capacity
13 Videos
- KINETIC THEORYBOOK - NCERT FINGERTPS ENGLISHCHAPTER - KINETIC THEORYEXERCISE - HOTS
10 Videos
- GRAVITATIONBOOK - NCERT FINGERTPS ENGLISHCHAPTER - GRAVITATIONEXERCISE - Assertion And Reason
15 Videos
- LAWS OF MOTIONBOOK - NCERT FINGERTPS ENGLISHCHAPTER - LAWS OF MOTIONEXERCISE - Assertion And Reason
15 Videos
Similar Questions
Pressure versus temperature graphs of an ideal gas are as shown in figure. Choose the wrong statement
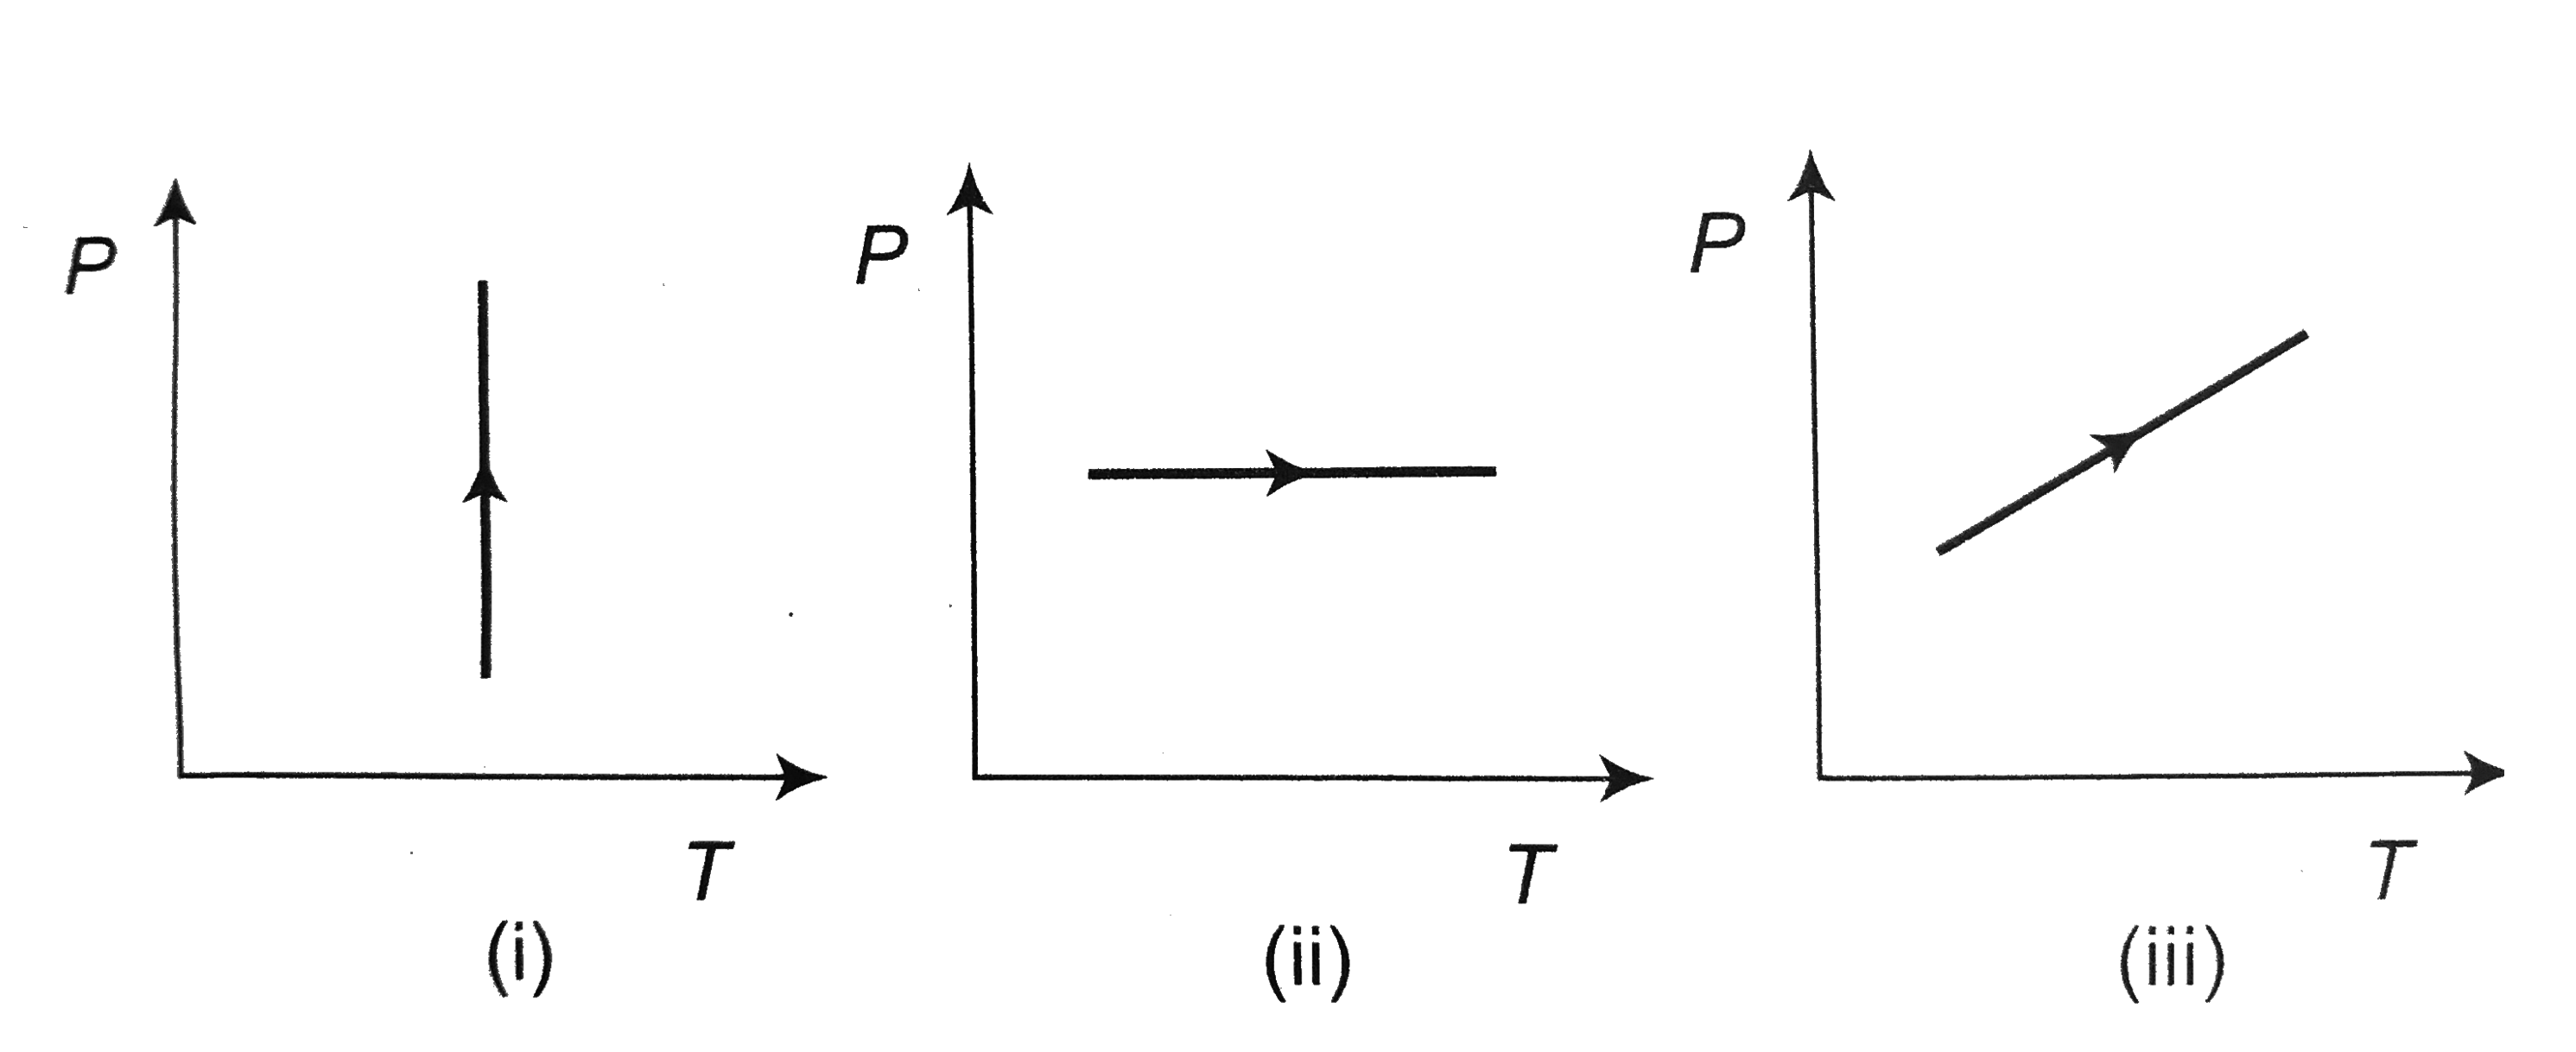
View SolutionPressure versus temperature graphs of an ideal gas are as shown in figure. Choose the wrong statement

View SolutionPressure versus density graph of an ideal gas is shown in figure
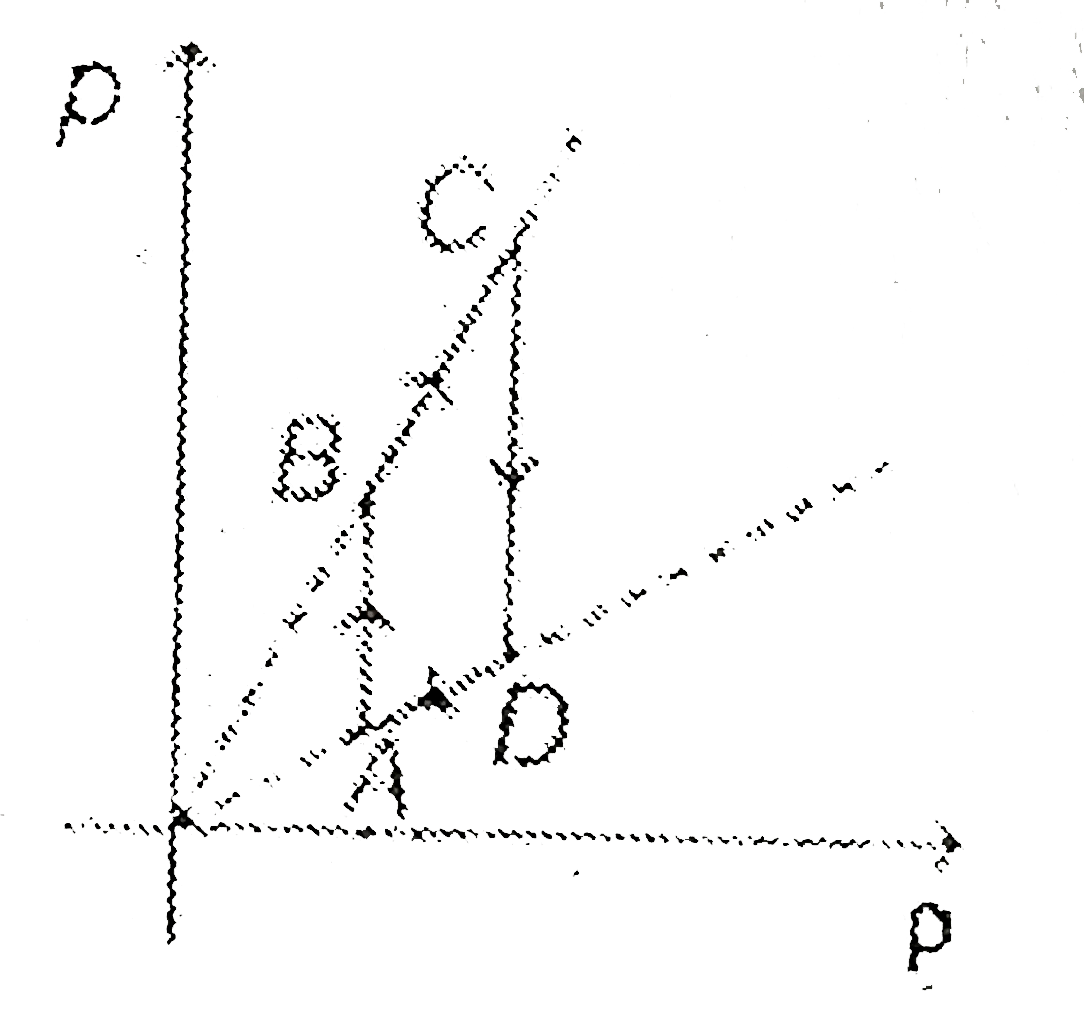
View SolutionThe volume-temperature graphs of a given mass of an ideal gas at constant pressure are shown below. What is the correct order of pressure ?
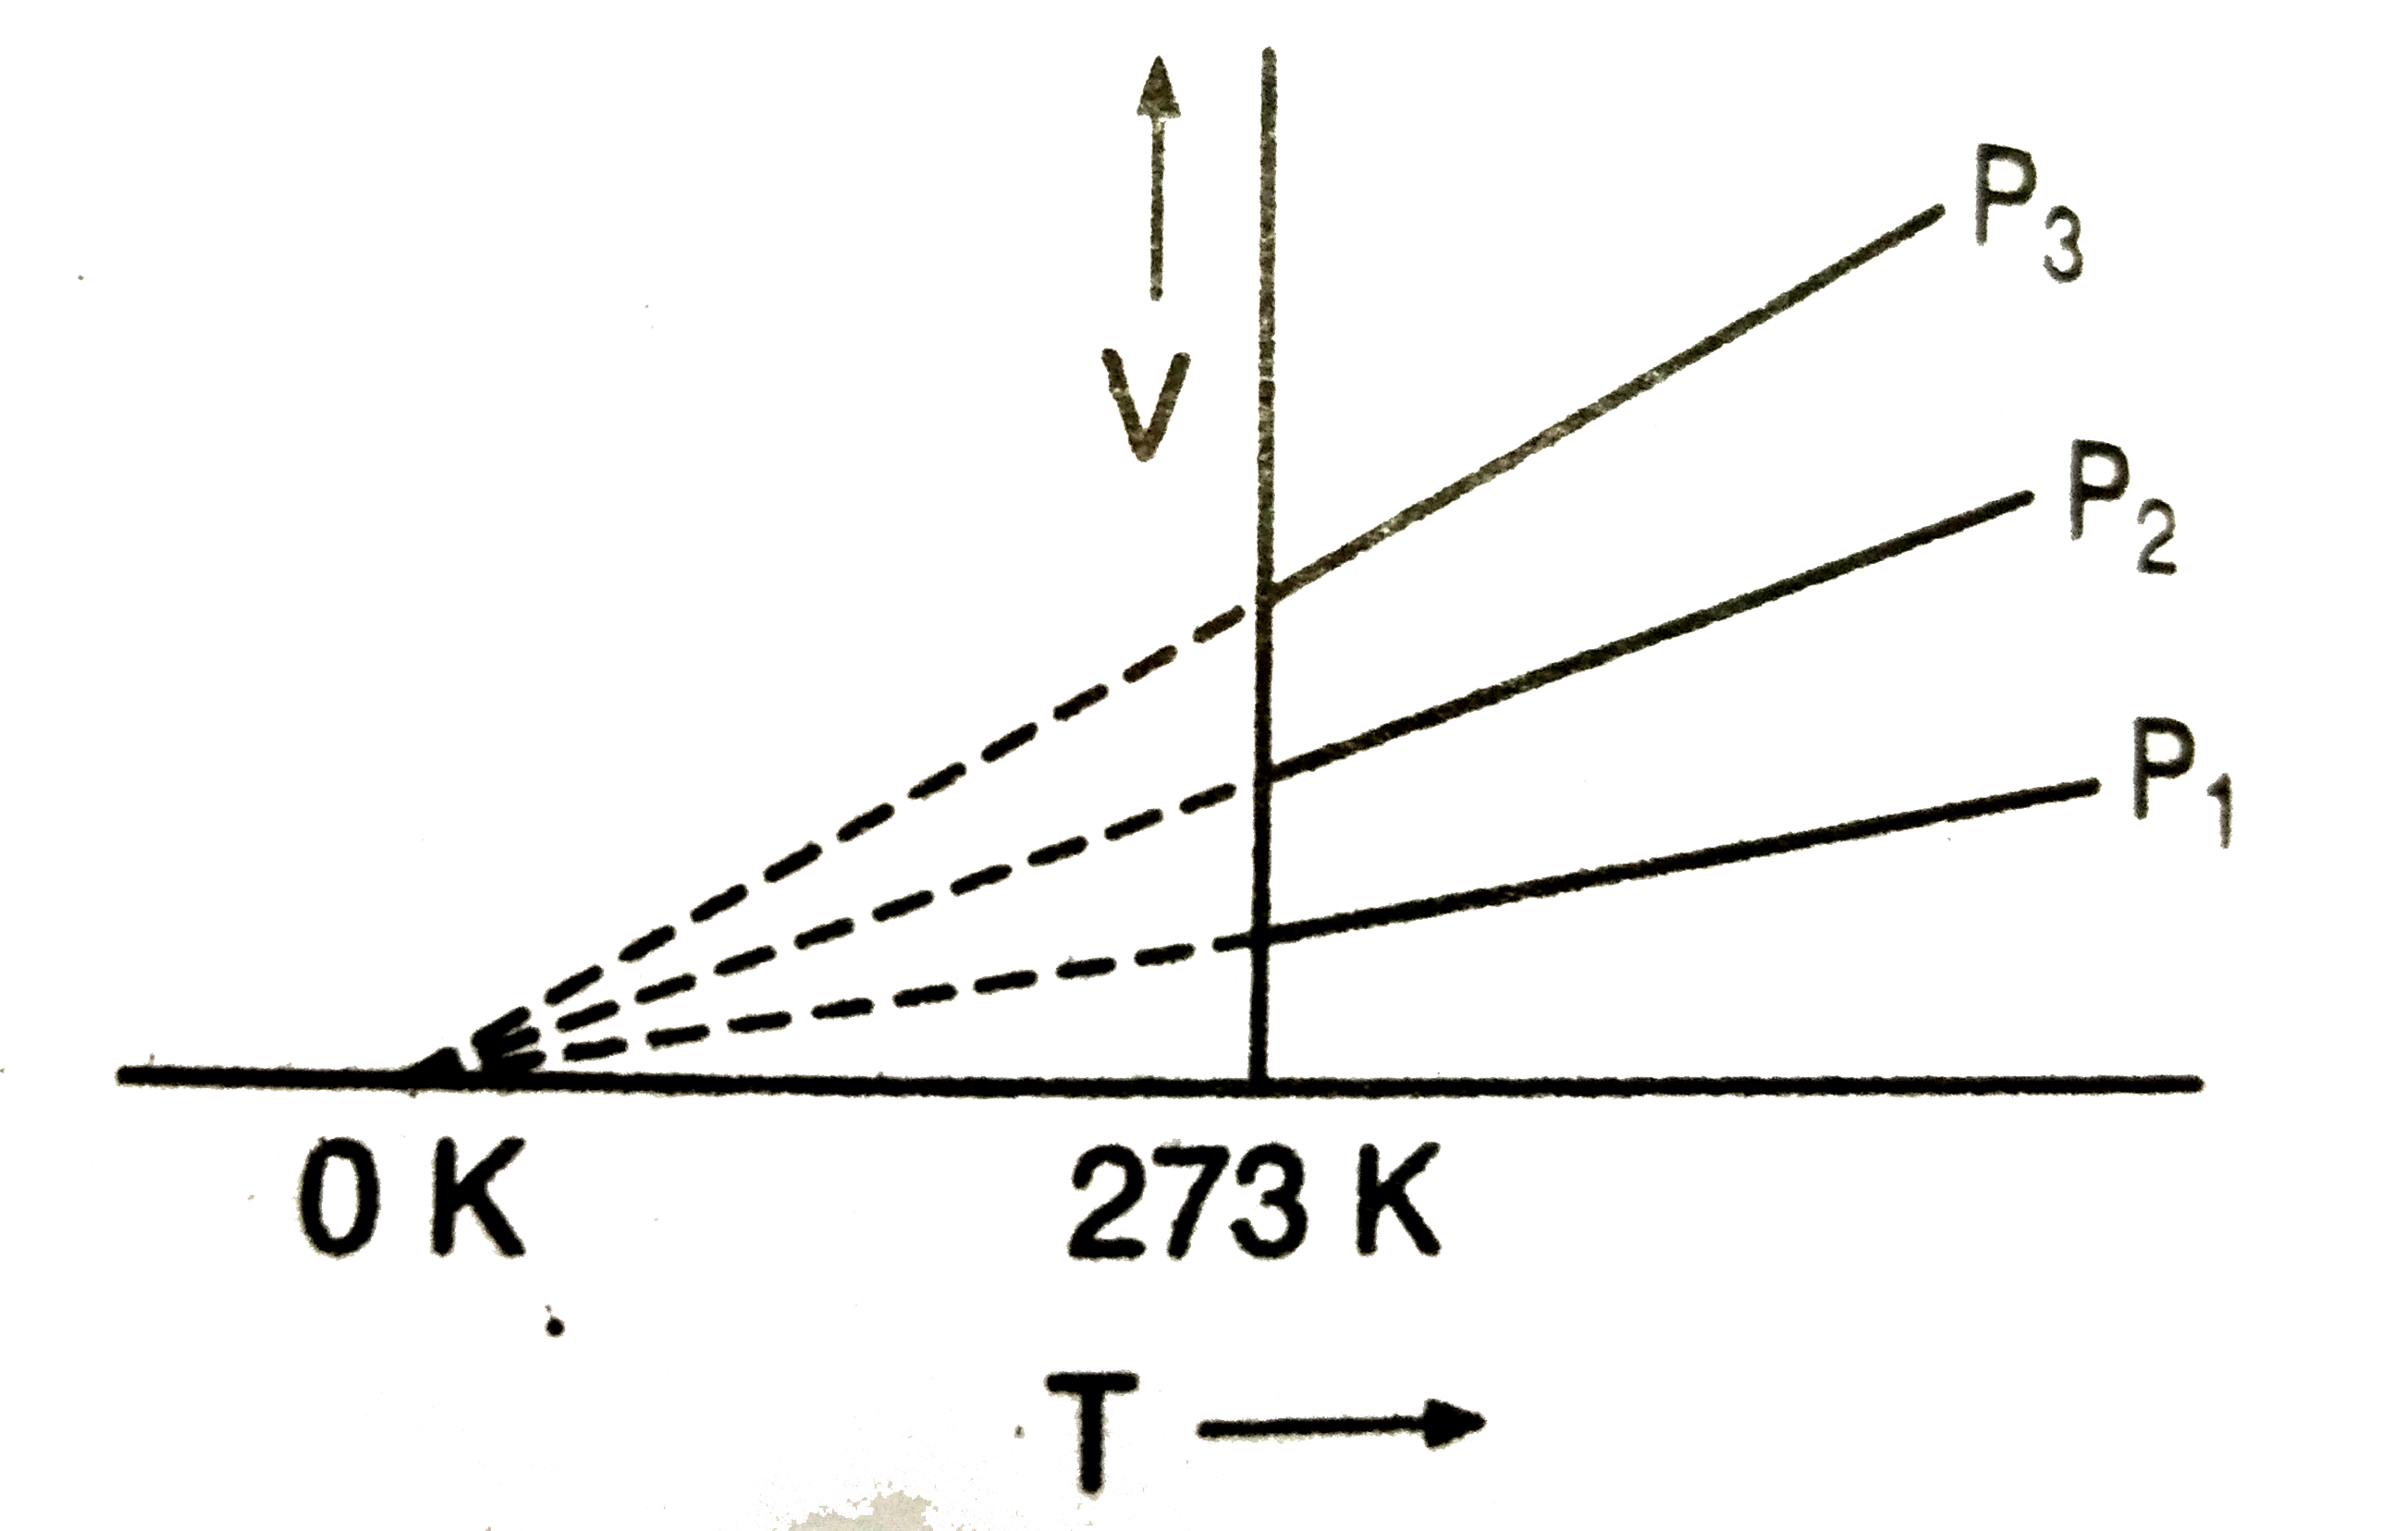
View SolutionFigure shows volume - temperature (V-T) graph for same mass of an ideal gas at two different pressures P1and P2. Hence
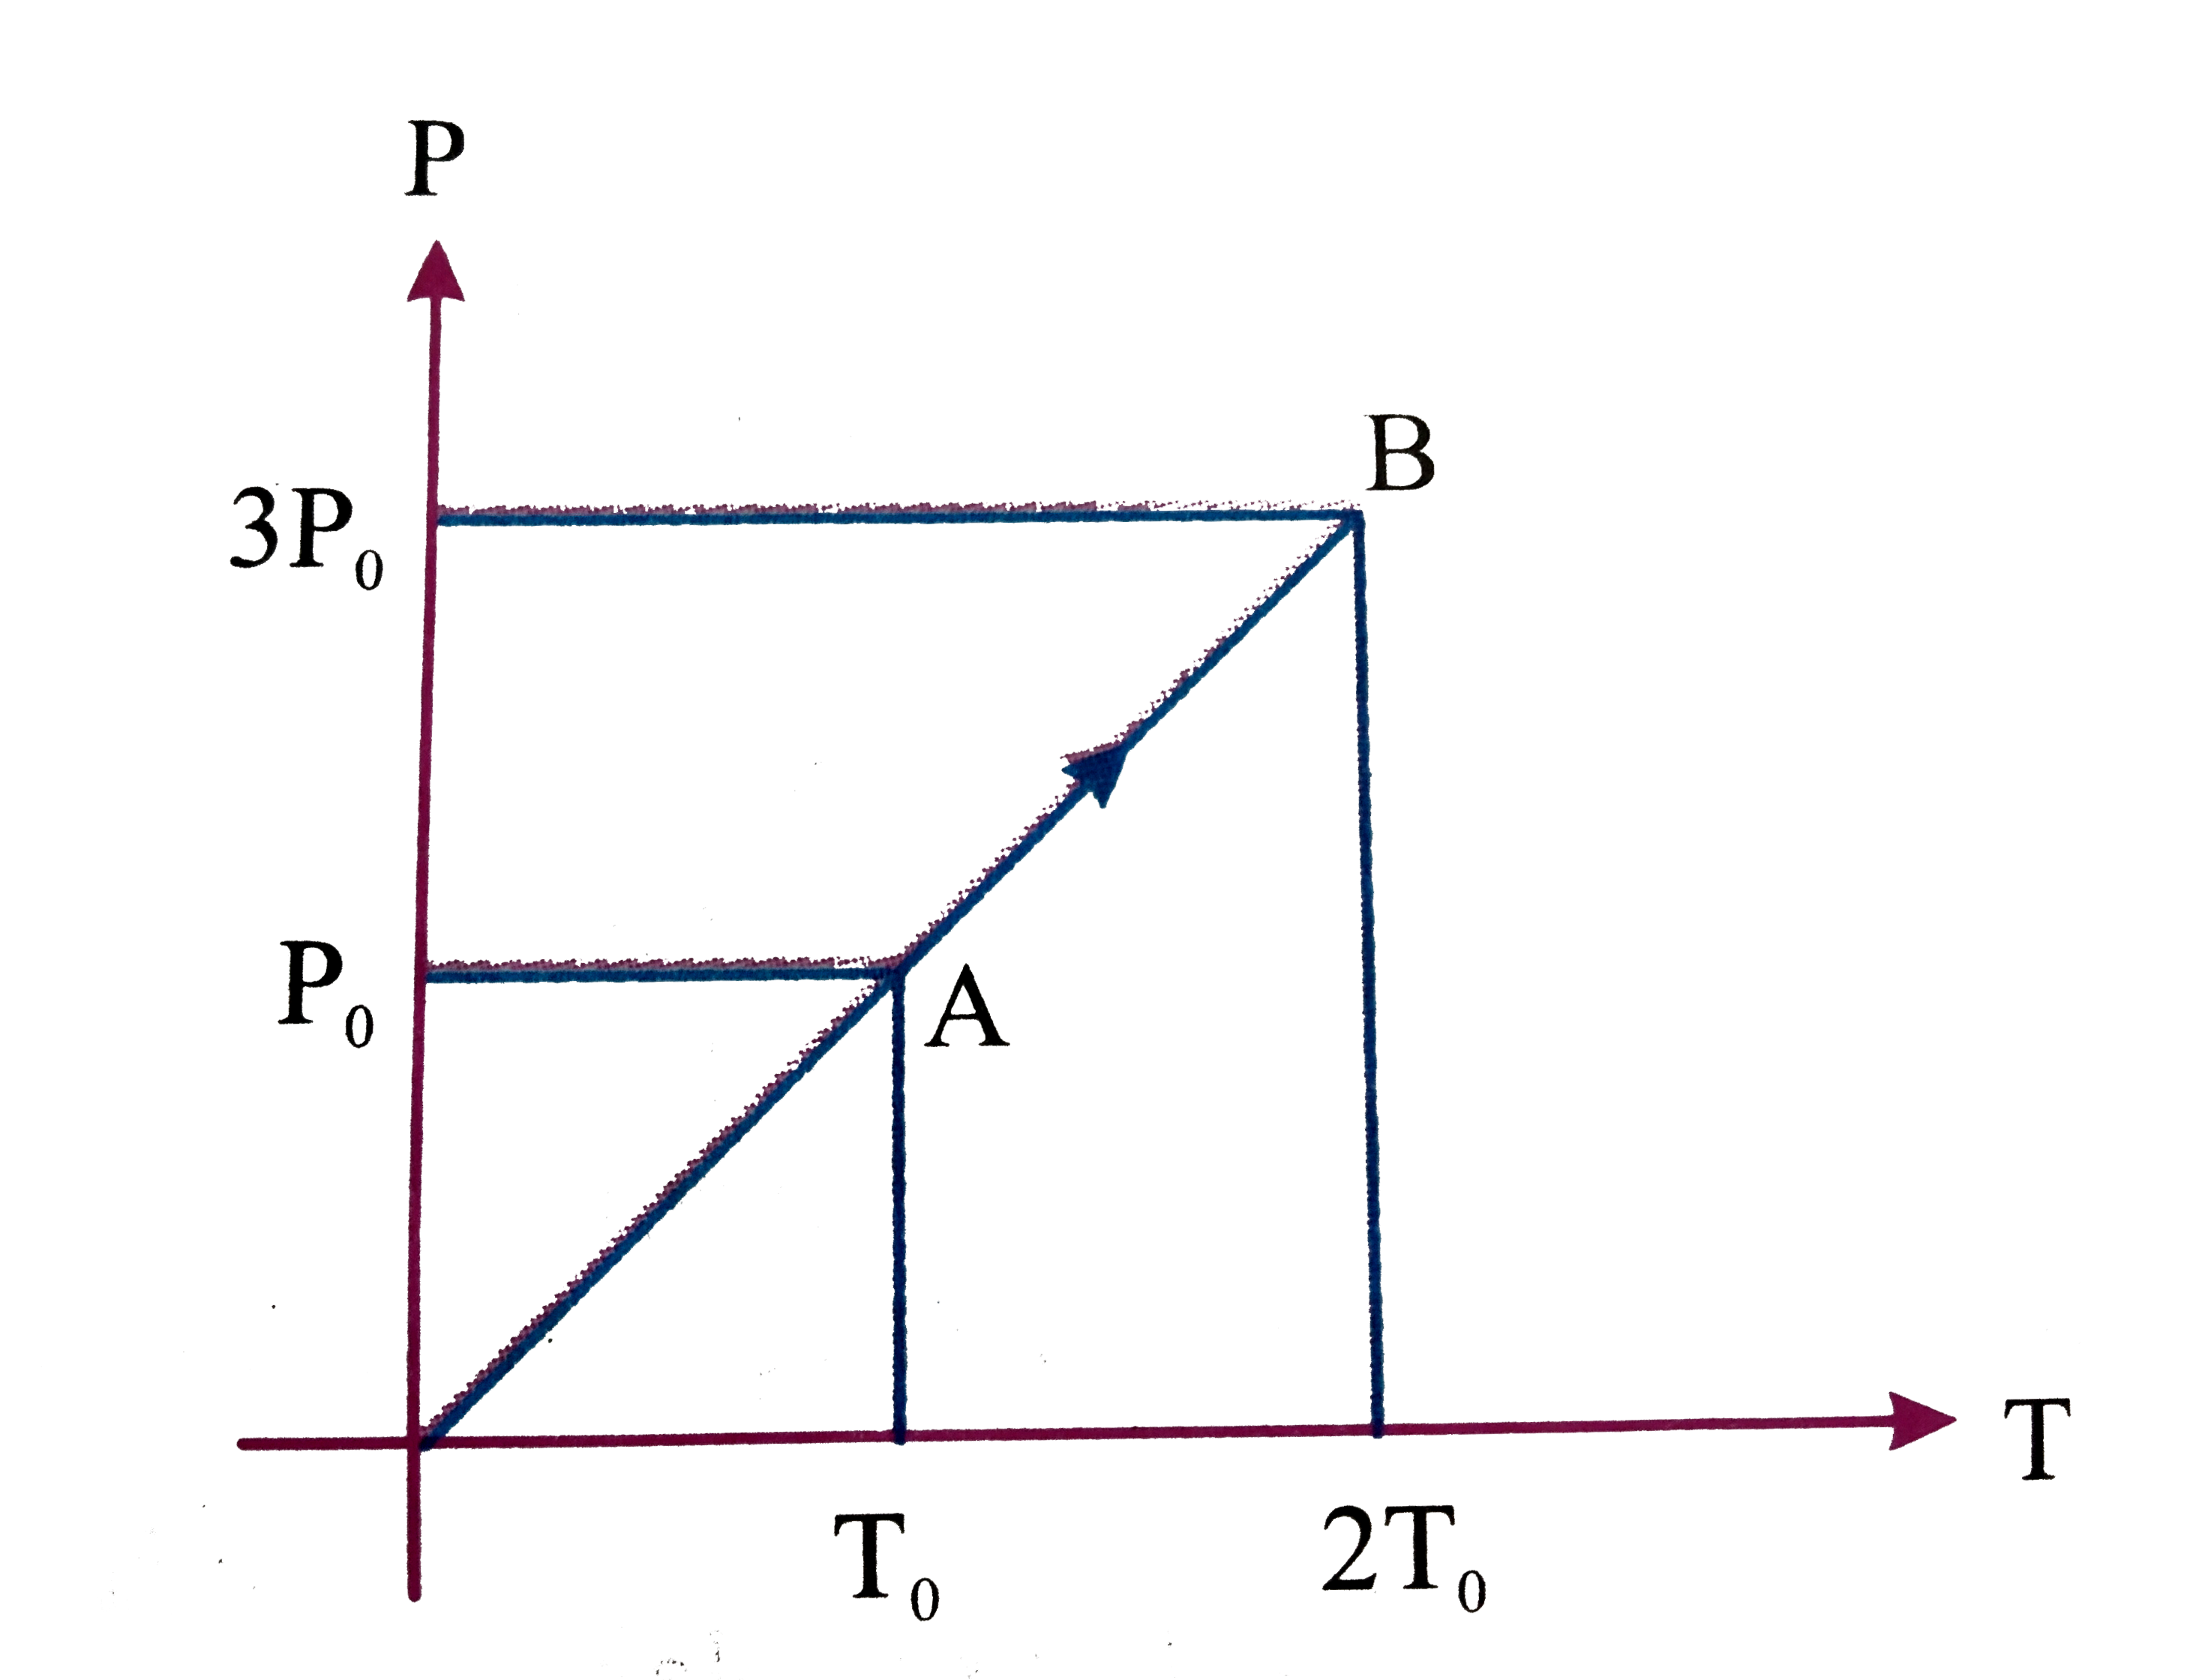
View SolutionPressure versus temperature graph of an ideal gas is shown in figure. Density of the gas at point A is ρ0. Density at B will be
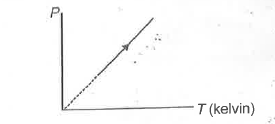
View SolutionThe graph of pressure and temperature for an ideal gas is as shown in figure. The given process is
View SolutionVolume versus temperature graph of two moles of helium gas is as shown in figure. The ratio of heat absorbed and the work done by the gas in process 1−2 is
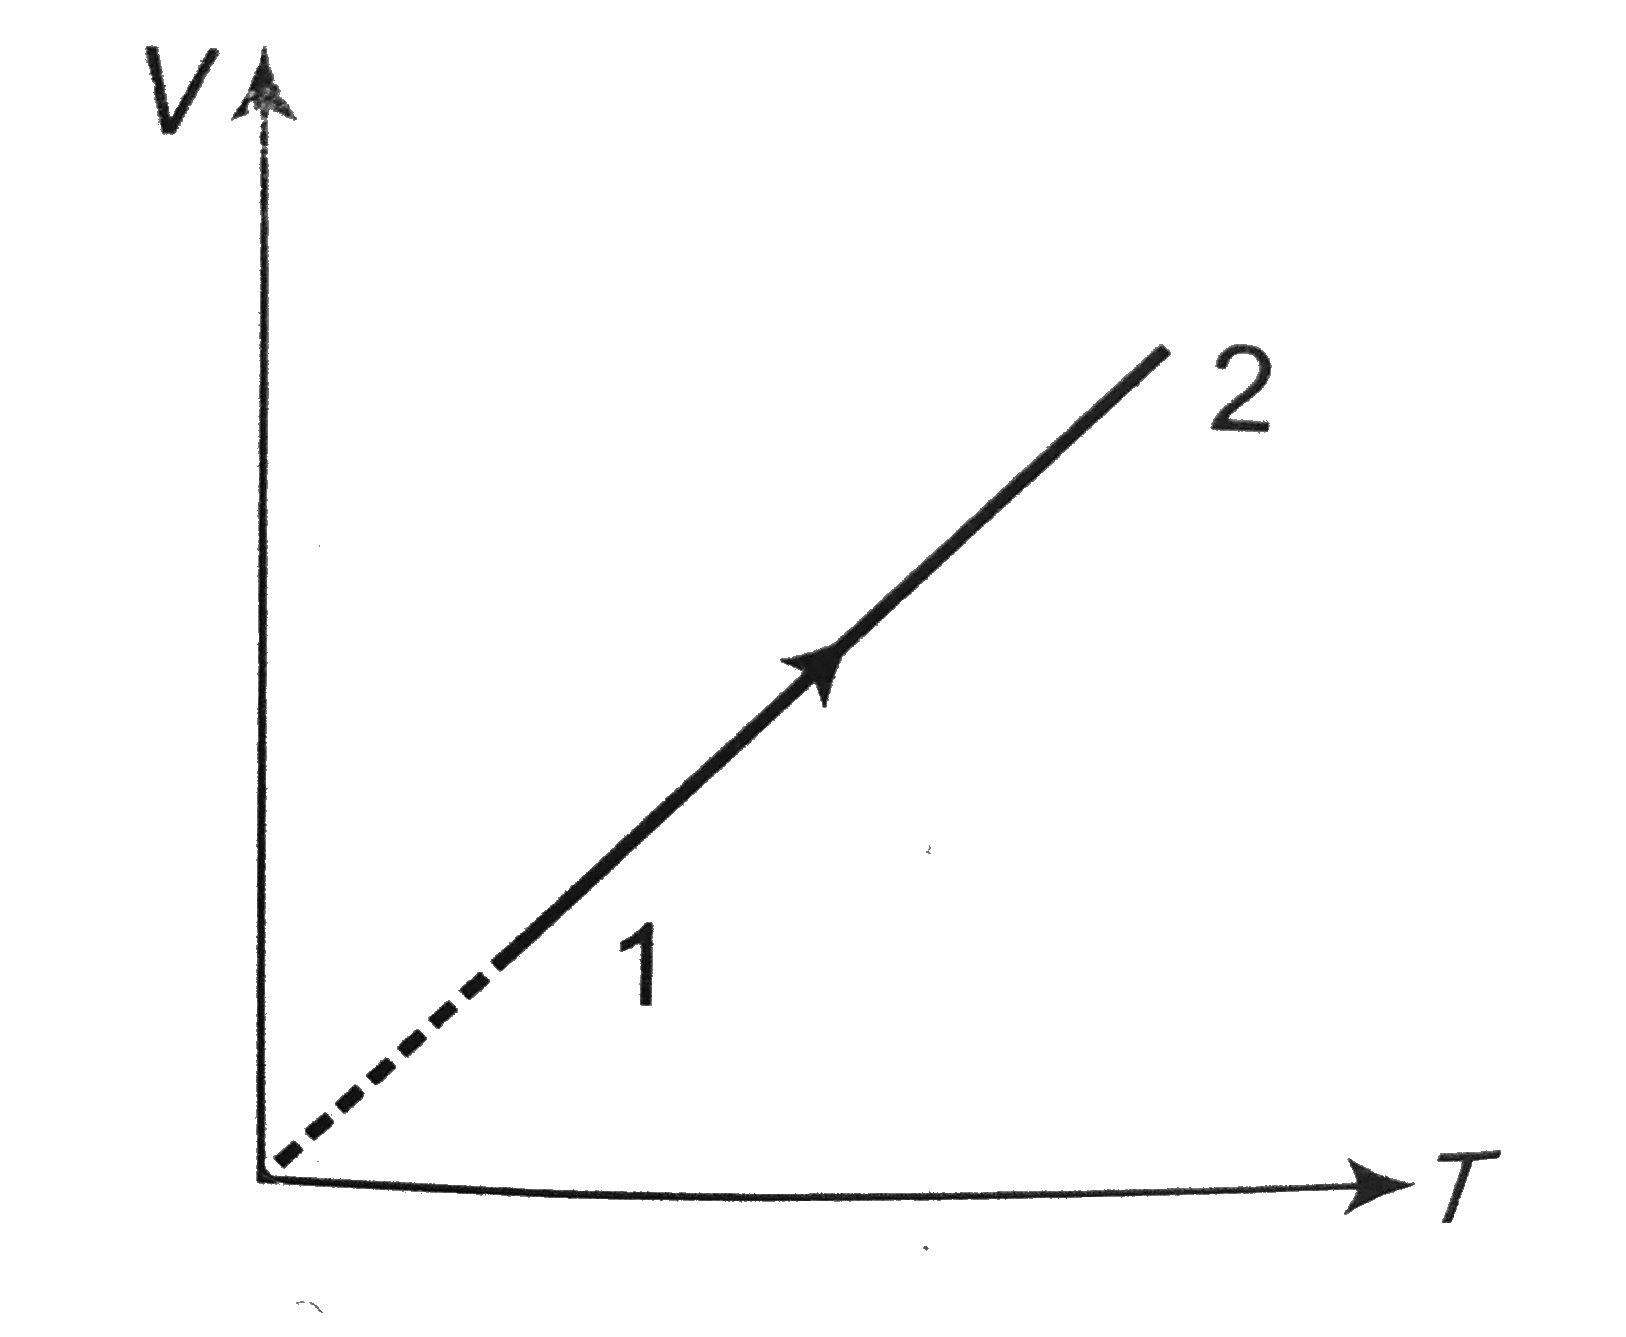
View SolutionVolume versus temperature graph of two moles of helium gas is as shown in figure. The ratio of heat absorbed and the work done by the gas in process 1−2 is

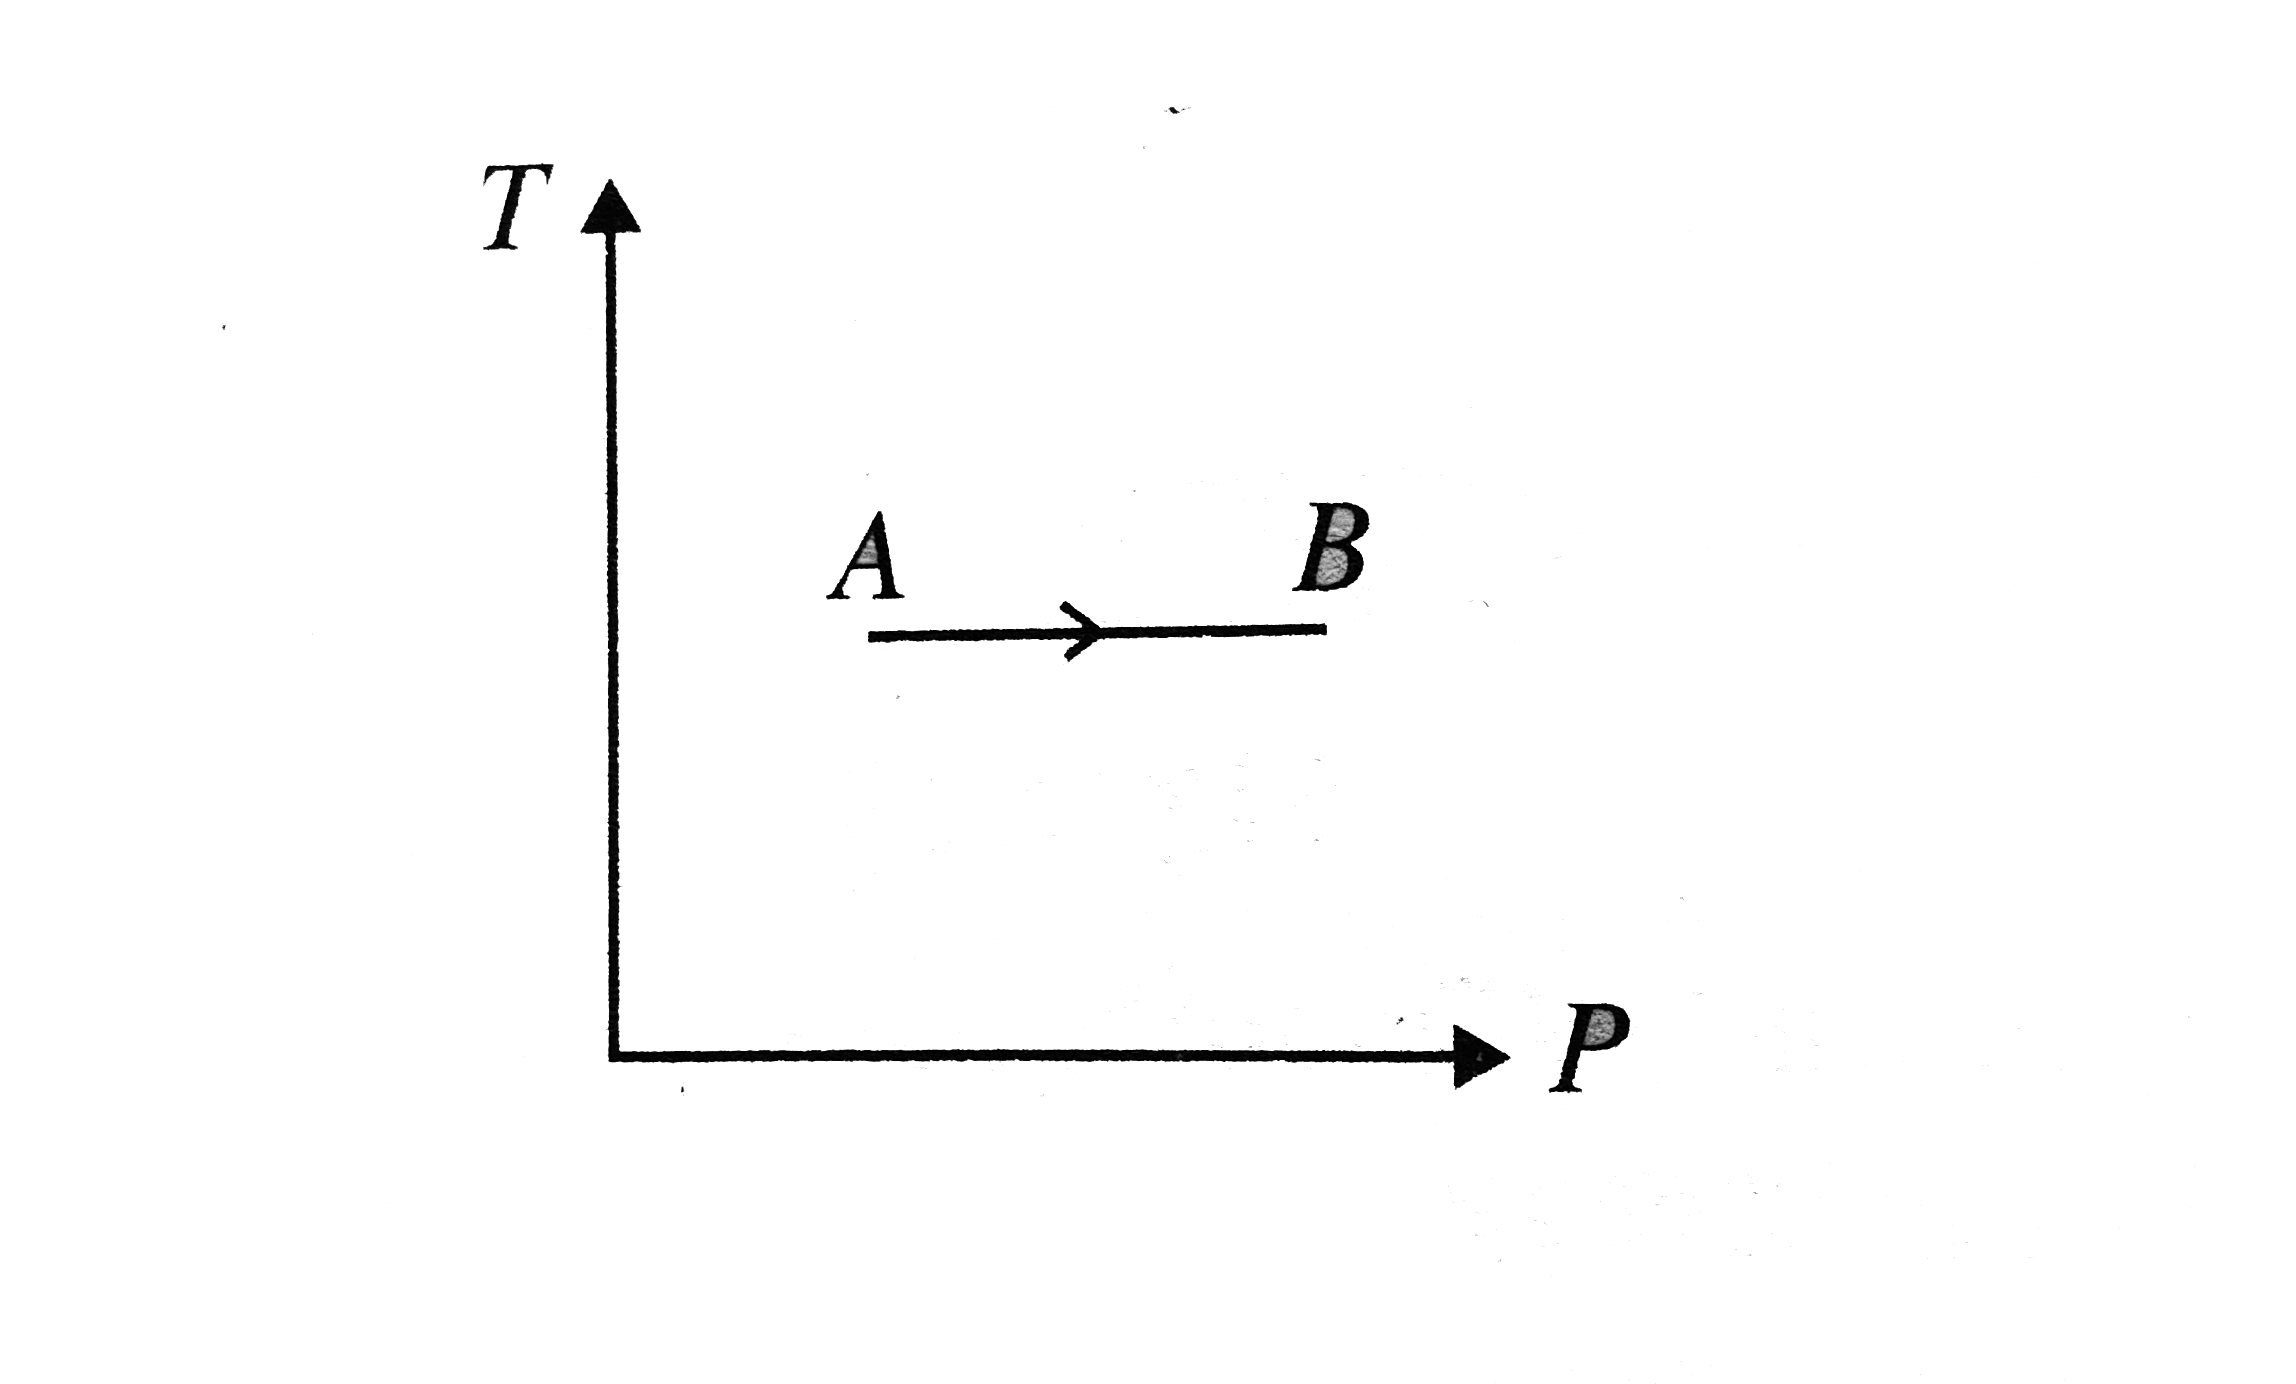
View SolutionTemperature versus pressure graph of an ideal gas is shown in Fig. During the process AB
View Solution
