The given graph shows the hormonal changes during a normal menstrual cycle. What would be a likely consequence if the hormone represented by graph Q is lacking in an adult female? A The uterine lining might not be sufficiently stable for implantation of fertilised ovum. B Levels of the hormone represented by graph P would be higher than normal. C Fertilisation of ovum would fail to occur. D There would be no significant effect since the functions of the hormones overlap.
Correct option A The uterine lining might not be sufficiently stable for implantation of fertilised ovum. Explanation:The graph P represents changes in estrogen level and graph Q represents changes in progesterone level during a normal menstrual cycle. Progesterone is required for the maintenance of uterine lining which is needed to implant the fertilised ovum. Thus if progesterone is lacking in an adult female her uterine lining might not be stable to support an implanted embryo.
Related Solutions
Refer to the given graph representing interplay of different hormones (A-D) during menstrual cycle in women and answer the question that follow. Which hormones is most effective in producing uterine changes during menstrual cycle?
View SolutionRefer to the given graph representing interplay of different hormones (A-D) during menstrual cycle in women and answer the question that follow.
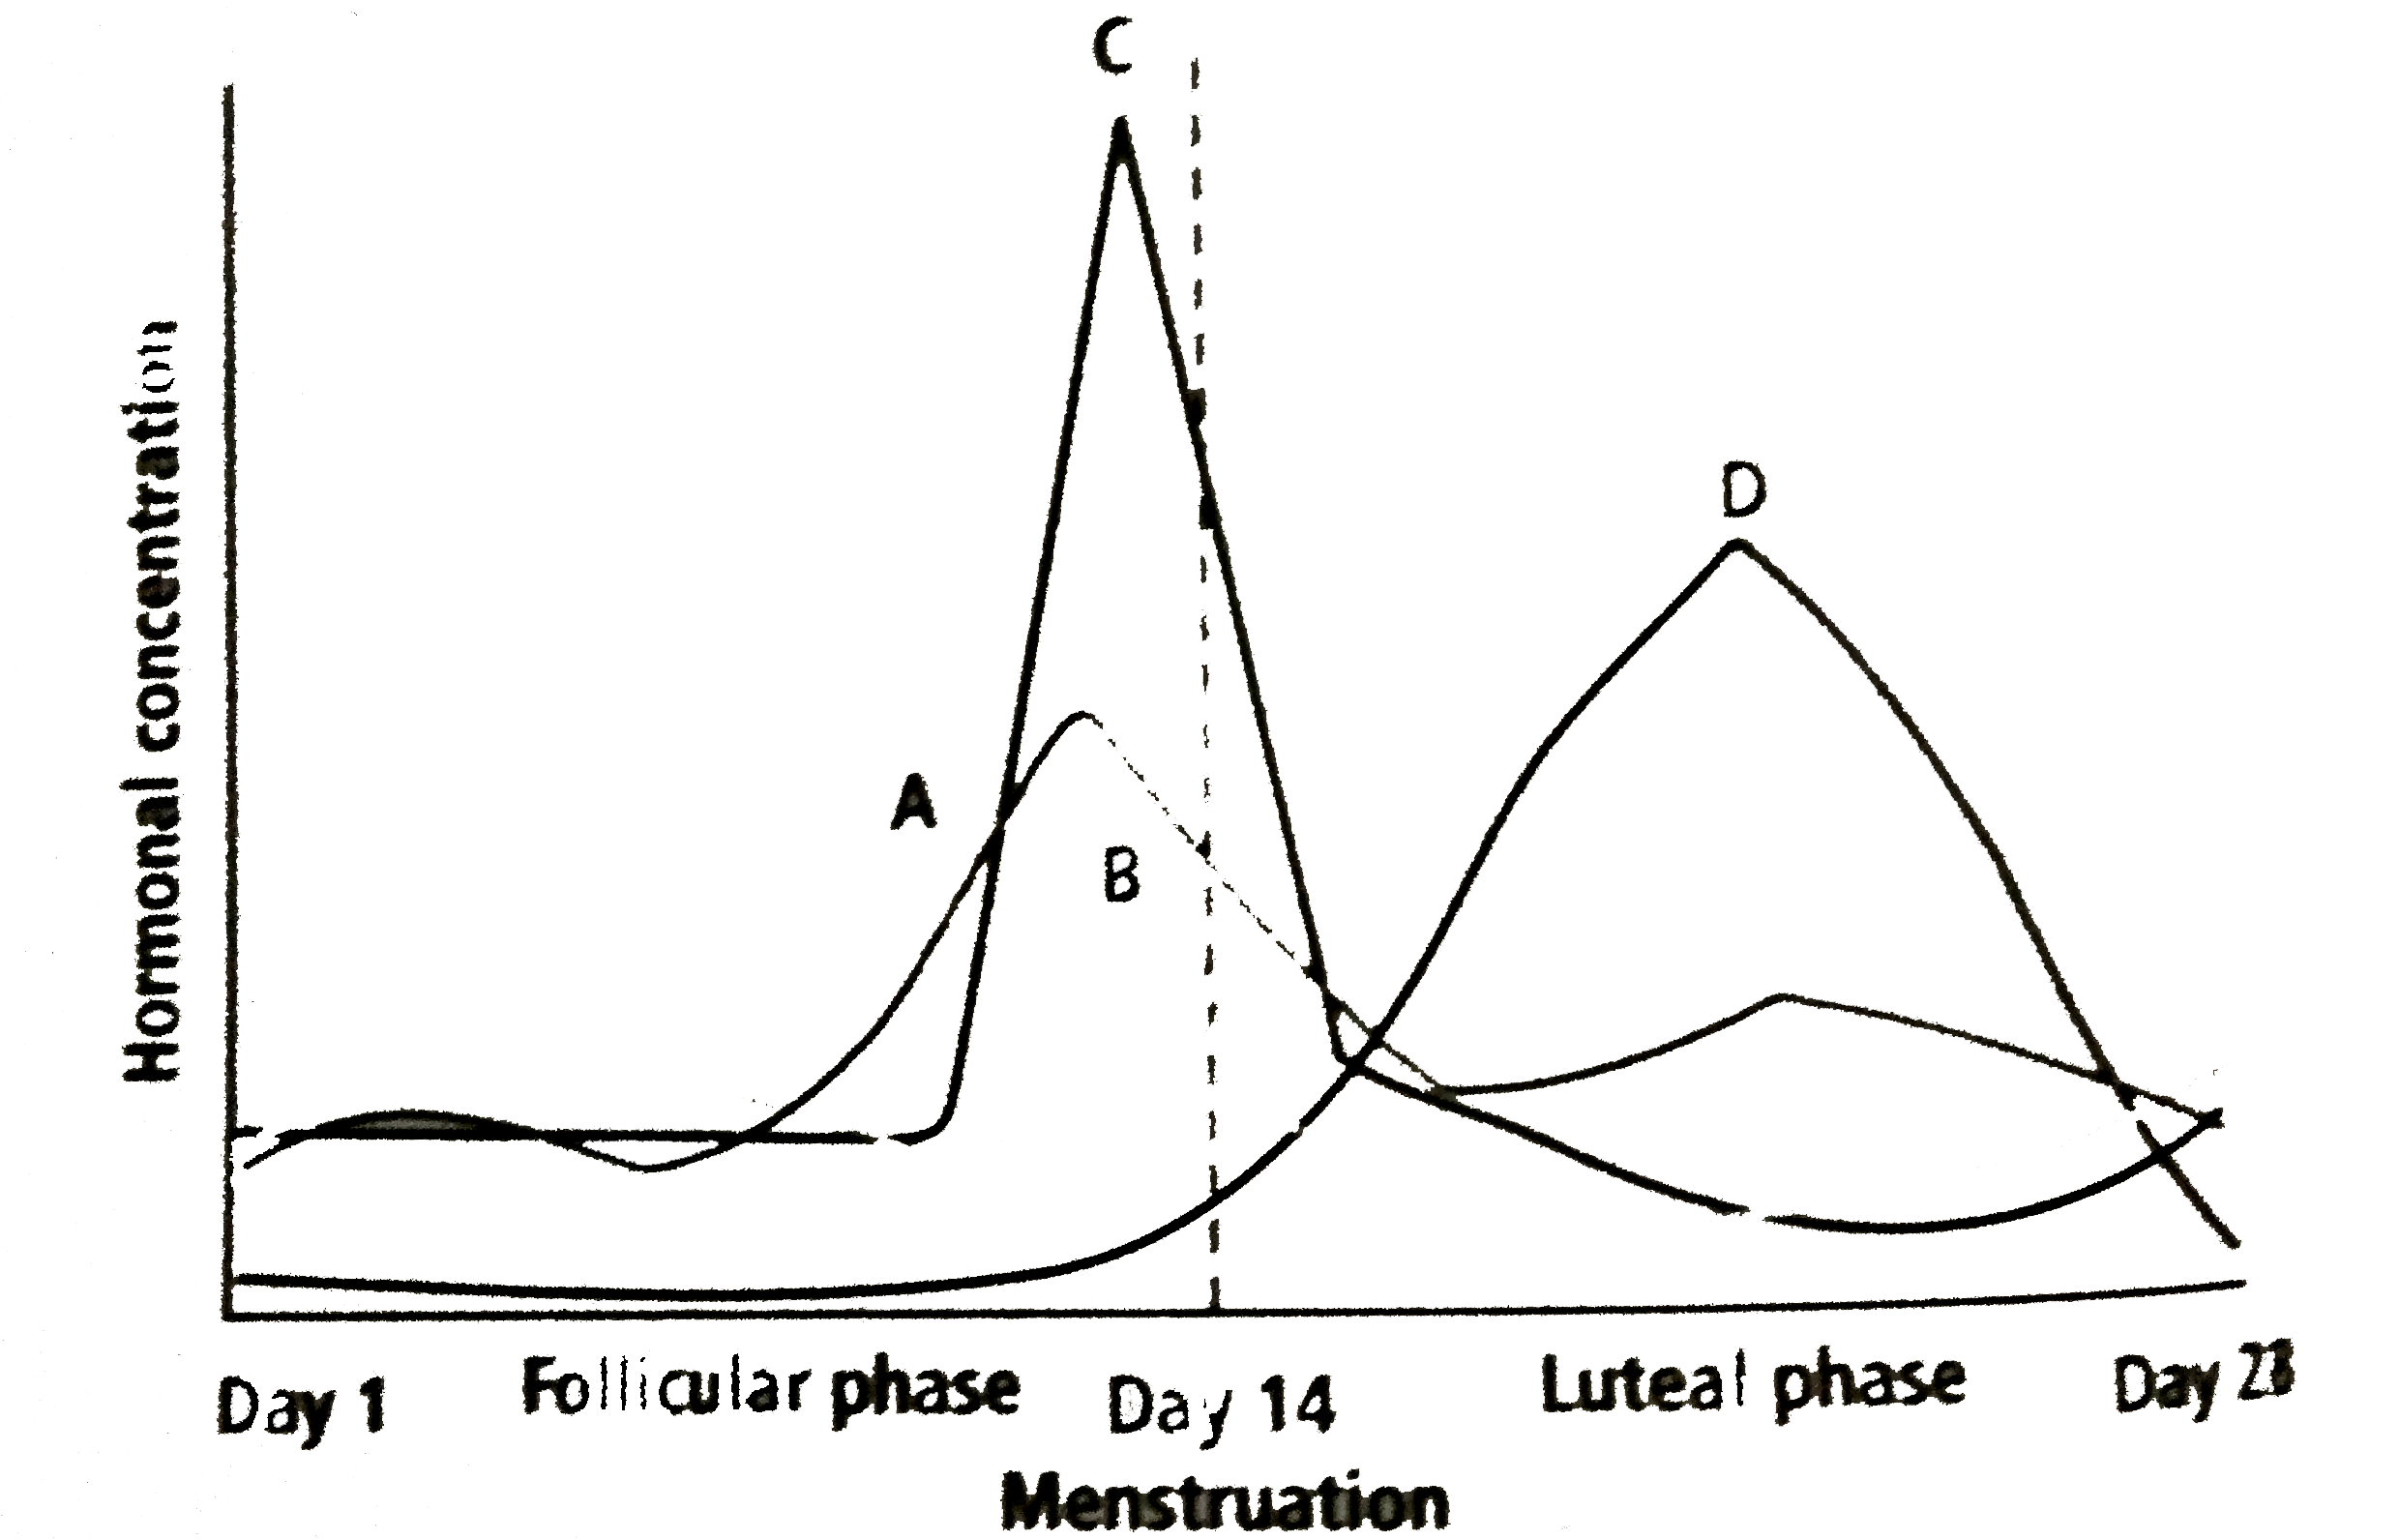
Which hormones is most effective in producing uterine changes during menstrual cycle?
View Solution
The following graph shows the levels of ovarian hormones during a menstrual cycle. What do 1 and 2 represent?
View SolutionThe following graph shows the levels of ovarian hormones during a menstrual cycle. What do 1 and 2 represent ?

View SolutionThe following graph shows the levels of ovarian hormones during a menstrual cycle. What do 1 and 2 represent?
View SolutionStudy the graph given below related to menstrual cycle in Females: Correlate and describe the uterine events that take place according to the ovarian hormone levels X and Y mentioned in the graph during 6-15 dats 16-25 days 26-28 days (when ovum is not fertilised)
View SolutionThe graph shows the level of ovarian hormones in a normally menstruating women during follicular phase. Reconstruct the hormonal graph for luteal phase. .
View SolutionThe following graph represents the concentrations of the four hormones present in the blood plasma of an woman during her menstrual cycle. Identify the hormones.
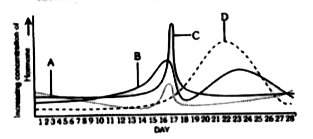
View SolutionThe graph given below shows the variations in the levels of ovarian hormones during various phases of menstrual cycle: Compare the role of A and B .
View SolutionThe graph given below shows the variations in the levels of ovarian hormones during various phases of menstrual cycle: Identify A and B .
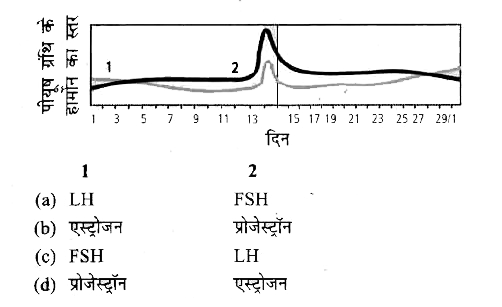
View Solutionनीचे दिया गया ग्राफ एक ऋतु स्राव चक्र के दौरान पिट्यूटरी हार्मोन्स के स्तरों को दर्शाता है। 1 व 2 क्या दर्शाते हैं?
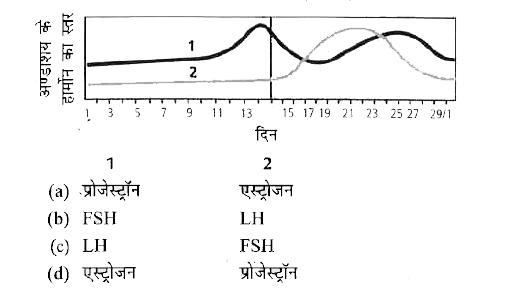
View Solutionनीचे दिया गया ग्राफ ऋतु स्राव चक्र के दौरान ओवेरीयन हार्मोन्स के स्तर को दर्शाता है। 1 व 2 क्या दर्शाते हैं?
View SolutionA human ovum is released on the 14th day of menstrual cycle. a. What happens to the ovum if it is fertilised by a sperm? b. Where does the fertilisation occur? c. What will happen to the Graafian follicles if the ovum is fertilised?
View Solution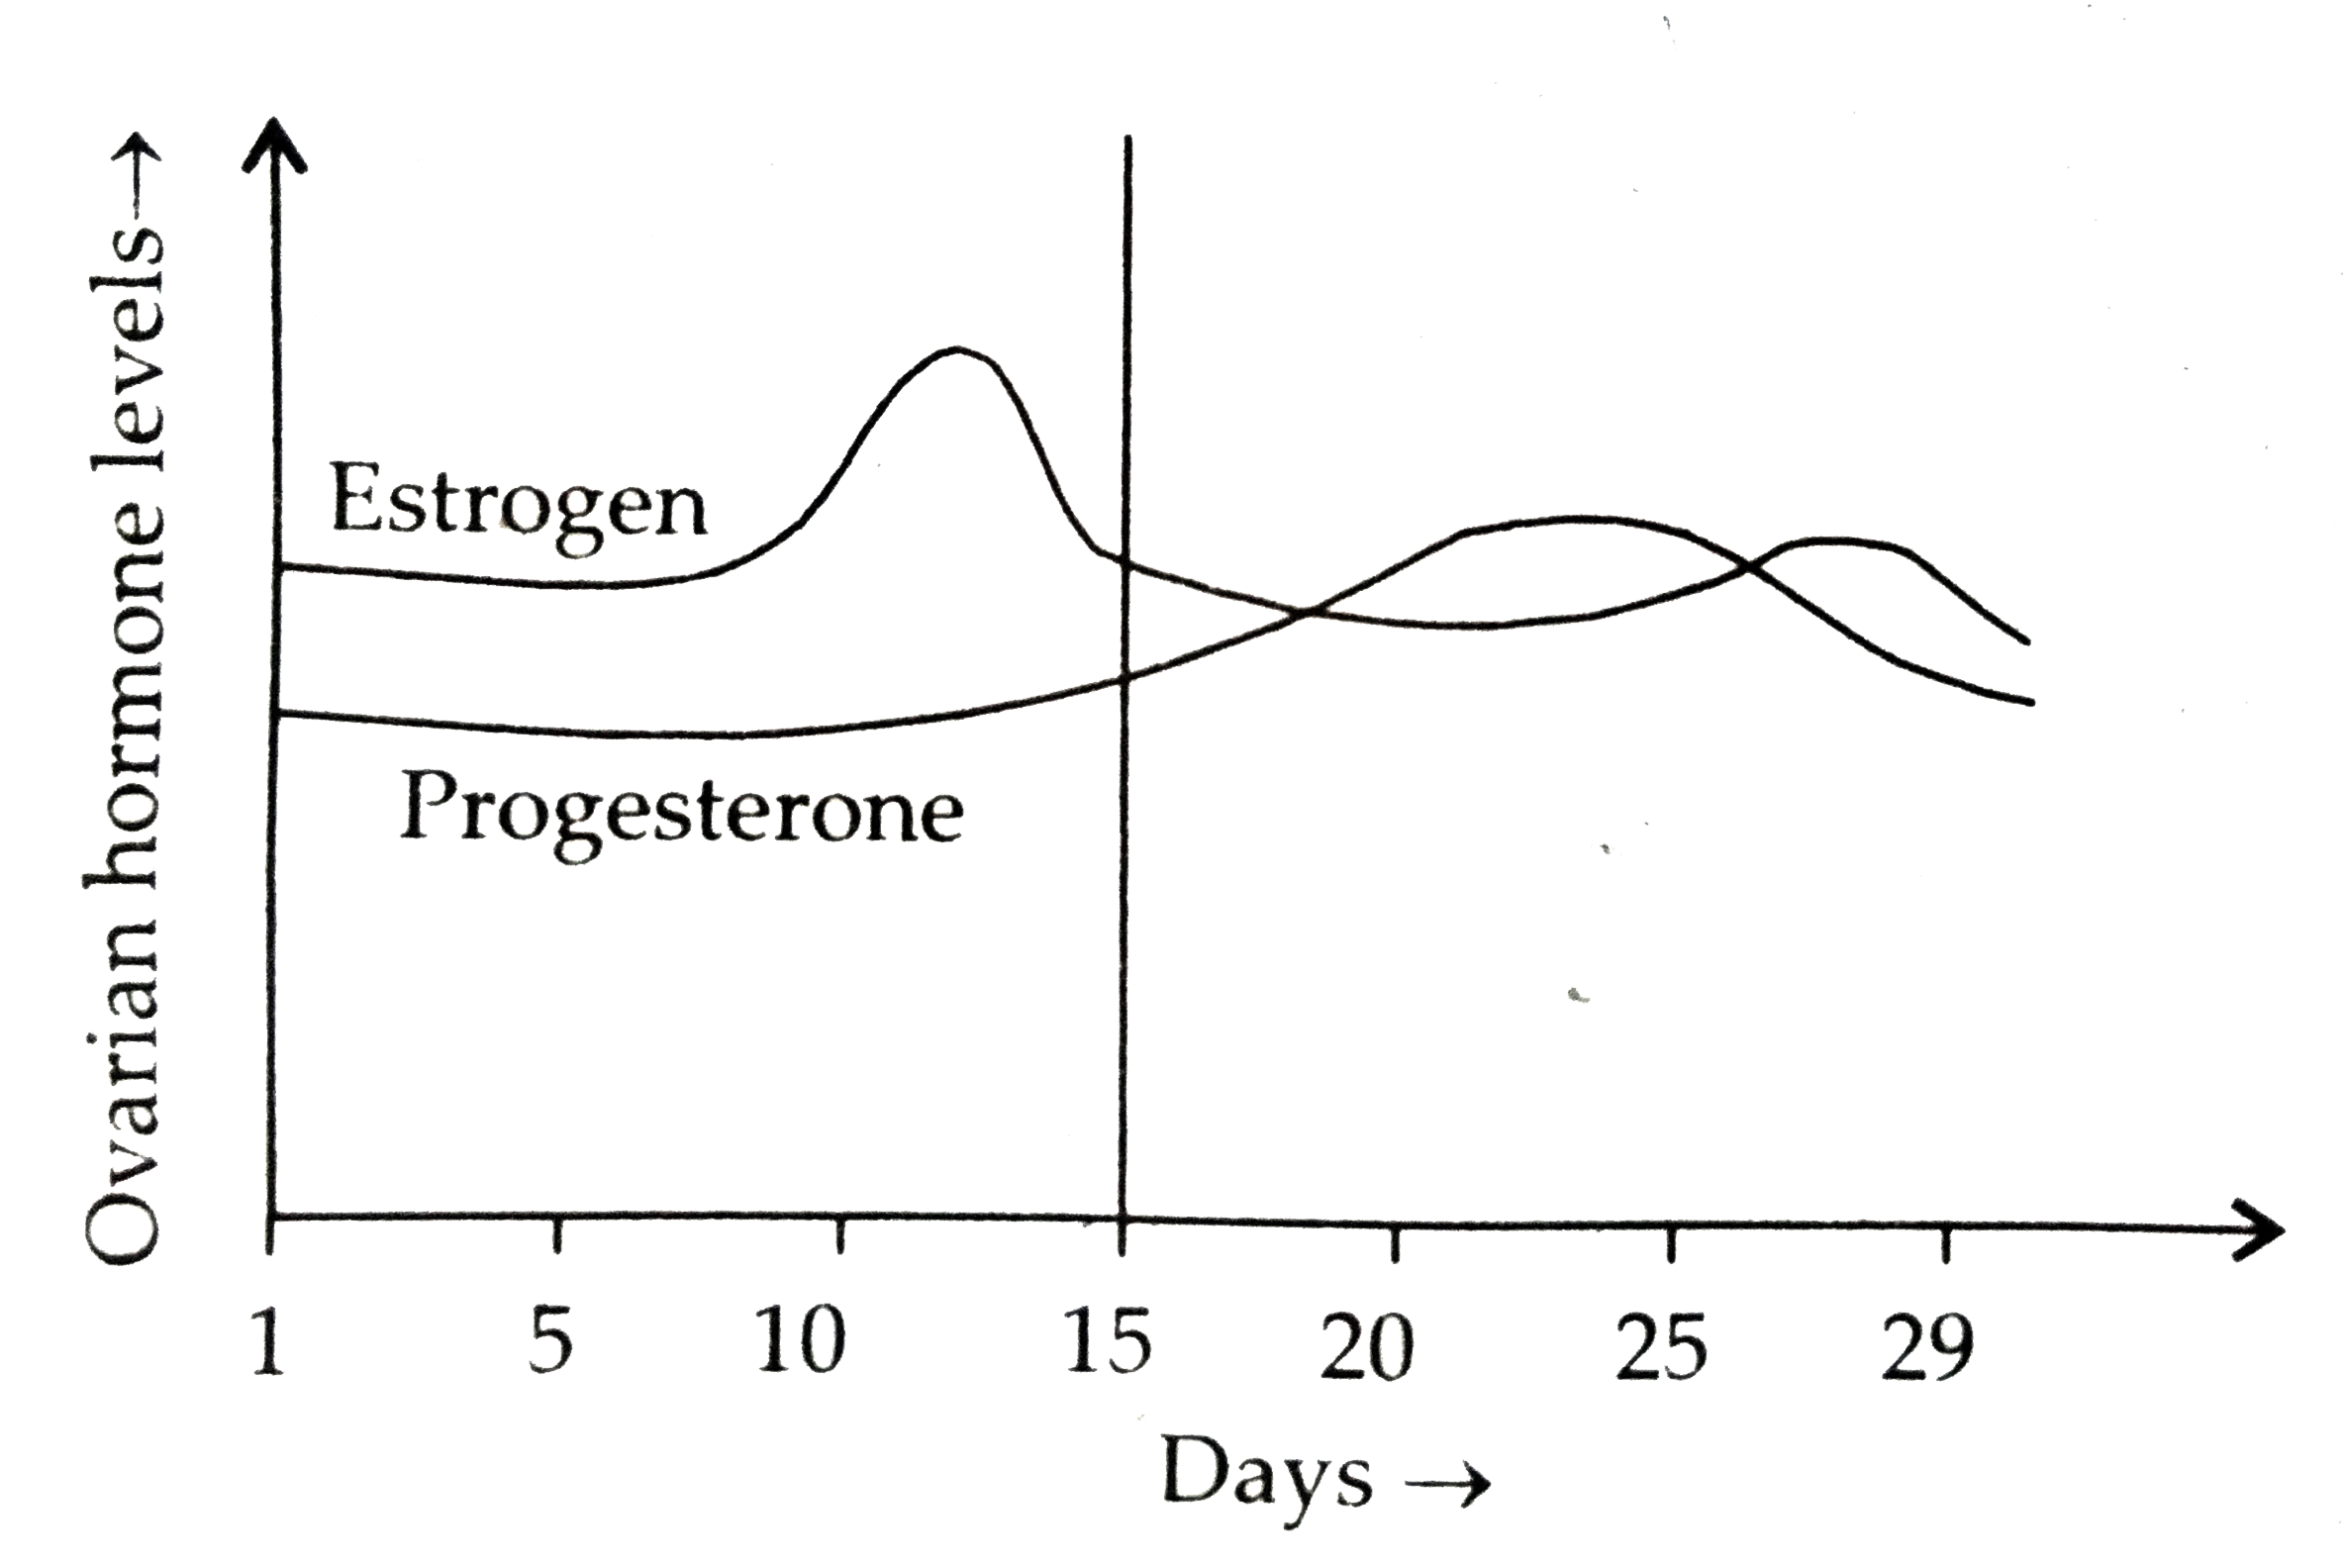 Read the graph given above and correlate the uterine events that take place according to the hormonal levels on
(i) 6 - 15 days
(ii) 16 - 25 days
(iii) 26 - 28 days (if the ovum is not fertilised )
(b) Specify the sources of the hormones mentioned in the graph.
View Solution Read the graph given above and correlate the uterine events that take place according to the hormonal levels on
(i) 6 - 15 days
(ii) 16 - 25 days
(iii) 26 - 28 days (if the ovum is not fertilised )
(b) Specify the sources of the hormones mentioned in the graph.
View Solution Read the graph given above and correlate the uterine events that take place according to the hormonal levels on
(i) 6 - 15 days
(ii) 16 - 25 days
(iii) 26 - 28 days (if the ovum is not fertilised )
(b) Specify the sources of the hormones mentioned in the graph.
View Solution Read the graph given above and correlate the uterine events that take place according to the hormonal levels on
(i) 6 - 15 days
(ii) 16 - 25 days
(iii) 26 - 28 days (if the ovum is not fertilised )
(b) Specify the sources of the hormones mentioned in the graph.
View SolutionRead the graph given above and correlate the uterine events that take place according to the hormonal levels on (i) 6 - 15 days (ii) 16 - 25 days (iii) 26 - 28 days (if the ovum is not fertilised ) (b) Specify the sources of the hormones mentioned in the graph.
View Solution Read the graph given above and correlate the uterine events that take place according to the hormonal levels on
(i) 6 - 15 days
(ii) 16 - 25 days
(iii) 26 - 28 days (if the ovum is not fertilised )
(b) Specify the sources of the hormones mentioned in the graph.
View SolutionThe graph given below shows the variations in the levels of ovarian hormones during various phases of menstrual cycle: Specify the source of the hormone marked in the diagram.
View Solution