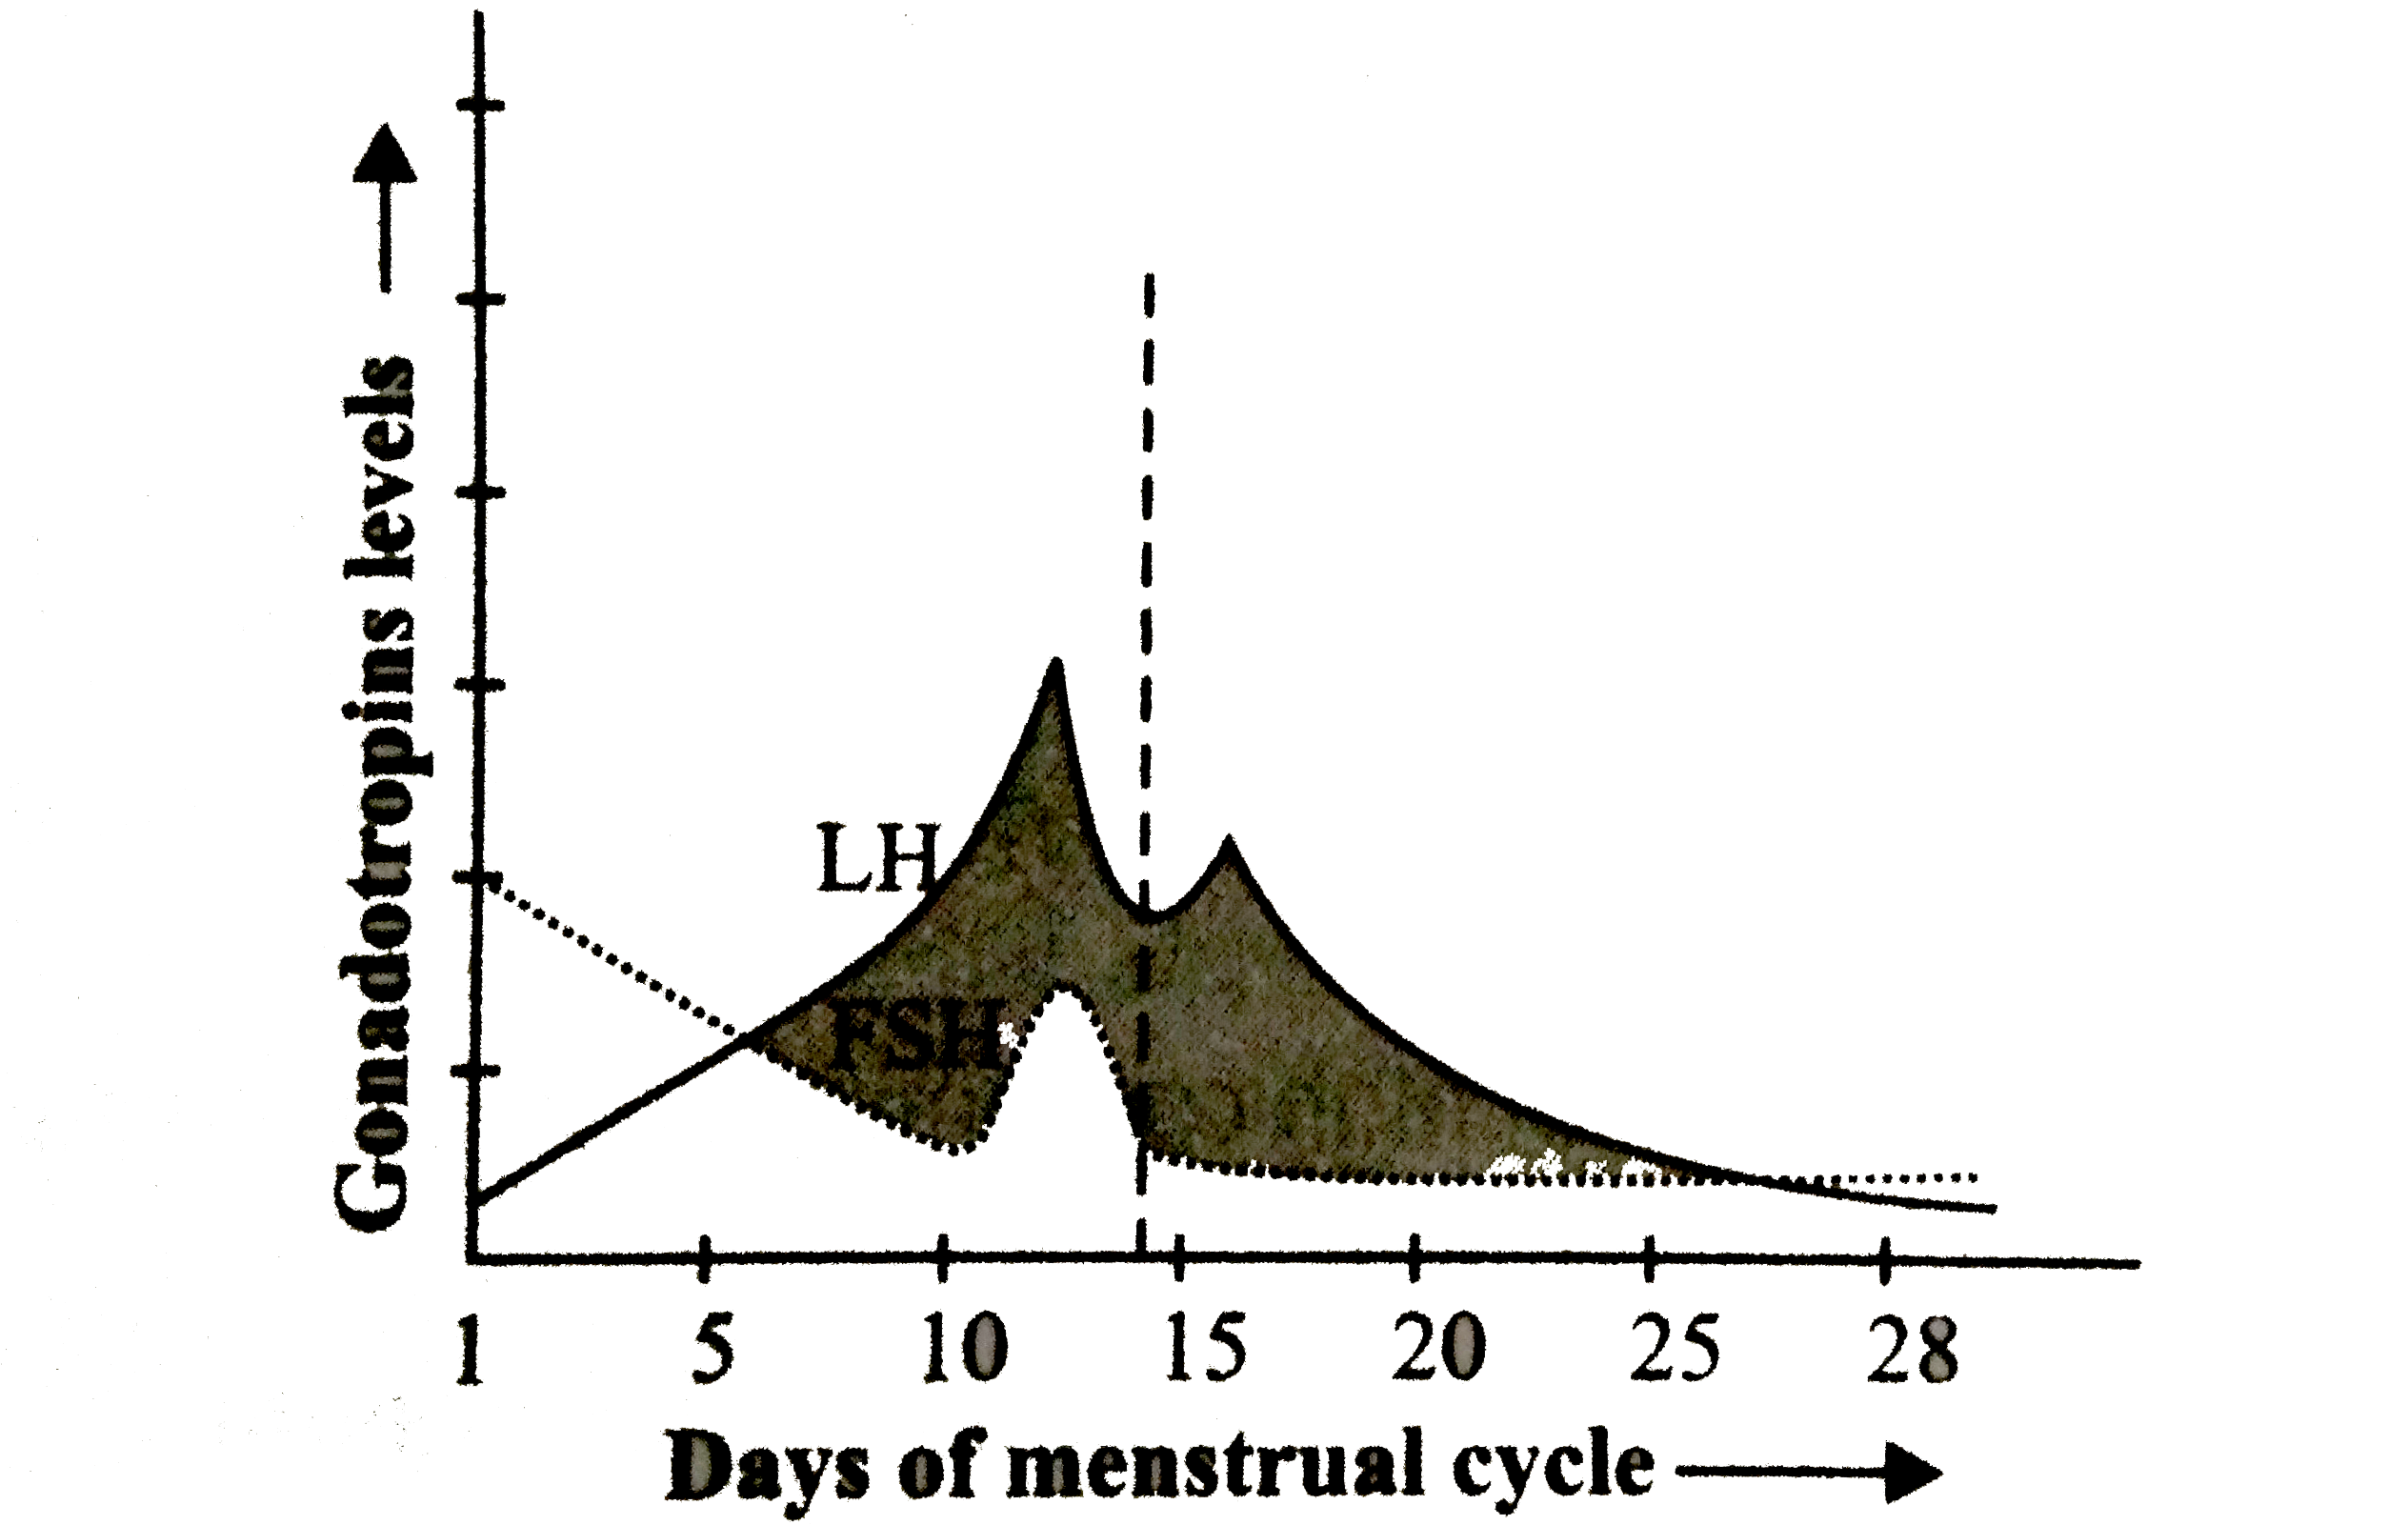
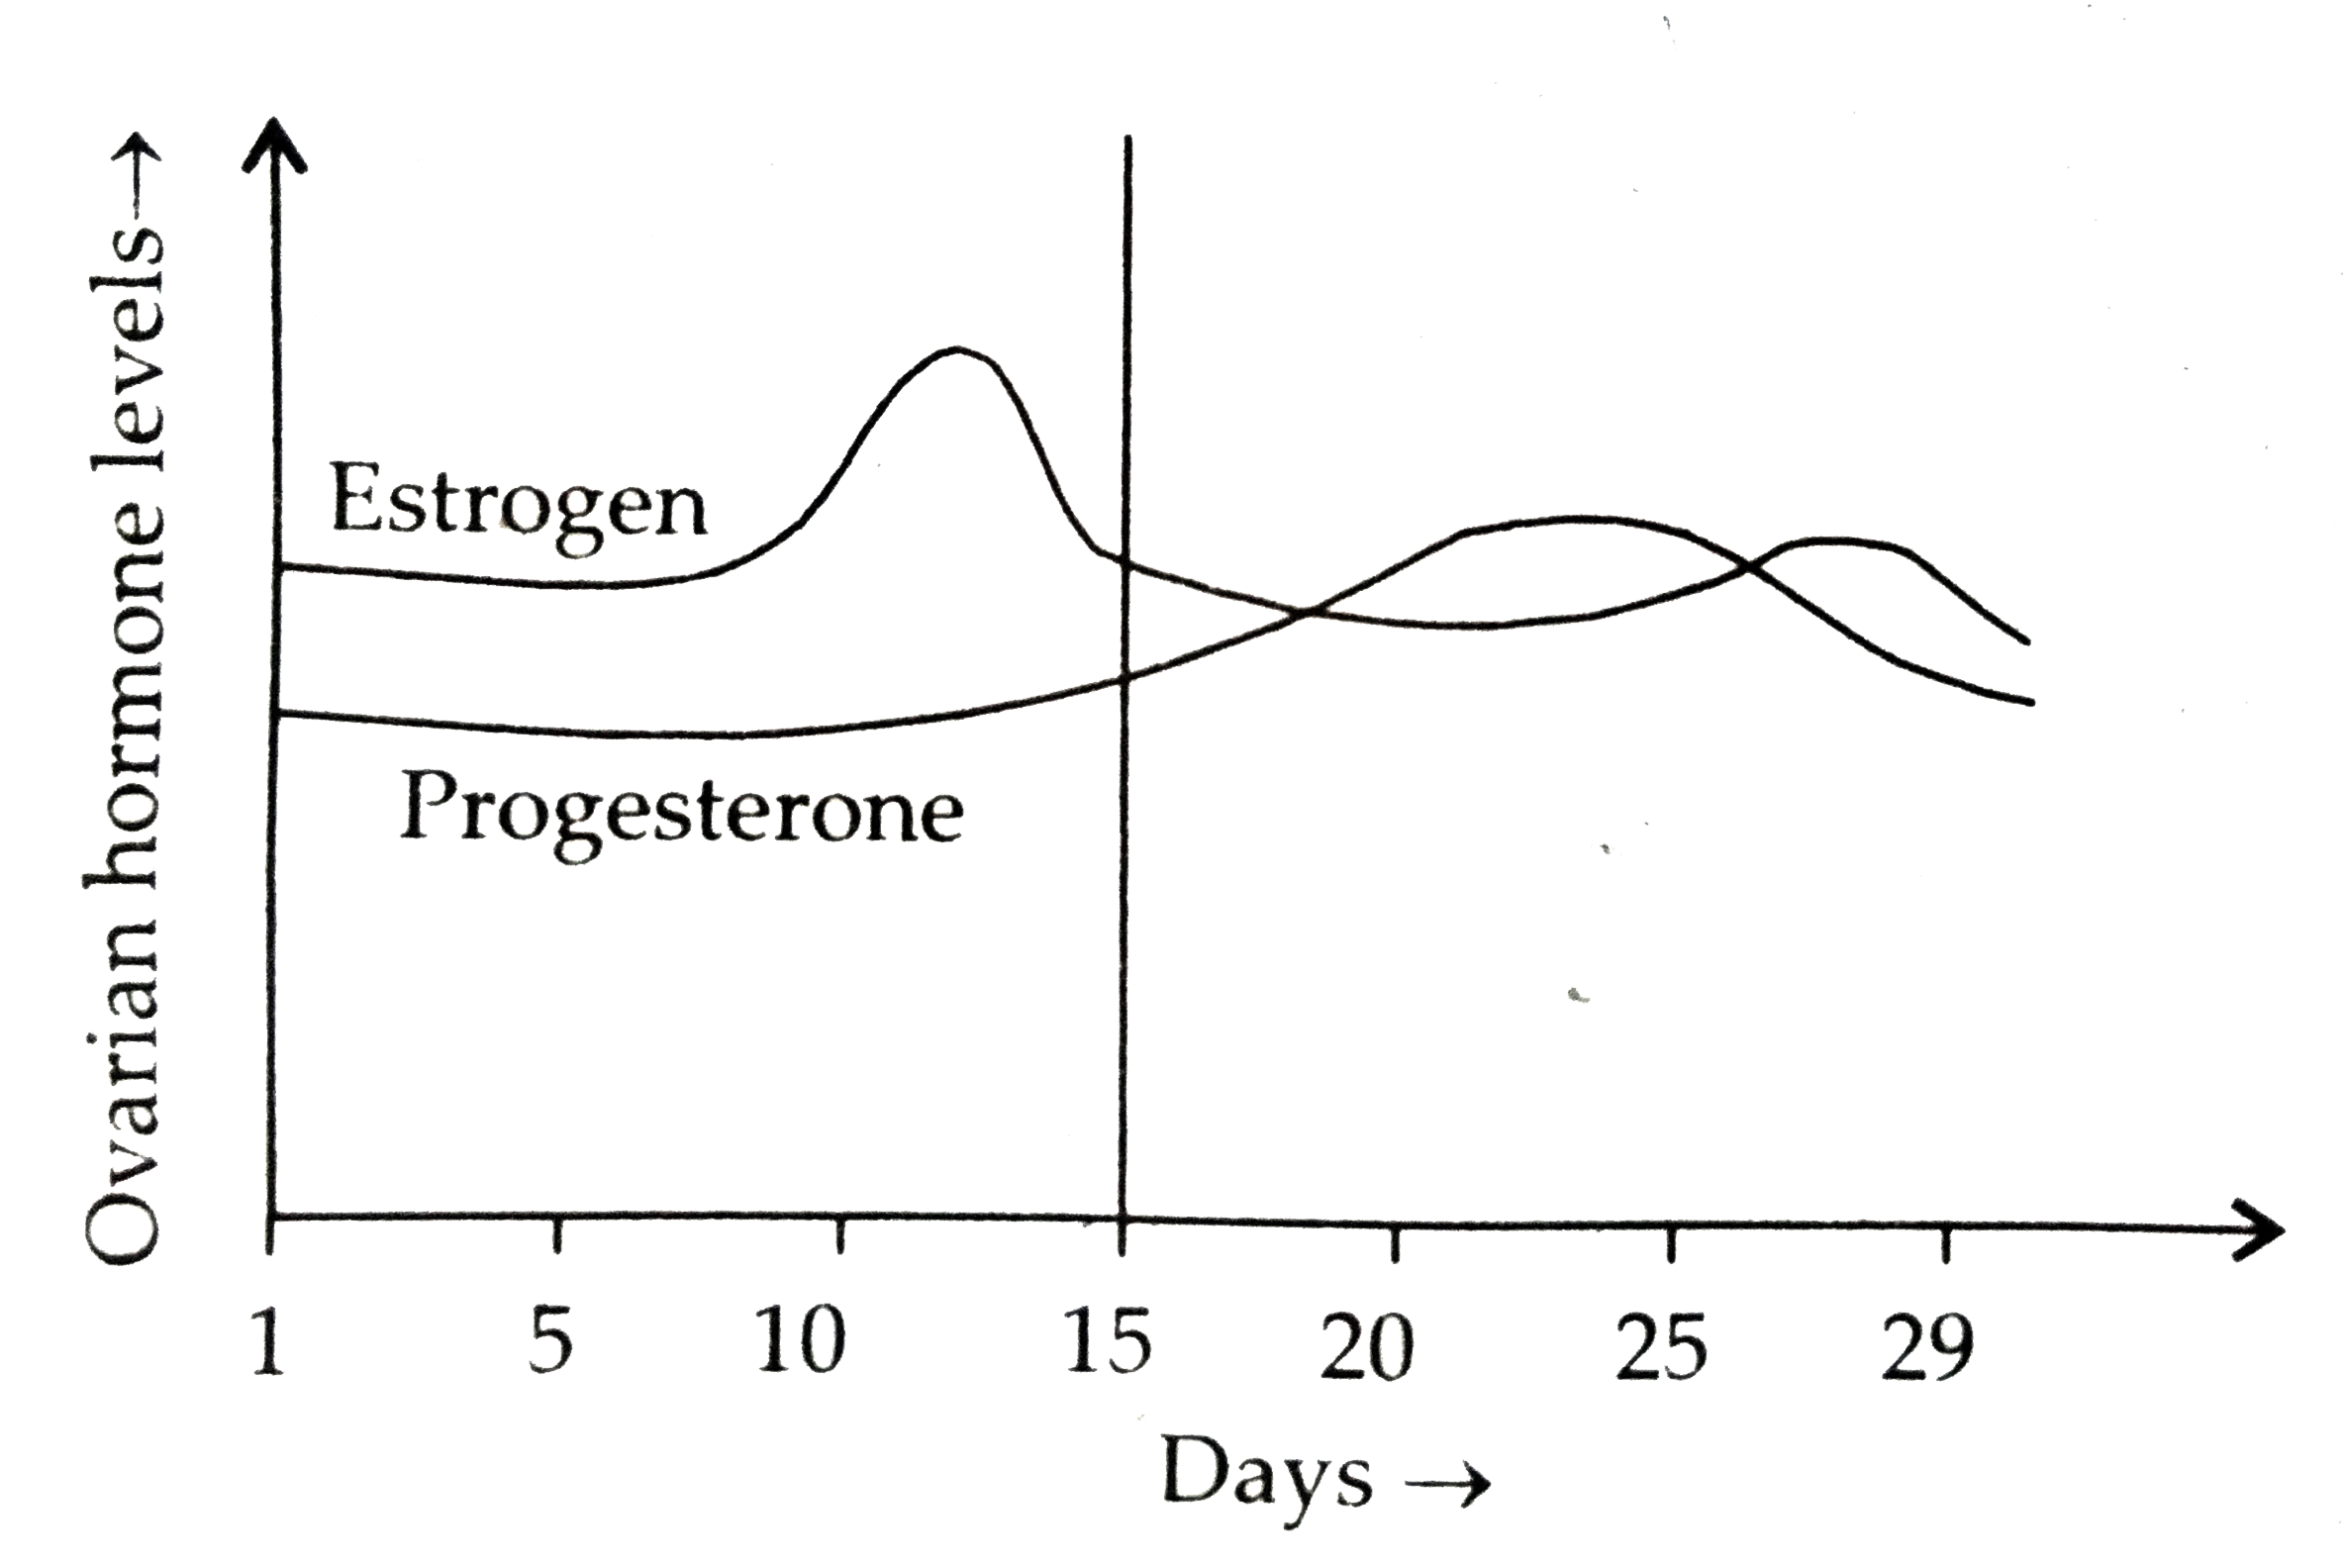
Study the graph given below related to menstrual cycle in Females:

Correlate and describe the uterine events that take place according to the ovarian hormone levels X and Y mentioned in the graph during
6-15 dats
16-25 days
26-28 days (when ovum is not fertilised)Solution in Punjabi
Step by step video & image solution for Study the graph given below related to menstrual cycle in Females: Correlate and describe the uterine events that take place according to the ovarian hormone levels X and Y mentioned in the graph during 6-15 dats 16-25 days 26-28 days (when ovum is not fertilised) by Biology experts to help you in doubts & scoring excellent marks in Class 12 exams.
Updated on:21/07/2023Topper's Solved these Questions
Similar Questions
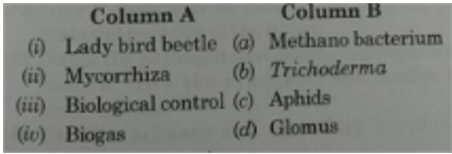
Match the items in column 'A' and 'B' and the choose correct answer

The correct answer is:
View SolutionIf one can induce parthenocarpy through the application of growth substances, which fruits would you select for parthenocarpy and why?
View Solution
Study the garaph carefully and correlate the hormone levels on
(i) 1-5 days
(ii). 12-14 days
(iii). 25-28 days (if the ovum is not fertilised)
View SolutionExplain the ovarian and uterine events that occur during a menstrual cycle in a human female, under the influence of Pituitary and Ovarian hormones respectively.
View SolutionExplain the events in a normal woman during her menstrual cycle on the following days.
Ovarian event from 13-15 days
(b) Ovarian hormones level from 16 to 32 days
(c) Uterine events from 24 to 29 days.
View Solution Read the graph given above and correlate the uterine events that take place according to the hormonal levels on
(i) 6 - 15 days
(ii) 16 - 25 days
(iii) 26 - 28 days (if the ovum is not fertilised )
(b) Specify the sources of the hormones mentioned in the graph.
View SolutionExplain the events in a normal woman during her menstrual cycle on the following days,. (a) Ovarian even from 13-15 days (b) Ovarian hormones level from 16 to 23 days (c) Uterine events from 24 to 29 days
View SolutionRead the graph given beow. Correlate the ovarian events that take place in the human femaek according to the level of the pituitary hormone during the following day. (i) 10th - 14th days (ii) 14th - 15th days (iii) 16th - 23th days (iv) 25th - 29th days (If the ovum is not fertilised)
View SolutionStudy the graph given below related with menstrual cycle in females: a. Identify ovarian hormones X and Y mentioned in the graph and specify their source. Corelate and describe the uterine events that take place according to the ovarian hormone levels X and Y mentioned in the graph on - i. 6 – 15 days ii. 16 – 25 days iii. 26 – 28 days (when ovum is not fertilized)
View SolutionExplain the ovarian and uterine events that occur during a menstrual cycle in a human female, under the influence of Pituitary and Ovarian hormones respectively.
View SolutionExplain the events in a normal woman during her menstrual cycle on the following days.
Ovarian event from 13-15 days
(b) Ovarian hormones level from 16 to 32 days
(c) Uterine events from 24 to 29 days.
View Solution Read the graph given above and correlate the uterine events that take place according to the hormonal levels on
(i) 6 - 15 days
(ii) 16 - 25 days
(iii) 26 - 28 days (if the ovum is not fertilised )
(b) Specify the sources of the hormones mentioned in the graph.
View Solution Read the graph given above and correlate the uterine events that take place according to the hormonal levels on
(i) 6 - 15 days
(ii) 16 - 25 days
(iii) 26 - 28 days (if the ovum is not fertilised )
(b) Specify the sources of the hormones mentioned in the graph.
View Solution
Study the garaph carefully and correlate the hormone levels on
(i) 1-5 days
(ii). 12-14 days
(iii). 25-28 days (if the ovum is not fertilised)
View Solution Read the graph given above and correlate the uterine events that take place according to the hormonal levels on
(i) 6 - 15 days
(ii) 16 - 25 days
(iii) 26 - 28 days (if the ovum is not fertilised )
(b) Specify the sources of the hormones mentioned in the graph.
View SolutionThe graph given below shows the variations in the levels of ovarian hormones during various phases of menstrual cycle: Under which condition will the level of B continue to remain high on the 28^th day?
View Solution
