Using a graph paper draw an ogive for the following distribution which shows a record of the width in kilograms of 200 students.WeightFrequency40-45545-501750-552255-604560-655165-703170-752075-809Use your ogive to estimate the following :i The percentage of students weighting 55 kg or moreii The weight above which the heaviest 30% of the student falliii The number of students who are a underweightb overweight if 55.70 kg is considered as standard weight.
iii a underweight students when 55.70 kg is standard = 46 approx from graph
Related Solutions
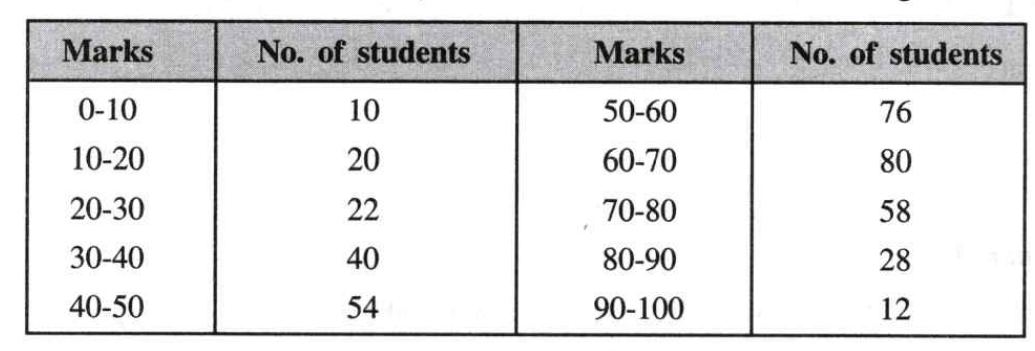
The marks obtained (out of 100) by 400 students in an examination are given below:

Using a graph paper, draw an ogive for the above distribution. Use ogive to estimate:
the number of students who did not pass if the pass percentage was 35.
View SolutionThe marks obtained (out of 100) by 400 students in an examination are given below:

Using a graph paper, draw an ogive for the above distribution. Use ogive to estimate the following: estimate the median.
View SolutionThe average weight of 55 students is 55 kg , and the average weight of another 45 students is 45 kg .
Find the average weight of all the students .
View SolutionThe average weight of a group of six students is 55 kg, of which the weight of the first five students is 49 kg, 58 kg, 48 kg, 54 kg and 62 kg respectively, then find the weight of the sixth student.
View SolutionThe marks obtained (out of 100) by 400 students in an examination are given below:

Using a graph paper, draw an ogive for the above distribution. Use ogive to estimate the following: estimate the number of students who obtained more than marks in the examination.
View SolutionThe following table shows the distribution of the heights of a group of students: Use a graph sheet to draw an Ogive for the distribution. Use the Ogive to find: the inter quartile range
View SolutionIf the average weight of 6 students is 50 kg , that of 2 students is 51 kg and that of rest of 2 students is 55 kg , then the average weight of all the students is
View SolutionThe following table shows the distribution of the heights of a group of students:

Use a graph sheet to draw an Ogive for the distribution. Use the Ogive to find:
the number of students whose height is more than 168 cm
View SolutionThe following table shows the distribution of the heights of a group of students:

Use a graph sheet to draw an Ogive for the distribution. Use the Ogive to find:
the number of students whose height is less than 148 cm.
View Solutionयदि 6 छात्रों का औसत भार 50 किग्रा है तथा 2 छात्रों का औसत भार 51 किग्रा है तथा 2 छात्रों का औसत भार 55 किग्रा है तो सभी 10 छात्रों का औसत भार ज्ञात करें।
View Solutionनिम्नलिखित में से कौन-कौन-सी व्युत्क्रमानुपात में विचरण करती है-
छात्रों की संख्या और प्रति छात्र वितरित मिठाई का वजन (यदि 40 किग्रा मिठाई बाँटनी है)।
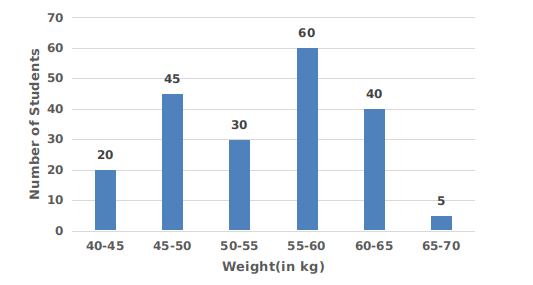
View SolutionThe following histogram shows the weights of students of class X in a school on a particular day. Total number of students enrolled in class X = 200.

The number of students weighing less than 55 kg is what percentage less than the number of students weighing 55 kg to 65 kg?
View Solutionएक कक्षा के विद्यार्थियों के भार का माध्य 46 किग्रा. है। इनमें छात्रों का औसत भार 50 किग्रा. और छात्राओं का औसत भार 40 किग्रा है। छात्रों और छात्राओं की संख्या का अनुपात ज्ञात कीजिए।
View SolutionThe weight of 50 students is given in kg in the following array, the weight of the students will be the polymer-
View SolutionThe mean weight of a group of 9 students is 19 kg . If a body of weight 29 kg is joined in the group , then find the mean weight of 10 students.
The following are the steps involved in solving the above problem . Arrange them in sequential order .
(A) The mean weight of 10 students = kg
(B) The total weight of 9 students = kg = 171 kg
(C) The total weight of 10 students = (171 + 29) kg = 200 kg
(D) The mean weight = 20 kg
View SolutionFollowing table shows the weights of 12 students: Weight (in kgs): 67 70 72 73 75 No. of Students: 4 3 2 2 1 Find the mean weight.
View SolutionThe following frequency distribution shows the weight of students in a class. (a) Find the percentage of students whose weight is more than 50 kg. (b) If the weight column provided is of mid values then find the percentage of students whose weight is more than 50 kg.
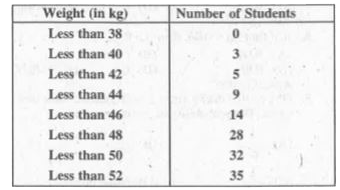
View SolutionDuring the medical check-up of 35 students of a class, their weights were recorded as follows:Draw a less than type ogive for the given data. Hence obtain the median weight from the graph and verify the result by using the formula.
View SolutionFind the mode of the given data 4,5,5,4,7,2,3,4,2,4,5
View SolutionDuring the medical check up of 35 students of a class, their weights were recorded as follows :
Draw a less then type ogive for the given data. Hence obtain the median weight from the graph and verify the result by using the formula.

View Solution