The following histogram shows the weights of students of class X in a school on a particular day. Total number of students enrolled in class X = 200.
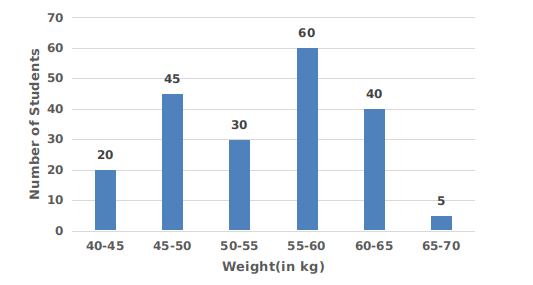
The number of students weighing less than 55 kg is what percentage less than the number of students weighing 55 kg to 65 kg?
1
8
5
7
The correct Answer is:C
Step by step video & image solution for The following histogram shows the weights of students of class X in a school on a particular day. Total number of students enrolled in class X = 200. The number of students weighing less than 55 kg is what percentage less than the number of students weighing 55 kg to 65 kg? by Maths experts to help you in doubts & scoring excellent marks in Class 14 exams.
Updated on:21/07/2023Similar Questions
The given graph shows the weights of students in a school on a particular day.
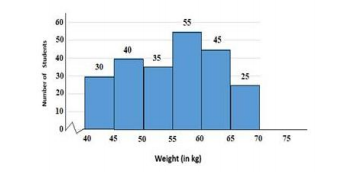 The number of students weighing less than 50 kg is what per cent less than the number of students weighing 55 kg or more?
View SolutionThe given graph shows the weights of students in a school on a particular day.
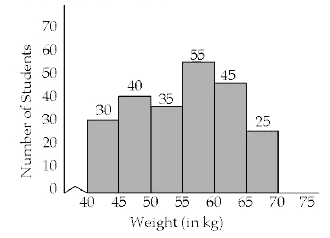
The number of students weighing less than 50kg is what percent less than the number of students weighing 55kg or more?
View Solution
Knowledge Check
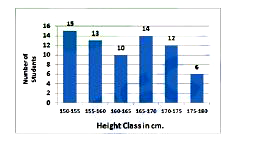
In the given histogram, the number of students whose height is in the class interval 175 - 180 is what percent less than the number of students whose height is in the class interval 160 - 165?A503%B40%C0.6D2003%
The following histogram shows the weight of the students of class X in a school on a particular day. Total number of students enrolled in the class X = 200.
निम्नलिखित हिस्टोग्राम किसी एक दिन पर एक स्कूल में दसवीं कक्षा के छात्रों के वजन को दर्शाता है। कक्षा - 200 में नामांकित कुल छात्र।
The number of students weighing less than 55kg is what percentage less than the number of students weighing 55kg to 65kg?
55 किग्रा से कम वजन वाले छात्रों की संख्या 55 किग्रा से किग्रा तक वाले छात्रों की संख्या से कितने प्रतिशत काम है ज्ञात करे |
View SolutionThe following bar graph shows the number of students in different classes of a school.
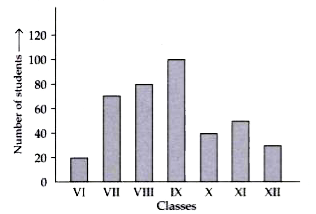
How many more students are there in Class IX than in Class VIII ?
View SolutionIn th given histogram, the number of students whose height is the class interval 175-180 is what percent less than the number of students whose height is in the class interval 160-165
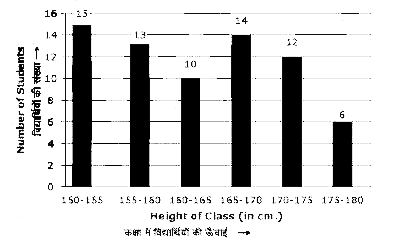
View SolutionThe given histogram shows the height of the students.
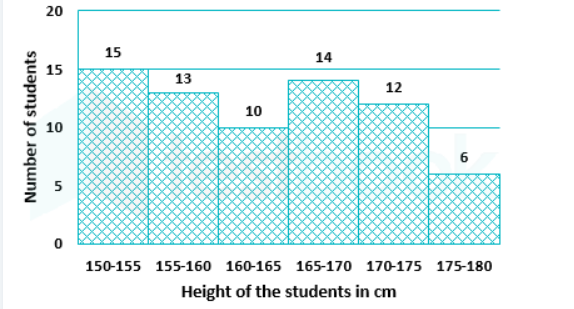
The number of students whose height is in the class interval 165-170 is what percentage less than the number of students whose height is in the interval 150- 155? (correct to one decimal place)
View SolutionThe given bar graph, shows the number of students in different classes.
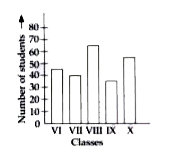
Find the total number of students in the classes VIII to X.
View SolutionDirection: There are 1250 total students in 5 different classes in a school. The number of students in class I is 50 less than the number of students in class II. The number of class IV students is 50 more than the number of students in class II. The average number of students in class III and class V is 250. The number of students in class III is 10% less than the number of students in class I.
The ratio of the total number of students of class V to the total number of students of class III is
View SolutionDirection: There are 1250 total students in 5 different classes in a school. The number of students in class I is 50 less than the number of students in class II. The number of class IV students is 50 more than the number of students in class II. The average number of students in class III and class V is 250. The number of students in class III is 10% less than the number of students in class I.
The total number of students of class IV and the number of students of class II is
View Solution
