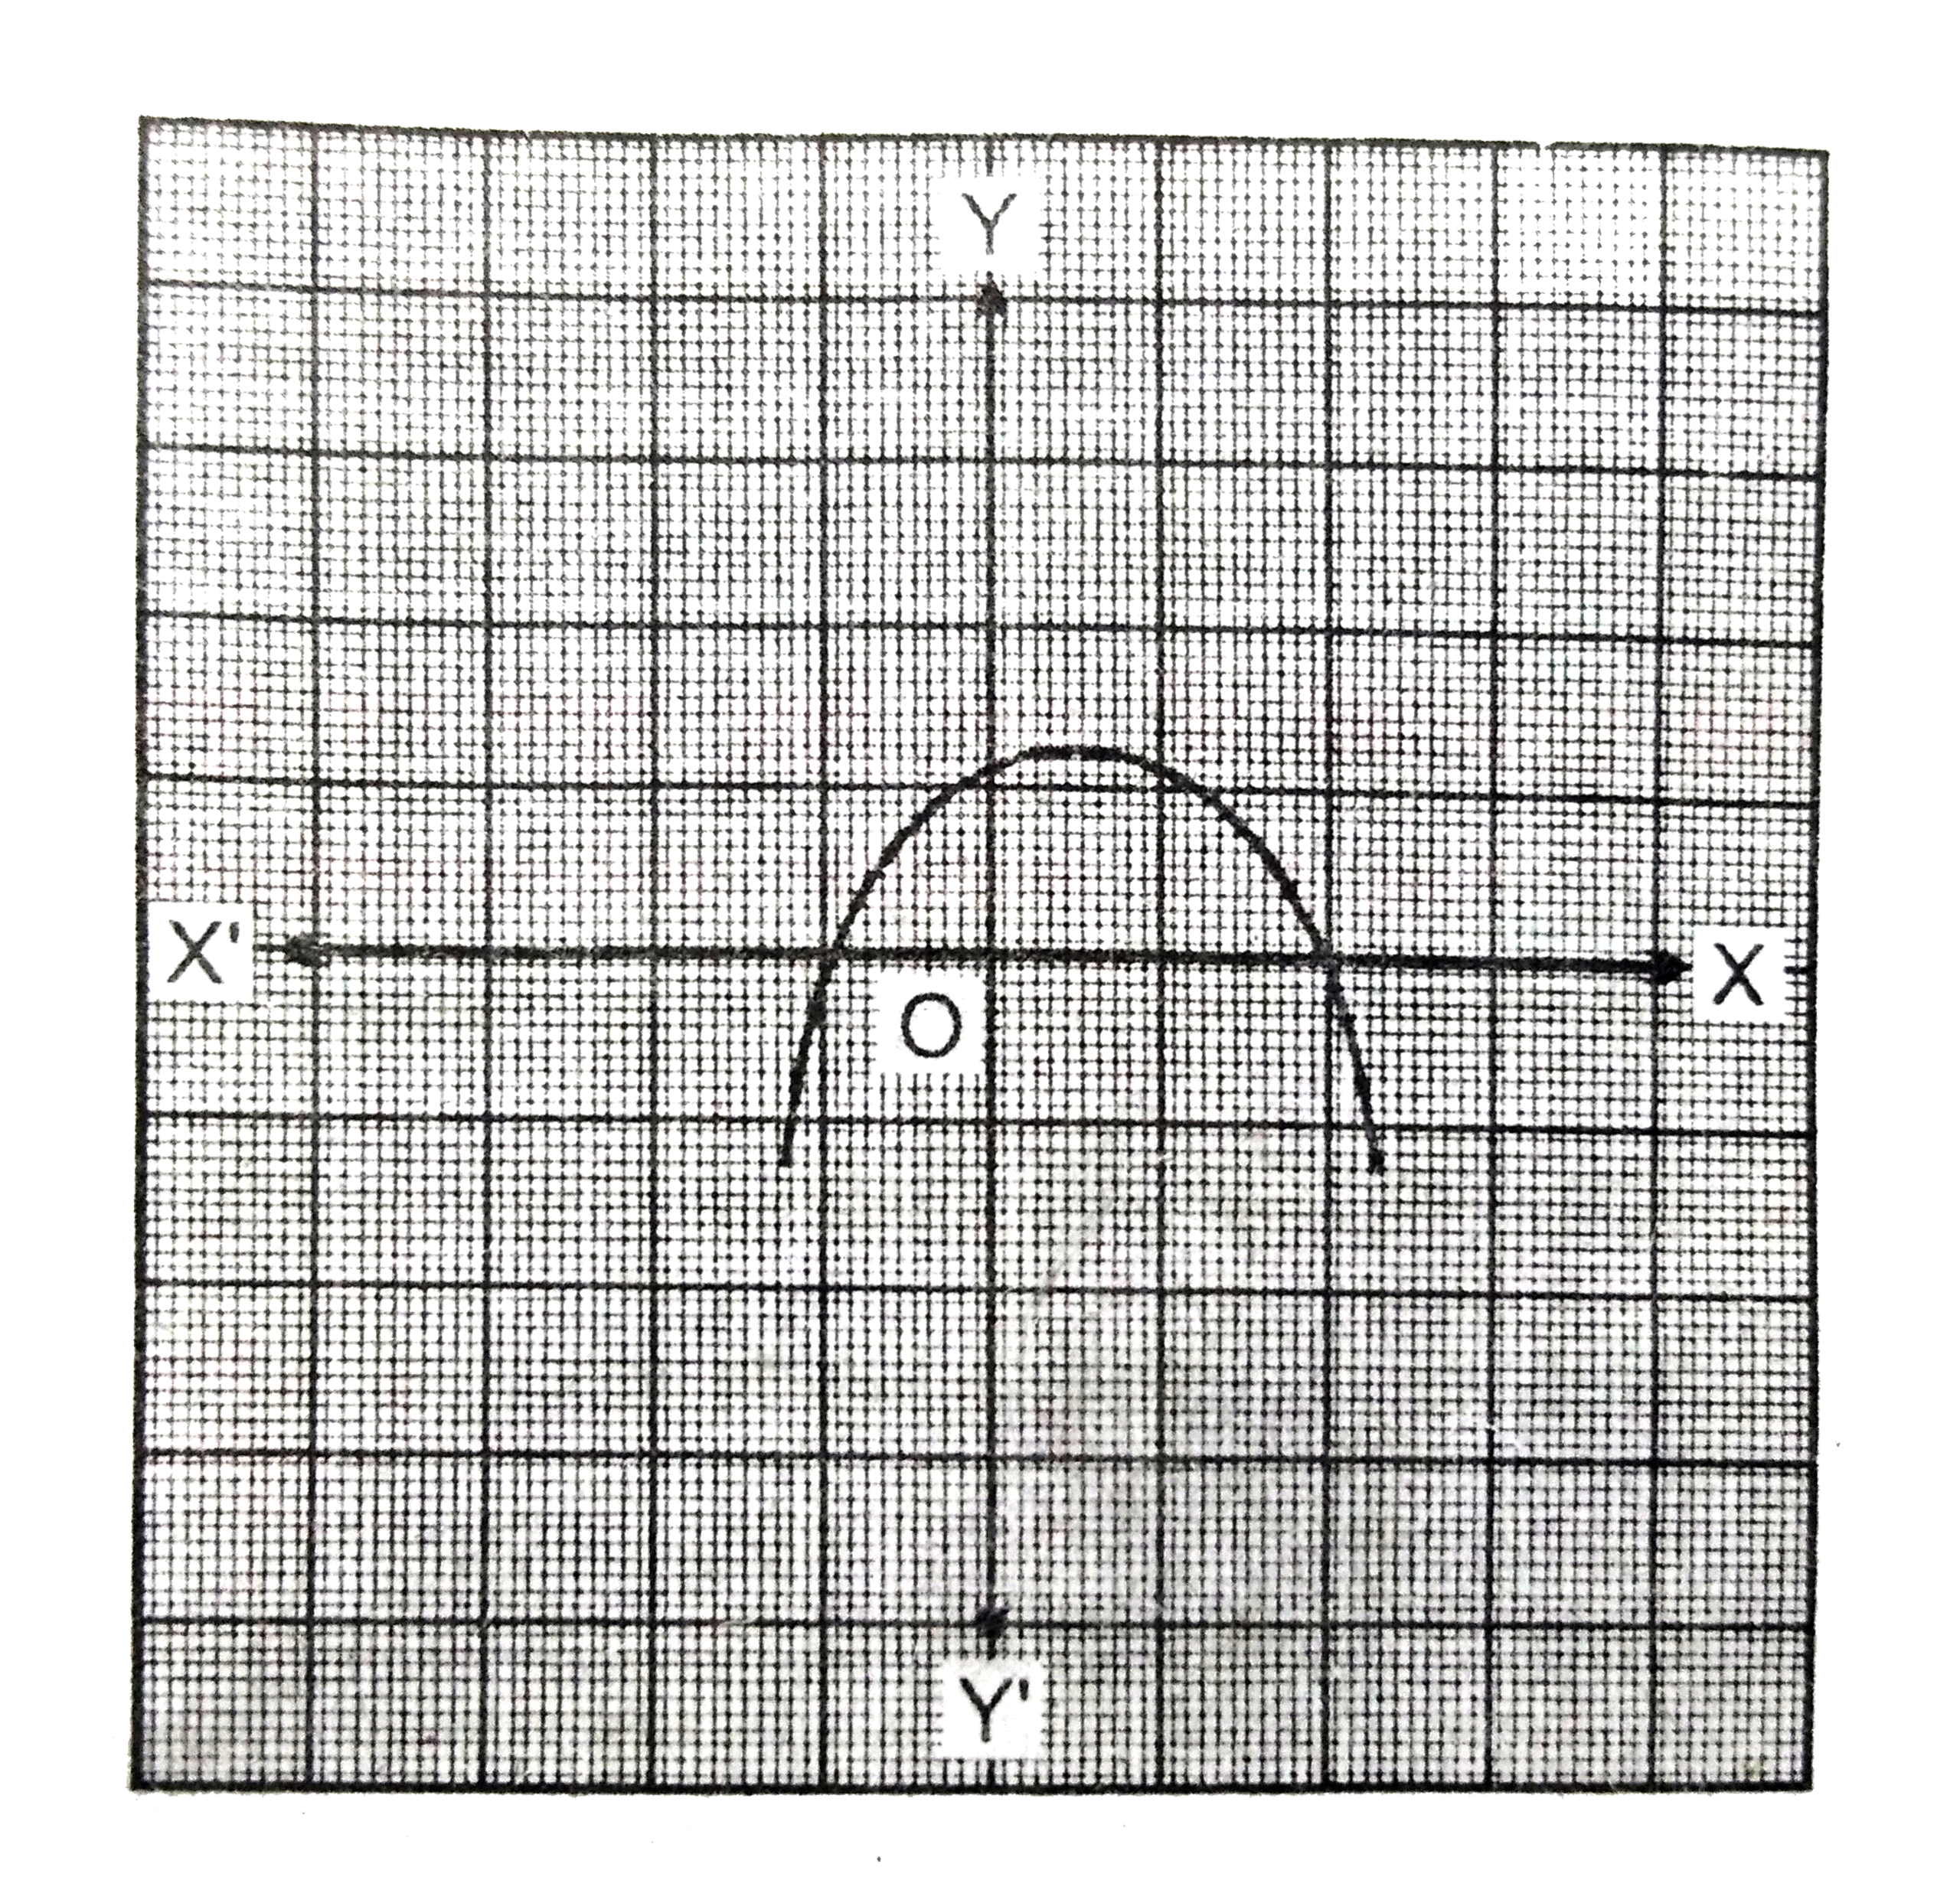
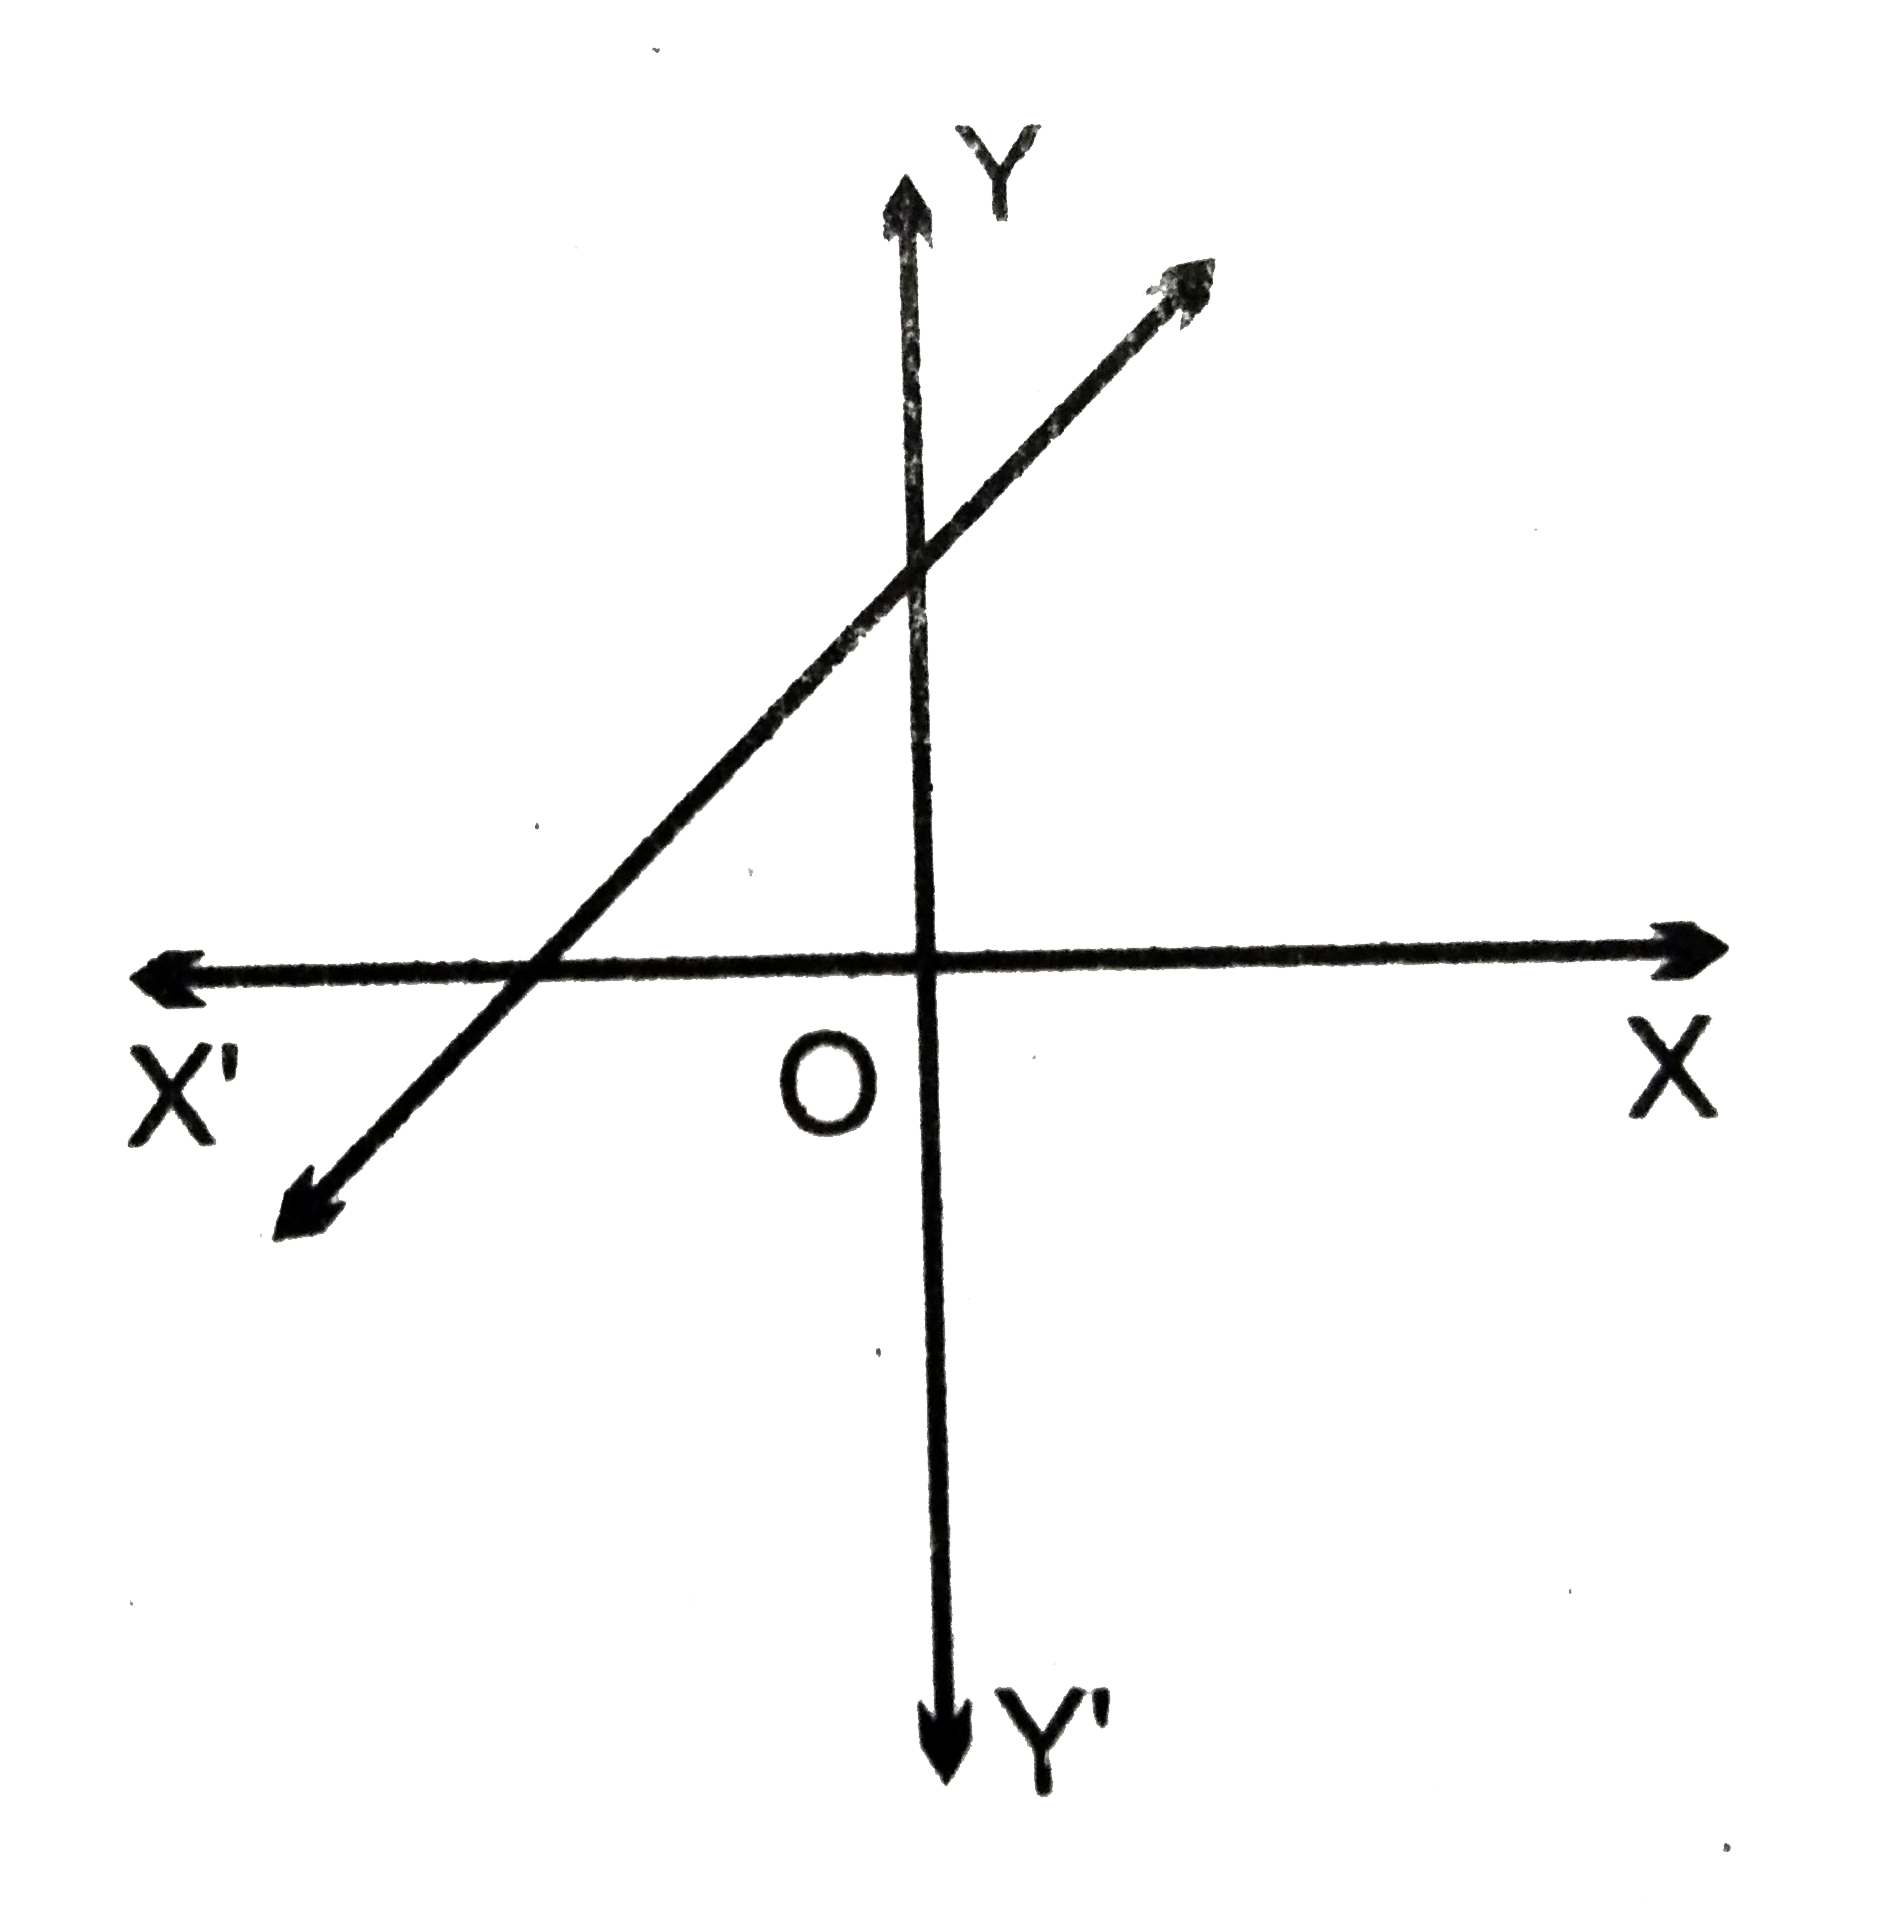
नीचे चित्र में y=p(x) के आलेख दिया गया है जहाँ p(x) एक बहुपद है | प्रत्येक स्थिति में शून्यांक की संख्या ज्ञात करें

The correct Answer is:2
Step by step video & image solution for नीचे चित्र में y=p(x) के आलेख दिया गया है जहाँ p(x) एक बहुपद है | प्रत्येक स्थिति में शून्यांक की संख्या ज्ञात करें by Maths experts to help you in doubts & scoring excellent marks in Class 10 exams.
Updated on:21/07/2023Topper's Solved these Questions
- बहुपद BOOK - KC SINHACHAPTER - बहुपद EXERCISE - अभ्यास 2.2
50 Videos
- बहुपद BOOK - KC SINHACHAPTER - बहुपद EXERCISE - अभ्यास 2.3
71 Videos
- बहुपद BOOK - KC SINHACHAPTER - बहुपद EXERCISE - उदाहरण
52 Videos
- प्रायिकता या सम्भावितBOOK - KC SINHACHAPTER - प्रायिकता या सम्भावितEXERCISE - वस्तुनिष्ठ प्रश्न
54 Videos
- रचनाएँ BOOK - KC SINHACHAPTER - रचनाएँ EXERCISE - अभ्यास 11.1
14 Videos
Similar Questions
x2−3 द्विघात बहुपद के शून्यांक ज्ञात करें और शून्यांक और गुणांक के बिच के सम्बन्ध की सत्यता की जाँच करें |
View Solutionp(x)=2x3+3x+1 को q(x)=x+2 से भाग दें तो भागफल एवं शेषफल ज्ञात करें | क्या q(x),2x3+3x+1 का एक गुणनखंड है ?
View Solutionनिचे दिया गया बहुपद के आलेख को देखकर बतायें कि ये एक-घातीय है या द्विघातीय है अथवा न एक-घातीय है और न द्विघातीय |

View Solutionदो सिक्के उछालने में दो पट आने के प्रायिकता है:
View Solution5.6 cm लम्बा एक रेखाखण्ड खींचे और इसे 5:8 के अनुपात में अतः विभक्त करें | दोनों भागो को मापे |
View SolutionHow many lines of symmetry does the above figure have ?
View SolutionWhich of the following are correct chain isomers of butane ? (i)
View SolutionDetermine the point of symmetry of a regular hexagon.
View SolutionDtermine the images of the following figure about the given line :
View SolutionMatch the following Column A to Column B

View SolutionMatch the following Column A to Column B

View SolutionMatch the following Column A to Column B

View SolutionThe inequation represented by the graph given below is :
View SolutionThe inequation that best describes the graph given below is _________
View SolutionThe inequation that best describes the following graph is _________
View SolutionWhich inequations represent the shaded region in the given figure
View Solution
