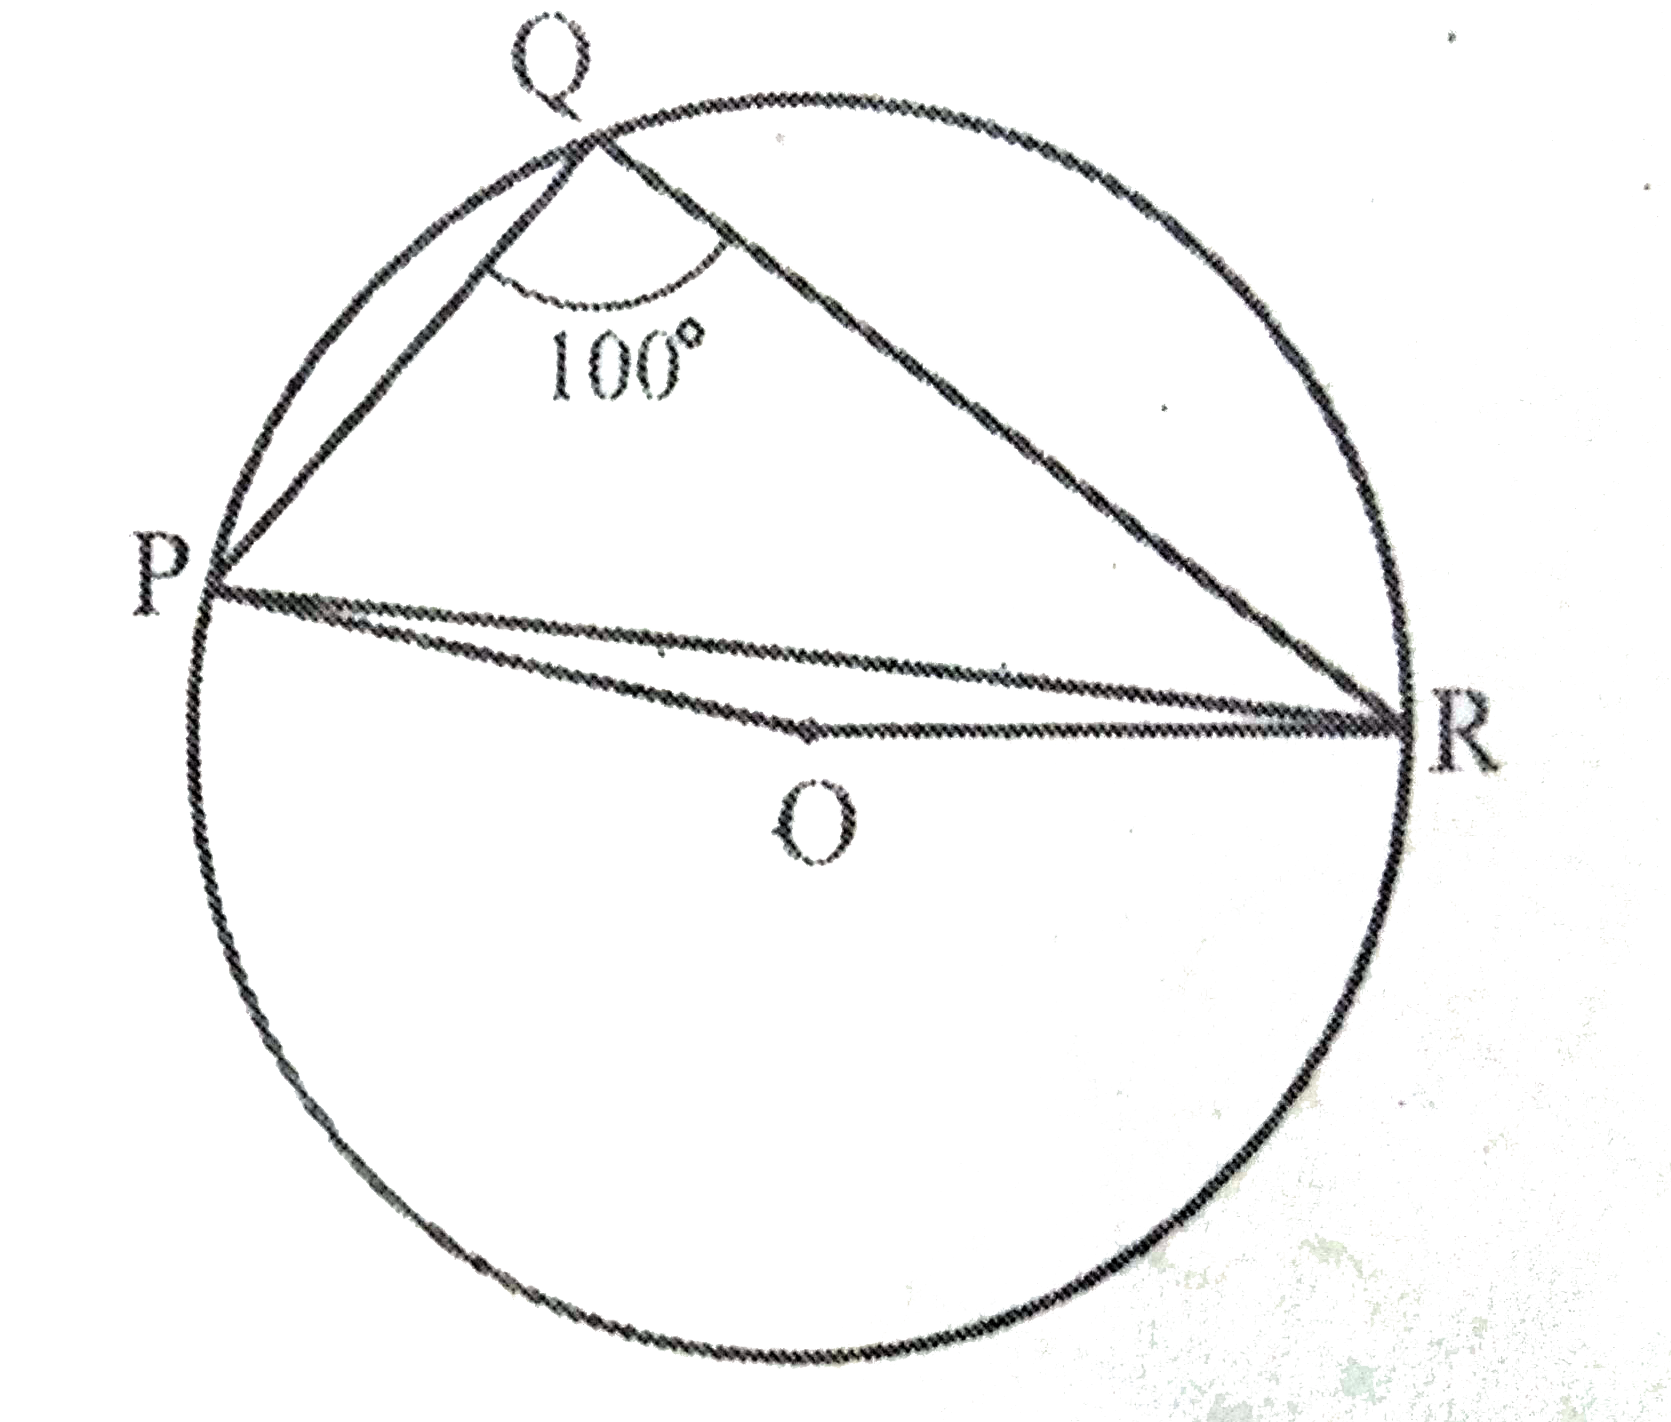
आकृति 10.37 में, ∠PQR=100∘ है जहाँ P, Q तथा R केंद्र O वाले एक वृत्त पर स्थित बिंदु है ∠OPR ज्ञात कीजिए।

90∘
70∘
50∘
10∘
The correct Answer is:A
Step by step video & image solution for आकृति 10.37 में, angle PQR=100^(@) है जहाँ P, Q तथा R केंद्र O वाले एक वृत्त पर स्थित बिंदु है angle OPR ज्ञात कीजिए। by Maths experts to help you in doubts & scoring excellent marks in Class 9 exams.
Updated on:21/07/2023Topper's Solved these Questions
- वृत्तBOOK - NCERT HINDICHAPTER - वृत्तEXERCISE - प्रश्नावली 10.6
10 Videos
- वृत्तBOOK - NCERT HINDICHAPTER - वृत्तEXERCISE - प्रश्नावली 10.4
6 Videos
- रेखाए कोण BOOK - NCERT HINDICHAPTER - रेखाए कोण EXERCISE - प्रश्नावली 6.3
6 Videos
- संख्या पद्धतिBOOK - NCERT HINDICHAPTER - संख्या पद्धतिEXERCISE - प्रश्नावली 1.6
3 Videos
Similar Questions
सिद्ध कीजिए कि दो प्रतिच्छेद करते हुए वृत्तों की केन्द्रो की रेखा दोनों प्रतिच्छेद बिंदुओं पर समान कोण अंतरित करती है।
View Solution5 सेमी तथा 3 सेमी त्रिज्या वाले दो वृत्त दो बिन्दुओ पर प्रतिच्छेद करते है तथा उनके केन्द्रो के बीच की दूरी 4 सेमी है। उभयनिष्ठ जीवा की लम्बाई ज्ञात कीजिए।
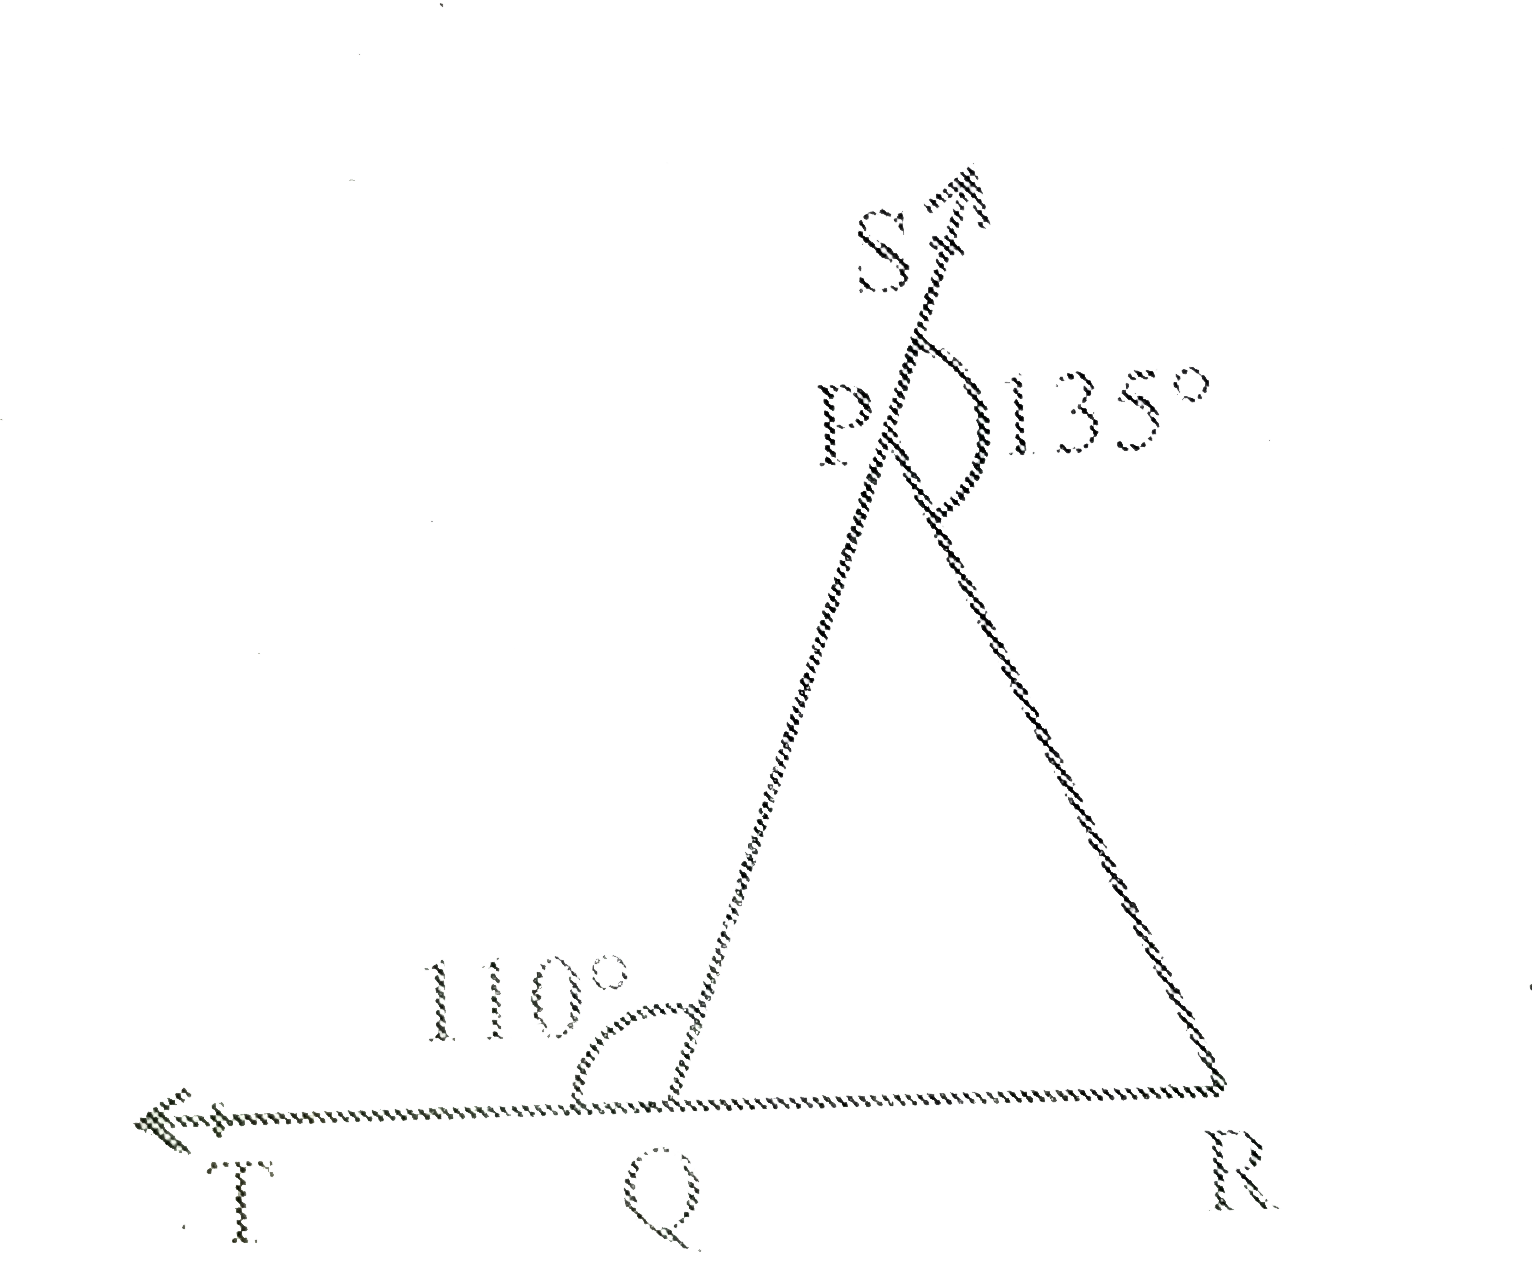
View Solutionआकृति 6.39 में ΔPQR की भुजाओं QP और RQ क्रमश : बिंदुओं S और T तक बढ़ाया गया है । यदि ∠SPR=135∘ है और ∠PQT=110∘ है, तो ∠PQR ज्ञात कीजिये ।

View Solutionज्ञात कीजिए : (i) 6412 (ii)3215 (iii)12513
View SolutionHow many lines of symmetry does the above figure have ?
View SolutionWhich of the following are correct chain isomers of butane ? (i)
View SolutionDetermine the point of symmetry of a regular hexagon.
View SolutionDtermine the images of the following figure about the given line :
View SolutionIn the given figure, AB is a diameter, O is the center of the circle and ∠OCB=50∘ then find ∠DBC.
View SolutionMatch the following Column A to Column B

View SolutionMatch the following Column A to Column B

View SolutionMatch the following Column A to Column B

View SolutionThe inequation represented by the graph given below is :
View SolutionThe inequation that best describes the graph given below is _________
View SolutionThe inequation that best describes the following graph is _________
View SolutionWhich inequations represent the shaded region in the given figure
View Solution
