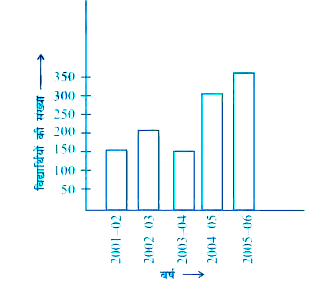
निम्न दंड-आलेख को पढ़िए और निम्नलिखित प्रश्नों के उत्तर दीजिए -
(a) यह दंड-आलेख क्या सूचना प्रदर्शित करता है?
(b) किस वर्ष में विद्यार्थियों की संख्या सबसे अधिक थी?
(c) किस वर्ष में विद्यार्थियों की संख्या 2001-02 की तुलना में दोगुनी थी?
(d) किस वर्ष में विद्यार्थियों की संख्या उसके पिछले वर्ष की तुलना में कम हुई?
(e) किस वर्ष में विद्यार्थियों की संख्या पिछले वर्ष की तुलना में सबसे अधिक बढ़ी?

The correct Answer is:(a) विभिन्न - वर्षों में विधार्थियों की संख्या (b) 200-06
(c) 2004 - 05 (d) 2003 - 04 (e) 2004 - 05
Step by step video, text & image solution for निम्न दंड-आलेख को पढ़िए और निम्नलिखित प्रश्नों के उत्तर दीजिए - (a) यह दंड-आलेख क्या सूचना प्रदर्शित करता है? (b) किस वर्ष में विद्यार्थियों की संख्या सबसे अधिक थी? (c) किस वर्ष में विद्यार्थियों की संख्या 2001-02 की तुलना में दोगुनी थी? (d) किस वर्ष में विद्यार्थियों की संख्या उसके पिछले वर्ष की तुलना में कम हुई? (e) किस वर्ष में विद्यार्थियों की संख्या पिछले वर्ष की तुलना में सबसे अधिक बढ़ी? by Maths experts to help you in doubts & scoring excellent marks in Class 6 exams.
Updated on:21/07/2023Topper's Solved these Questions
- आंकड़ों का प्रबंधन BOOK - NCERT EXEMPLAR HINDICHAPTER - आंकड़ों का प्रबंधन EXERCISE - प्रश्नावली (रिक्त स्थान)
7 Videos
- अनुपात और समानुपातBOOK - NCERT EXEMPLAR HINDICHAPTER - अनुपात और समानुपातEXERCISE - प्रश्नावली
89 Videos
- एकक-1BOOK - NCERT EXEMPLAR HINDICHAPTER - एकक-1EXERCISE - प्रश्नावली- रिक्त स्थानों की पूर्ति कीजिए
102 Videos
Similar Questions
______ संख्याओं का एक संग्रह है जो सार्थक सूचना प्राप्त करने के लिए एकत्रित की जाती हैं।
View Solution8 पुस्तकों का 20 पुस्तकों से अनुपात है -
View Solution(i) 10 मिलियन =.................करोड़
(ii) 10 लाख =.................मिलियन
View SolutionThe given Bar Graph presents the number of students of two schools for six years. दिया गया दंड आरेख छः वर्ष की अवधि में दो विद्यालयों में छात्रों की संख्या को दर्शाता है | In which year, the absolute difference between the numbers of students in two schools is the highest? किस वर्ष में, दोनों विद्यालयों में छात्रों की संख्या के बीच पूर्ण अंतर सबसे अधिक है ?
View SolutionThe given Bar Graph presents the number of students of two schools for six years. दिया गया दंड आरेख छः वर्ष की अवधि में दो विद्यालयों में छात्रों की संख्या को दर्शाता है | In which year, the percentage increase in students in school B is the highest in comparison to its previous year? किस वर्ष में, विद्यालय B में छात्रों की संख्या में प्रतिशत वृद्धि इसके पिछले वर्ष की तुलना में सबसे अधिक रही है?
View SolutionThe given Bar Graph presents the number of students of two schools for six years. दिया गया दंड आरेख छः वर्ष की अवधि में दो विद्यालयों में छात्रों की संख्या को दर्शाता है | In which year, the percentage increase of students in school A is the highest in comparison to its previous year? किस वर्ष, विद्यालय A में छात्रों की संख्या में प्रतिशत वृद्धि पिछले वर्ष की तुलना में सर्वाधिक है ?
View SolutionThe given Bar Graph presents the number of students of two schools for six years. दिया गया दंड आरेख छः वर्ष की अवधि में दो विद्यालयों में छात्रों की संख्या को दर्शाता है | In which year the percentage increase in the number of total students in schools A and B taken together is the highest in comparison to its previous year? किस वर्ष विद्यालय A और B को मिलाकर कुल छात्रों की संख्या में प्रतिशत वृद्धि पिछले वर्ष की तुलना में सर्वाधिक है ?
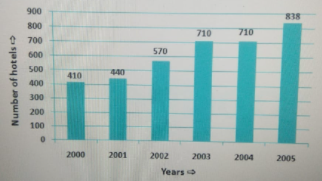
View SolutionStudy the chart and answer the questions:
In which of the given years is the percentage increase in the number of hotels in comparison to the previous year, is the maximum?
चार्ट का अध्ययन करें और प्रश्नों का उत्तर दें:पिछले वर्ष की तुलना में होटलों की संख्या में किस वर्ष में अधिकतम प्रतिशत वृद्धि हुई है?
View SolutionThe given Bar Graph presents the number of students enrolled for vocational course institutes A and B during a period of 5 years. In which year the number of students enrolled in B is x% more, where 25 lt x lt 30 , then the number of students enrolled in A in the same year? दिया गया दंड आरेख (बार ग्राफ) 5 वर्ष की अवधि के दौरान संस्थान A और B में व्यावसायिक पाठ्यक्रम के लिए नामांकित विद्यार्थियों की संख्या को दर्शाता है| किस वर्ष में संस्थान B में नामांकित विद्यार्थियों की संख्या उसी वर्ष संस्थान A में नामांकित विद्यार्थियों की संख्या से x % अधिक है, जहां 25 lt x lt 30 है?
View SolutionThe given Bar Graph presents the number of students of two schools for six years. दिया गया दंड आरेख (बार ग्राफ) छह वर्षो के दौरान दो स्कूलों में विद्यार्थियों की संख्या को दर्शाता है| In which year, the percentage increase in students in school B is the highest in comparison to its previous year? किस वर्ष में, स्कूल B के विद्यार्थियों की संख्या में प्रतिशत वृद्धि इसके पिछले वर्ष की तुलना में सबसे अधिक है?
View SolutionThe given Bar Graph presents the number of students of two schools for six years. दिया गया दंड आरेख (बार ग्राफ) छह वर्षो के दौरान दो स्कूलों में विद्यार्थियों की संख्या को दर्शाता है| In which year, the absolute difference of the students in two schools is the lowest? किस वर्ष में, दोनो स्कूलों के विद्यार्थियों की संख्या का निरपेक्ष अंतर सबसे कम है?
View SolutionThe given Bar Graph presents the number of students of two schools for six years. दिया गया दंड आरेख (बार ग्राफ) छह वर्षो के दौरान दो स्कूलों में विद्यार्थियों की संख्या को दर्शाता है| In which year, percentage increase of students in school A is the highest in comparison to its previous year ? किस वर्ष में, स्कूल A की विद्याथियों की संख्या में प्रतिशत वृद्धि इसके पिछले वर्ष की तुलना में सबसे अधिक है?
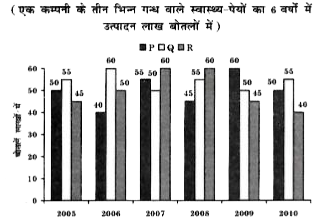
View SolutionIn which of the following years the percentage of rise or fall in production from the previous year is maximum for the flavour of Q ?
निम्न में से किस वर्ष में, पिछले वर्ष की तुलना में गन्ध Q के उत्पादन में वृद्धि या हास अधिकतम रहा है?

View Solution
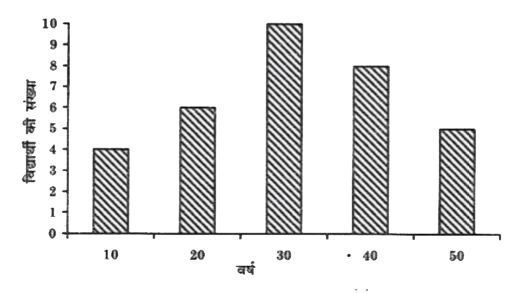
The least number of students got the marks in the interval.
किस अंतराल में अंक प्राप्त करने वाले विद्यार्थियों की न्यूनतम संख्या थी?
View SolutionThe following figure shows the number of students (in thousands) admitted and passed out per your in a college during years 2000 to 2004, study the figure and answer the questions : : निम्नलिखित आकृति में किसी कॉलेज में वर्ष 2000 से वर्ष 2004 तक प्रति वर्ष भर्ती हुए और उर्तीण हुए छात्रों की संख्या (हजार में) दर्शायी गई है। आकृति का अध्ययन कर प्रश्नों के उत्तर दीजिए : The percent increase in the number of students admitted in the year 2003 over that in 2001 is वर्ष 2001 की तुलना में वर्ष 2003 में भर्ती हुए छात्रों की संख्या में हुई प्रतिशत वृद्धि कितनी है ?
View Solutionनिम्नलिखित में से किस उपसहसंयोजक यौगिक में समावयवियों की अधिकतम संख्या होती है?
View Solution
