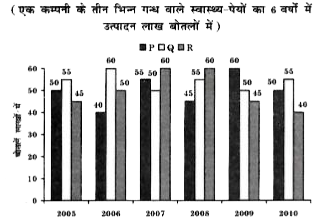
In which of the following years the percentage of rise or fall in production from the previous year is maximum for the flavour of Q ?
निम्न में से किस वर्ष में, पिछले वर्ष की तुलना में गन्ध Q के उत्पादन में वृद्धि या हास अधिकतम रहा है?

2010
2006
2007
2009
The correct Answer is:C
ग्राफ से यह स्पष्ट है कि वर्ष 2007 में 2006 की तुलना में गन्ध ए का हास अधिकतम है।
Similar Questions
Study the given chart carefully and answer the question accordingly:
दिए गए चार्ट का ध्यानपूर्वक अध्ययन करें और उसके अनुसार प्रश्न का उत्तर दें: In which of the following years was the percentage increase in production from the previous year, the maximum among the given years?
पिछले वर्ष की तुलना में निम्नलिखित वर्षों में से किस वर्ष में उत्पादन में अधिकतम प्रतिशत वृद्धि हुई?
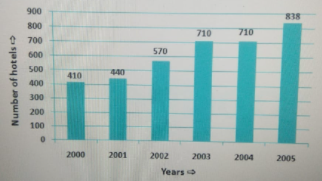
View SolutionStudy the chart and answer the questions:
In which of the given years is the percentage increase in the number of hotels in comparison to the previous year, is the maximum?
चार्ट का अध्ययन करें और प्रश्नों का उत्तर दें:पिछले वर्ष की तुलना में होटलों की संख्या में किस वर्ष में अधिकतम प्रतिशत वृद्धि हुई है?
View Solution
Knowledge Check
निम्न में से किस विलायक में Nacl की विलेयता अधिकतम होती है?
AH2OBC2H5OHCCH3COCH3DC2H5OC2H5Who among the following is third to the right of Q?
निम्न में से कौन के दायें तीसरा है?APBRCUDVIn which of the following ruler court the largest number of gulam or Slave was
निम्न में से किस शासक के दरबार में सबसे अधिक गुलाम थे?ABalban/ बलबनBAlauddin Khiljee / अलाउद्दीन खिलजीCMohammad Bin Tuglaq / मुहम्मद बिन तुगलकDFiroz Tuglaq / फिरोज तुगलक
The following graph shows the number of boys and girls in class V, class VI, class VII and class VIII. Study the graph and answer the question.
निम्नलिखित आरेख कक्षा V, कक्षा VI, कक्षा VII और कक्षा VIII में लड़कों और लड़कियों की संख्या दर्शाता है। आरेख का अध्ययन करें और प्रश्न का उत्तर दें। In which class, the percentage increase in the number of boys as compared to its previous class is least?
किस कक्षा में लड़कों की संख्या में पिछले कक्षा की तुलना में प्रतिशत की वृद्धि सबसे कम है?
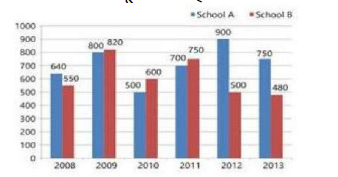
View SolutionThe given Bar Graph presents the number of students of two schools for six years.
दिया गया दंड आरेख छः वर्ष की अवधि में दो विद्यालयों में छात्रों की संख्या को दर्शाता है | In which year, the percentage increase in students in school B is the highest in comparison to its
previous year?
किस वर्ष में, विद्यालय B में छात्रों की संख्या में प्रतिशत वृद्धि इसके पिछले वर्ष की तुलना में सबसे अधिक रही है?
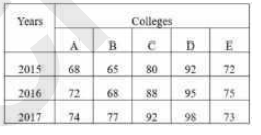
View SolutionThis table shows the percentage of students passing out of five different colleges over three years. It is given that from each college, 200 students appeared every year.
यह तालिका तीन वर्षों में पांच अलग-अलग कॉलेजों से पास करने वाले छात्रों का प्रतिशत दर्शाती है | यह दिया गया है कि प्रत्येक कॉलेज से हर वर्ष 200 छात्र शामिल हुए | What is the approximate percentage increase in the number of students passing out of college B in the year 2017 as compared to the previous year?
कॉलेज B से वर्ष 2017 में पास करने वाले छात्रों की संख्या में पिछले वर्ष की तुलना में लगभग कितने प्रतिशत की वृद्धि हुई है ?
View SolutionIn which of the following food item of same quantity maximum calorie is found? निम्नलिखित में से किस खाद्य पदार्थ में एक-ही मात्रा में अधिकतम कैलोरी मान विद्यमान है?
View Solutionनीचे दिए गए आयनो के युग्म में से किस युग्म के लिए पहला आयन दूसरे की तुलना में अधिक स्थायी है?
View Solution
