(a) से (b) तक कुछ चित्र दिय हुए है | बताइये उनमे से कौन निम्ननलिखित को दर्शाता है :

3×15=35
The correct Answer is:35
Topper's Solved these Questions
- भिन्न एवं दशमलव Book:STUDENTS FRIENDSChapter:भिन्न एवं दशमलव Exercise:EXERCISE 2A ( Type I. भिन्नों के योग एवं वयवकलन (घटाव) पर आधारित प्रश्न :)
Explore 8 Videos
- भिन्न एवं दशमलव Book:STUDENTS FRIENDSChapter:भिन्न एवं दशमलव Exercise:EXERCISE 2A ( Type II. भिन्नों की तुलना पर आधारित प्रश्न :)
Explore 4 Videos
- बीजीय व्यंजक Book:STUDENTS FRIENDSChapter:बीजीय व्यंजक Exercise:Exercise 5D
Explore 3 Videos
- राशियों की तुलनाBook:STUDENTS FRIENDSChapter:राशियों की तुलनाExercise:EXERCISE 7E
Explore 29 Videos
Similar Questions
ज्ञात करे :
911−415
View Solutionनिम्नलिखित को अवरोही क्रम में सजाएँ :
29,23,821
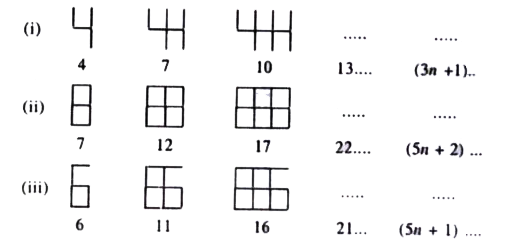
View Solutionबराबर लम्बाई के रेखाखंडो से बनाए गए अंको के निम्नांकित पैटर्न को देंखे तथा n=5,10,100 के लिए रेखाखंडो की संख्या बताएँ।

View Solutionमिश्रधन = मूलधन …………… ब्याज
View SolutionIdentify the cell organelle 'A' :-
ltimg src="https://d10lpgp6xz60nq.cloudfront.net/physics_images/ALN_BIO_C10_E08_018_Q01.png" width="80%"gt
View SolutionHow many lines of symmetry does the above figure have ?
View SolutionWhich of the following are correct chain isomers of butane ? (i)
View SolutionDetermine the point of symmetry of a regular hexagon.
View SolutionDtermine the images of the following figure about the given line :
View SolutionMatch the following Column A to Column B

View SolutionMatch the following Column A to Column B

View SolutionMatch the following Column A to Column B

View SolutionThe inequation represented by the graph given below is :
View SolutionThe inequation that best describes the graph given below is _________
View SolutionThe inequation that best describes the following graph is _________
View SolutionWhich inequations represent the shaded region in the given figure
View Solution
