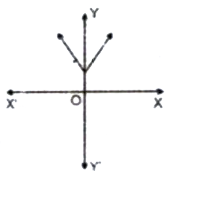
नीचे दिए गए बहुपदों के आलेख को देखकर जाँच करें कि वे एकघातीय है, द्विघातीय है या एकघातीय है और न द्विघातीय है |

The correct Answer is:आलेख न परवलय है और नही सरल रेखा है। न एक घातीय बहुपद है और न ही द्विघातीय बहुपद है!
Step by step video, text & image solution for नीचे दिए गए बहुपदों के आलेख को देखकर जाँच करें कि वे एकघातीय है, द्विघातीय है या एकघातीय है और न द्विघातीय है | by Maths experts to help you in doubts & scoring excellent marks in Class 10 exams.
Updated on:21/07/2023Topper's Solved these Questions
- बहुपदBOOK - KIRAN PUBLICATIONCHAPTER - बहुपदEXERCISE - EXERCISE - 2.2
51 Videos
- बहुपदBOOK - KIRAN PUBLICATIONCHAPTER - बहुपदEXERCISE - EXERCISE - 2.3
47 Videos
- प्रायिकता या संभाविता BOOK - KIRAN PUBLICATIONCHAPTER - प्रायिकता या संभाविता EXERCISE - वस्तुनिष्ठ प्रश्न
42 Videos
- वास्तविक संख्याएँ BOOK - KIRAN PUBLICATIONCHAPTER - वास्तविक संख्याएँ EXERCISE - वस्तुनिष्ठ प्रश्न
17 Videos
Similar Questions
x2−3 द्विघात बहुपद के शून्यांक ज्ञात करें और शून्यांक और गुणांक के बिच के सम्बन्ध की सत्यता की जाँच करें |
View Solutionp(x)=2x3+3x+1 को q(x)=x+2 से भाग दें तो भागफल एवं शेषफल ज्ञात करें | क्या q(x),2x3+3x+1 का एक गुणनखंड है ?
View Solutionदो सिक्के उछालने में दो पट आने के प्रायिकता है
View Solution√2 है:
View SolutionIdentify the cell organelle 'A' :-
ltimg src="https://d10lpgp6xz60nq.cloudfront.net/physics_images/ALN_BIO_C10_E08_018_Q01.png" width="80%"gt
View SolutionHow many lines of symmetry does the above figure have ?
View SolutionWhich of the following are correct chain isomers of butane ? (i)
View SolutionDetermine the point of symmetry of a regular hexagon.
View SolutionDtermine the images of the following figure about the given line :
View SolutionMatch the following Column A to Column B

View SolutionMatch the following Column A to Column B

View SolutionMatch the following Column A to Column B

View SolutionFind the area of the figure given below.

View SolutionThe area of the shaded part in the figure given below is ______.

View SolutionThe inequation represented by the graph given below is :
View SolutionThe inequation that best describes the graph given below is _________
View Solution