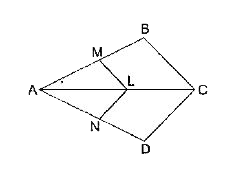
दी गई आकृति में, यदि LM || CB और LN || CD हो, तो सिद्ध कीजिए कि AMAB=ANAD है।

The correct Answer is:AMAB=ANAD
Topper's Solved these Questions
- त्रिभुज BOOK - BHARATI BHAWANCHAPTER - त्रिभुज EXERCISE - प्रश्नमाला 7A
14 Videos
- त्रिभुज BOOK - BHARATI BHAWANCHAPTER - त्रिभुज EXERCISE - प्रश्नमाला 7B
20 Videos
- त्रिकोणमितीय सर्वसमिकाएँ BOOK - BHARATI BHAWANCHAPTER - त्रिकोणमितीय सर्वसमिकाएँ EXERCISE - प्रश्नमाला 13C (बहुवैकल्पिक प्रश्न )
20 Videos
- दो चरों वाले रैखिक समीकरण - युग्म BOOK - BHARATI BHAWANCHAPTER - दो चरों वाले रैखिक समीकरण - युग्म EXERCISE - प्रश्नमाला 3F (बहुवैकल्पिक प्रश्न)
27 Videos
Similar Questions
किसी त्रिभुज ABC की भुजाओं AB और AC पर क्रमशः बिंदु D और E इस प्रकार हैं कि DE||BC है।
यदि AD = 2 cm, AB = 5cm तथा AE = 1.5cm हो, तो EC और AC ज्ञात कीजिए।

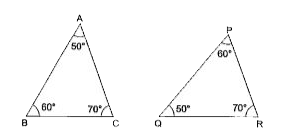
View Solutionबताइए कि निम्नांकित आकृति में दिए गए त्रिभुजों के युग्मों में से कौन-से युग्म समरूप - हैं। उस समरूपता कसौटी को लिखिए जिसका प्रयोग आपने उत्तर देने में किया है, साथ ही समरूप त्रिभुजों को सांकेतिक रूप में व्यक्त कीजिए।

View Solutionयदि sinA+sin2A=1 है, तो व्यंजक (cos2A+cos4A) का मान है
View Solutionयदि 2 x + 3y = 12 तथा 3 x - 2y = 5 है, तो
View SolutionIn the given figure (not to scale), O is the centre of the circle. A,B,C and D are concyclic and AB=CD . If /_MON =120^(@) , then find /_ OPN .
View SolutionHow many lines of symmetry does the above figure have ?
View SolutionWhich of the following are correct chain isomers of butane ? (i)
View SolutionDetermine the point of symmetry of a regular hexagon.
View SolutionDtermine the images of the following figure about the given line :
View SolutionIn the figure above (not to scale), ¯¯¯¯¯¯AB⊥¯¯¯¯¯¯CDandAD is the bisector of ∠BAE.AB=3cm and AC=5cm. Find CD.
View SolutionMatch the following Column A to Column B

View SolutionMatch the following Column A to Column B

View SolutionMatch the following Column A to Column B

View SolutionFind the area of the figure given below.

View SolutionThe area of the shaded part in the figure given below is ______.

View SolutionThe inequation represented by the graph given below is :
View Solution
